the Creative Commons Attribution 4.0 License.
the Creative Commons Attribution 4.0 License.
 | 19 Jun 2018
TAMSAT-ALERT v1: a new framework for agricultural decision support
Dagmawi Asfaw
Emily Black
Matthew Brown
Kathryn Jane Nicklin
Frederick Otu-Larbi
Ewan Pinnington
Andrew Challinor
Ross Maidment
Tristan Quaife
Early warning of weather-related hazards enables farmers, policy makers and aid agencies to mitigate their exposure to risk. We present a new operational framework, Tropical Applications of Meteorology using SATellite data and ground based measurements-AgricuLtural EaRly warning sysTem (TAMSAT-ALERT), which aims to provide early warning for meteorological risk to agriculture. TAMSAT-ALERT combines information on land-surface properties, seasonal forecasts and historical weather to quantitatively assess the likelihood of adverse weather-related outcomes, such as low yield. This article describes the modular TAMSAT-ALERT framework and demonstrates its application to risk assessment for low maize yield in northern Ghana (Tamale). The modular design of TAMSAT-ALERT enables it to accommodate any impact or land-surface model driven with meteorological data. The implementation described here uses the well-established General Large Area Model (GLAM) for annual crops to provide probabilistic assessments of the meteorological hazard for maize yield in northern Ghana (Tamale) throughout the growing season. The results show that climatic risk to yield is poorly constrained in the beginning of the season, but as the season progresses, the uncertainty is rapidly reduced. Based on the assessment for the period 2002–2011, we show that TAMSAT-ALERT can estimate the meteorological risk on maize yield 6 to 8 weeks in advance of harvest. The TAMSAT-ALERT methodology implicitly weights forecast and observational inputs according to their relevance to the metric being assessed. A secondary application of TAMSAT-ALERT is thus an evaluation of the usefulness of meteorological forecast products for impact assessment. Here, we show that in northern Ghana (Tamale), the tercile seasonal forecasts of seasonal cumulative rainfall and mean temperature, which are routinely issued to farmers, are of limited value because regional and seasonal temperature and rainfall are poorly correlated with yield. This finding speaks to the pressing need for meteorological forecast products that are tailored for individual user applications.
- Article
(5175 KB) -
Supplement
(767 KB) - BibTeX
- EndNote


Many African people depend on rain-fed agriculture and are thus vulnerable to drought and other weather-related hazards exacerbated by climate change (Muller et al., 2011). Anticipation of hazard enables farmers and aid agencies to plan ahead, averting disaster (Boyd et al., 2013). Here, we present a new framework for early warning of high meteorological risk to agriculture, the Tropical Applications of Meteorology using SATellite data and ground based measurements-AgricuLtural EaRly warning sysTem (TAMSAT-ALERT). TAMSAT-ALERT integrates an assessment of climatological weather-related risk with forecasts and real-time monitoring of environmental conditions. The framework is intended to be a decision support system, which when combined with socioeconomic assessments, can be used by governmental agencies and NGOs to help farmers manage agricultural risk.
The need for timely information on agricultural risk has motivated the development of a number of drought early warning systems and decision support platforms. The Rainwatch-AfClix early warning system (RWX; http://www.rainwatch-africa.org/rainwatch/, last access: June 2018), for example, provides time series of cumulative rainfall, which are compared against historical time years. Users value the facility to compare the current season against past years, finding that it enables them to intuitively gauge risk (Tarhule et al., 2009). The severity of drought, however, depends not only on rainfall. It is furthermore not straightforward to translate information on meteorological drought (deficit rainfall) into warning of agricultural drought (deficit soil moisture; Black et al., 2016). The need to consider a range of variables and to compare data from a variety of sources is addressed by more comprehensive platforms, such as the Famine Early Warning Systems Network Early Warning Explorer (FEWSNET-EWX; https://earlywarning.usgs.gov/fews/ewx/index.html, last access: June 2018) and International Research Institute (IRI) data library and map rooms (http://iridl.ldeo.columbia.edu/index.html?Set-Language=en, last access: June 2018), which enable users to compare meteorological data with land-surface remote sensing products, such as the normalized difference vegetation index (NDVI) and soil moisture. Such platforms are aimed at expert users capable of interpreting complex, multivariate data. An alternative approach is to use a land-surface model driven with meteorological time series to derive snapshots and forecasts of soil moisture. The Africa Flood and Drought Monitor (AFDM; http://stream.princeton.edu/AWCM/WEBPAGE/interface.php, last access: June 2018), for example, estimates soil moisture using a land-surface model. The model is driven with satellite data for monitoring current conditions with bias-corrected, downscaled forecasts for predicting future conditions (Sheffield et al., 2014). The Africa Flood and Drought Monitor is implemented continent wide, with the aim of monitoring and forecasting metrics related to drought and flood (soil moisture and streamflow). The AFDM does not, however, attempt to predict crop yield at particular localities. There have been several attempts to forecast yield using crop models driven by seasonal forecasts (Hansen and Indeje, 2004; Semenov and Doblas-Reyes, 2007). Mismatches between the scales of the input agronomic and climate data and the lack of skill of the seasonal forecasts proved challenging for these early systems (Hansen and Indeje, 2004). In the last few years there have, however, been marked improvements in the skill of sub-seasonal to seasonal forecasts, leading to greater success for forecasting yield, even in the extratropics where predictability is low. A recent study, for example, demonstrated significant skill for predicting wheat yield in France using a wheat growing model driven with seasonal forecasts (Canal et al., 2017). Previous operational attempts to predict yield using crop models have mainly focused on issuing predictions in advance of sowing. A weather generator approach to providing continually updated assessments was, however, successfully demonstrated for UK winter wheat yield (Bannayan et al., 2003), indicating the potential of this type of approach for operational risk assessment.
TAMSAT-ALERT complements existing systems by providing a means of continually updating yield predictions as the season progresses, in a manner similar to that proposed in Hansen et al. (2006) for characterizing the simulated uncertainty in yield resulting from climatic variability. The TAMSAT-ALERT methodological approach combines the use of historical information, as encapsulated in the RWX methodology, with a land-surface or impact model, as demonstrated in the Africa Drought and Flood Monitor. The system can output any variable or metric that can be generated by the land-surface or impact model. The impact model output and the weather risk associated with the output that can be obtained from TAMSAT-ALERT can be used by governmental and nongovernmental organizations involved with providing farming information and aid, as well as by weather index insurance providers, who require continuously updated assessment of the risk.
In this study, TAMSAT-ALERT is demonstrated through continually updated seasonal assessments of the meteorological risk to agriculture for Ghana. Although an application of TAMSAT-ALERT has been described elsewhere (Brown et al., 2017), this paper is the first formal description and validation of the methodological approach. Section 2 describes the design of the framework and gives brief notes about its implementation. Section 3 describes the implementation of the framework for the assessment of meteorological risk to yield in Ghana. The paper concludes with a discussion of the place that TAMSAT-ALERT has in early warning systems of meteorological hazards and wider decision-making processes (Sect. 4). A user manual for TAMSAT-ALERT is included as a Supplement, and all of the TAMSAT-ALERT scripts are freely available on GitHub.
2.1 Concept
The TAMSAT-ALERT framework provides a means of deriving quantitative agricultural risk assessments from information on the climatology, historical time series and (optionally) meteorological forecasts. In essence, the system addresses this question:
Given the climatology, the state of the land surface, the evolution of the growing season so far, and (optionally) the meteorological forecast, what is the risk of some adverse event?
The “adverse event” is any metric that can be derived either directly from meteorological data or using a model driven with meteorological data. TAMSAT-ALERT is designed to be modular and flexible, enabling users to choose models and datasets to suit their application. So far it has been applied to risk assessments of agricultural drought using the Joint UK Land Environment Simulator (JULES) model (Brown et al., 2017) and to risk assessments of low yield using the General Large Area Model (GLAM) for annual crops (Sect. 3.2.2). In addition, code is supplied for the assessment of purely meteorological metrics, such as cumulative rainfall (Supplement – User Guide).
At a given location and for a given season, the likelihood of an adverse event may depend on past and future weather. Midway through the growing season, for example, the likelihood of low yield depends both on weather in the past and on the likelihood of unfavorable conditions in the coming weeks. In TAMSAT-ALERT, past weather is based on observations, and future weather is based on the climatology. Thus, a 30-year climatology generates a 30-member ensemble of possible yields based on 30 possible weather futures, each of which can be driven through a crop model and used to derive a possible yield. Statistical comparison between the forecast ensemble yield and the climatological ensemble yield leads to quantitative assessments of the risk of unfavorable conditions.
In its default setup, for which meteorological forecast information is not included, TAMSAT-ALERT treats all weather futures as equally likely. The risk assessments can, however, be refined by weighting the ensemble members based on probabilistic forecast information, for example tercile forecasts of cumulative rainfall or mean temperature cumulated and averaged over a 90-day period. Specifically, the value of the metric being forecasted for each ensemble is used to assign that ensemble member to a particular tercile. Each ensemble member is then weighted by the appropriate tercile probability (see Sect. 2.2 for further explanation). If there is a weak link between the metric being forecast (for example, regional seasonal rainfall) and the risk being assessed (for example, local low yield), then the forecast will have little impact on the risk assessments. Conversely, if the link is strong, skillful forecasts can significantly reduce the uncertainty in the risk assessments. TAMSAT-ALERT is thus both a method for downscaling and bias-correcting meteorological input into impact models and a method for accounting for mismatch between forecast variables and metrics of risk.
There are several sources of potential predictive power in TAMSAT-ALERT. Firstly, as the season progresses, the amount of observational information included in the forecast increases, and the range of possible outcomes is thus reduced. Secondly, the antecedent state of the land surface (especially root zone soil moisture) has a significant effect on the likelihood of drought and hence low yield (Brown et al., 2017). Thirdly, local information on the climatology determines the likelihood that meteorological conditions will be sufficiently favorable during the remainder of the season to offset less favorable past meteorological and land-surface conditions. Finally, skillful meteorological forecasts provide direct information on the likelihood of adverse weather conditions in the remainder of the season. The relative importance of these sources depends on the metric being predicted, along with the local climate and land-surface conditions. The effect of forecast information depends both on the precision of the forecast and the relevance of the meteorological forecast metric for the metric of hazard assessed by TAMSAT-ALERT.

Figure 1Conceptual overview of the TAMSAT-ALERT system. The blue boxes represent input data sources, the orange boxes represent the processes involved in the system and the green boxes show the outputs from TAMSAT-ALERT system.
2.2 Model implementation
The TAMSAT-ALERT framework is illustrated in Fig. 1. The user provides a time series of driving data, which is long enough to generate a statistically meaningful ensemble and climatology. The driving meteorological data are used in several ways: to generate an ensemble of predictions; to assess the progress of the period of interest so far and to derive initial conditions for the future period (if required for the ensemble predictions); and to generate a climatology against which the forecast ensemble can be compared. Once the climatology and ensemble have been produced, meteorological forecast information is optionally introduced to weight the ensemble members. The system is modular and thus easily adapted for different impact models, metrics of risk and meteorological forecasts.
The steps for deriving probabilistic assessments of the risk of some adverse event on a particular day (the day in question) can be summarized as follows.
-
The user prepares a file containing historical time series of driving data, along with any other parameter files (e.g., agronomic or soil parameters). These should extend at least until the day in question. Note that TAMSAT-ALERT v1.0 only supports daily input. Support for higher- or lower-resolution data will be introduced in future versions of the framework.
-
The user converts the long daily time series of driving data into the appropriate format for their impact model and carries out a historical run in order to derive an annual historical time series of their chosen risk metric. This enables a baseline assessment of climatological risk. The risk metric time series should be presented as an annual time series of the form 〈year〉 〈data〉. Here, we will call this time series file “historical_metric.txt”.
-
For the probabilistic risk assessments, the impact model is driven with an ensemble of meteorological forcing data generated by TAMSAT-ALERT. As described earlier, the period of interest might contain both the past and the future.
- a.
For the past, the meteorological driving data for ensemble member includes identical time series taken from observations.
- b.
For the future, the meteorological driving data for each ensemble member is based on the historical climatology. Specifically, for a given day of year (DoY), the driving data are taken for that DoY for a year in the past. To maintain the daily weather statistics and the consistency between variables, each ensemble member is based on a particular past year. Thus, ensemble member x is based entirely on year y.
To accomplish this, the system converts the daily time series of driving data into multiple files, each containing driving data for one ensemble member. The user is allowed to set the period over which the ensemble system will be run. This is distinct from the period over which the metric is calculated (the metric period). The metric period is the period on which the weighting will be done, and the probabilistic risk is calculated. For example, if one wants to estimate the metrological risk on available soil moisture the ensembles can be run for a much longer period to allow the spin-up of the model to equilibrium values for the initial condition required, but the main interest for the user might be the first 90 days. Hence, the length of the metric period is only the first 90 days and all risk analysis is done on this metric period. The period over which the ensemble will be run should include sufficient time before the metric period to allow for spin-up. The user makes any format changes necessary to convert these TAMSAT-ALERT driving data files into driving data specific to their impact model. The user then carries out the ensemble prediction runs, outputting the time series of driving data through the impact model and outputting the user-defined metric over whatever period is relevant for that metric. Because of the nature of the TAMSAT-ALERT method, each ensemble member is associated with the year for which the possible weather future was derived (see above). The output can thus be presented in a single file with two columns, 〈year〉 〈data〉, for file name ensemble_metric.txt.
- a.
-
The risk assessment is derived by comparing the mean and standard deviation of the climatological baseline distribution (historical_metric.txt derived in point 2) with the mean and standard deviation ensemble distribution (ensemble_metric.txt derived in point 3). Note that an alternative approach employing an empirical cumulative distribution function can be specified by the user. The empirical cumulative distribution function (ECDF) approach is suitable for non-Gaussian variables but can result in noisy predictions if the ensemble is relatively small.
At this point, meteorological forecast data are incorporated (if available).
- a.
An annual historical time series of the metric being forecast (e.g., cumulative June–August rainfall) is provided by the user for file name weighting_metric.txt, which is of the form 〈year〉 〈data〉. The data series should be provided for the years used to generate the weather future aspect of the ensemble (i.e., ensemble_metric.txt as described in 3b). The TAMSAT-ALERT v1.0 release includes a utility function for extracting forecast metrics from the historical driving meteorological data file supplied by the user.
- b.
The annual time series of forecast metric is then ranked. Based on this ranking, each historical year is assigned to a forecast category. In the case of terciles, for example, the bottom third is assigned to tercile 1, the middle third to tercile 2 and the top third to tercile 3.
- c.
As was noted in 3b, each ensemble member is associated with a historical year and ensemble_metric.txt is presented in the form 〈year〉 〈data〉. Each data point in this file can thus be associated with a quantile category using the year assignments described in 4b.
- d.
When calculating the mean and standard deviation, the ensemble is weighted by the user-supplied categorical forecast probabilities, which are assigned to each member during 4c.
- a.
The TAMSAT-ALERT code is written in Python. All code and documentation (including a user manual) for TAMSAT-ALERT have been released on GitHub (https://github.com/tamsat-alert/v1-0, last access: June 2018). However, users need to have their own working installations of their chosen impact model. The TAMSAT-ALERT v1.0 release consists of scripts to
-
convert meteorological time series into driving data for both the ensemble forecasts,
-
calculate quintile predictions for user-defined risk metrics based on the input files historical_metric.txt, ensemble_metric.txt and weighting_metric.txt, and
-
produce a set of plots comparing the ensemble and climatological distribution (see the user guide in the Supplement).
In the GitHub release, in addition to the general TAMSAT-ALERT framework scripts listed above, scripts are provided that set TAMSAT-ALERT up for (i) for the GLAM crop model (the implementation demonstrated in Sect. 3 of this paper) and (ii) for assessments based purely on time means and cumulations of meteorological variables. A test case is provided so that users can be assured that the system is working as expected.
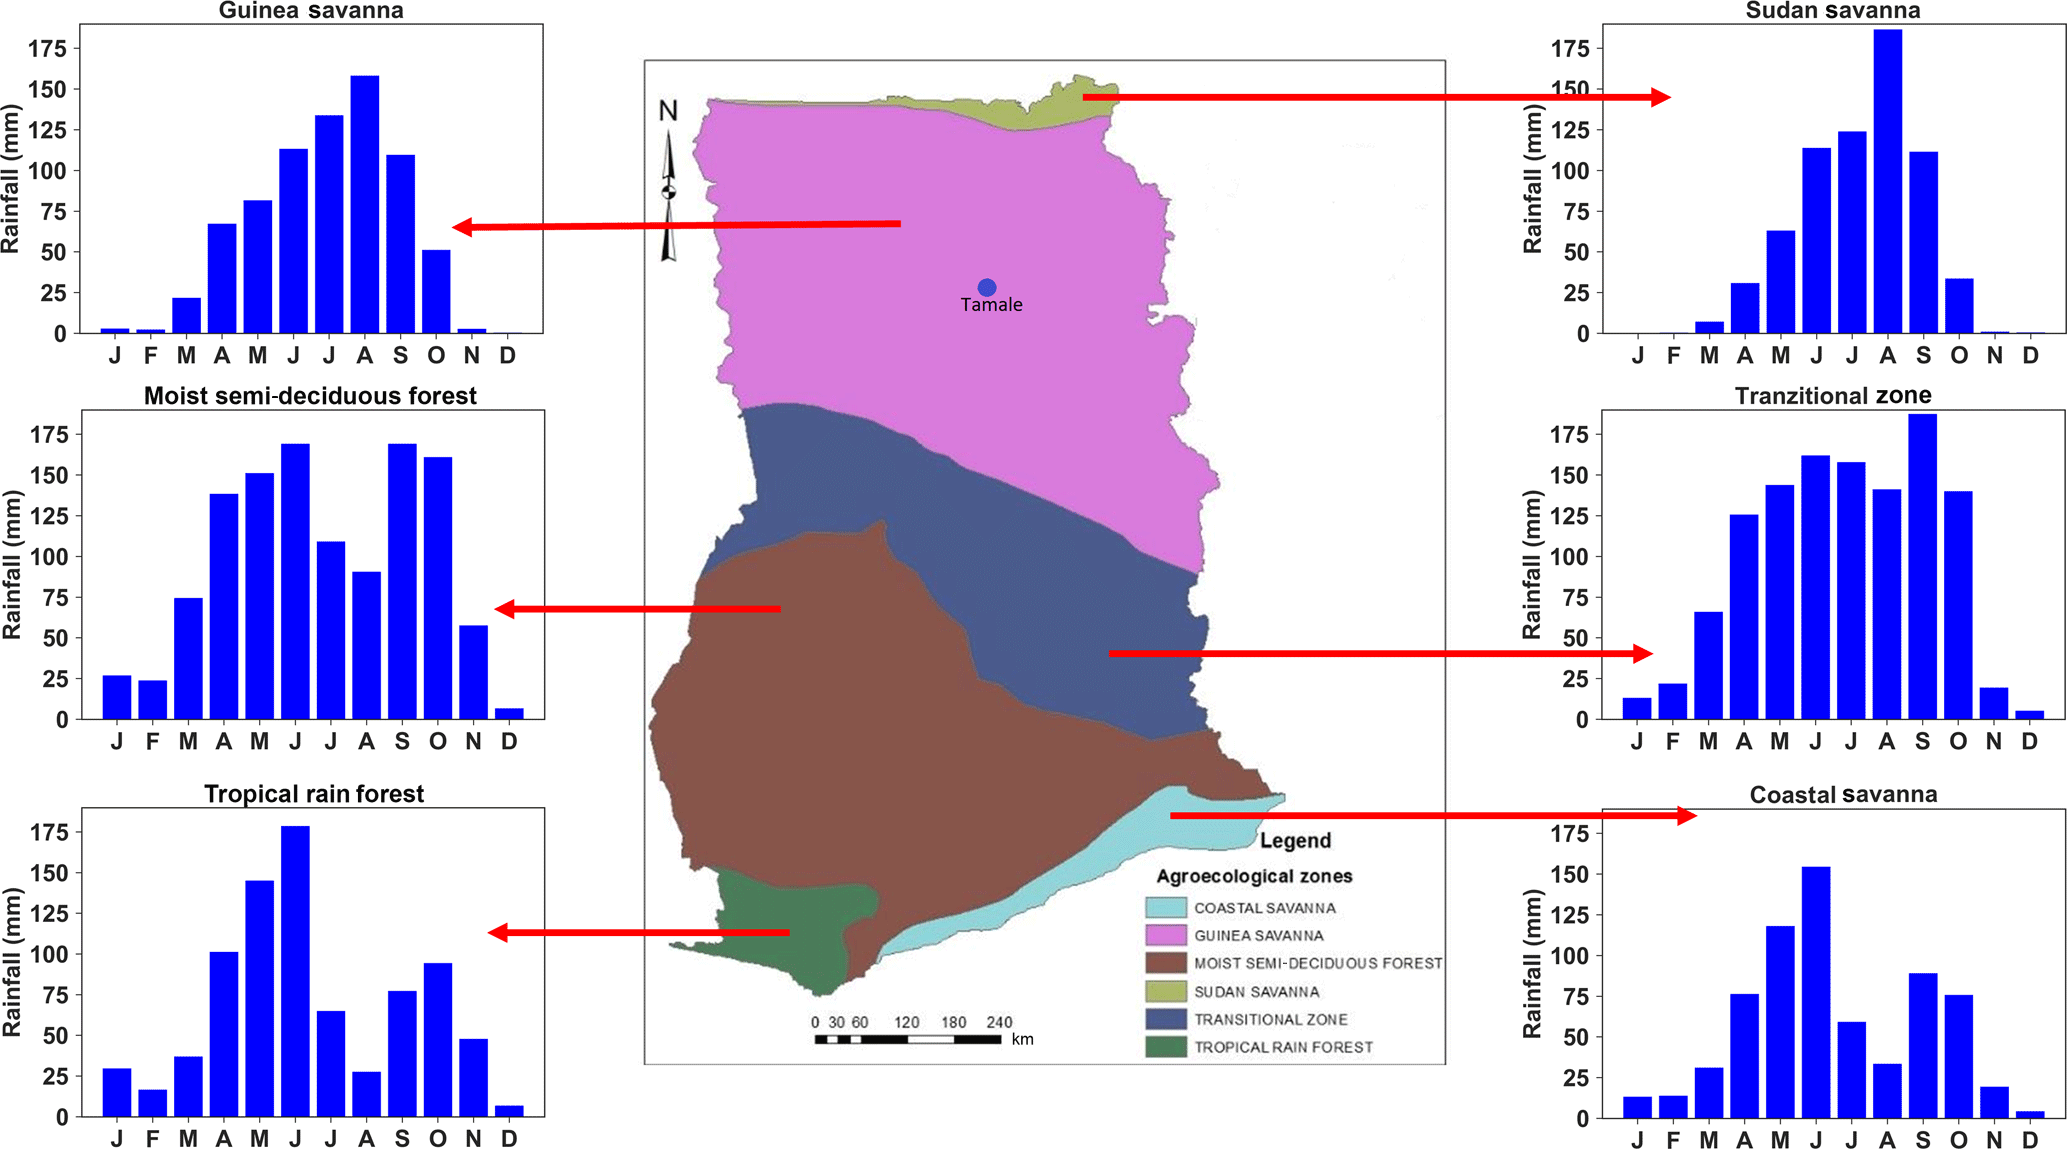
Figure 2Agroecological zones of Ghana (source: Sidibe et al., 2016) and average seasonal rainfall pattern of each agroecological zone based on TAMSAT rainfall estimates.
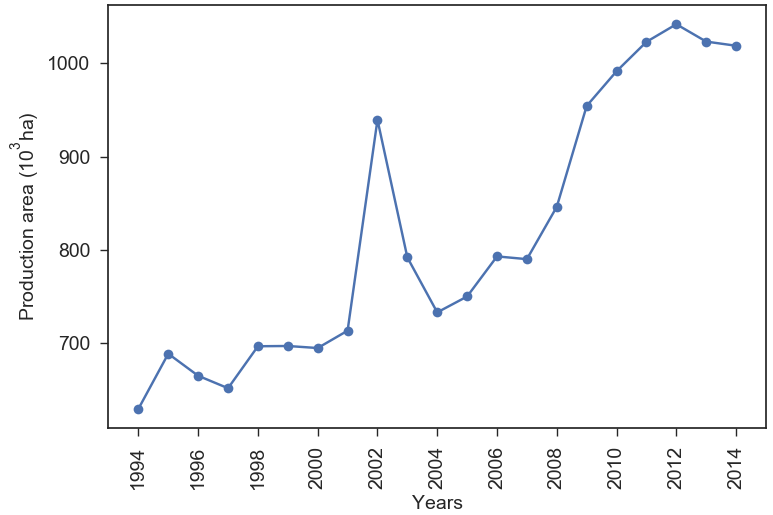
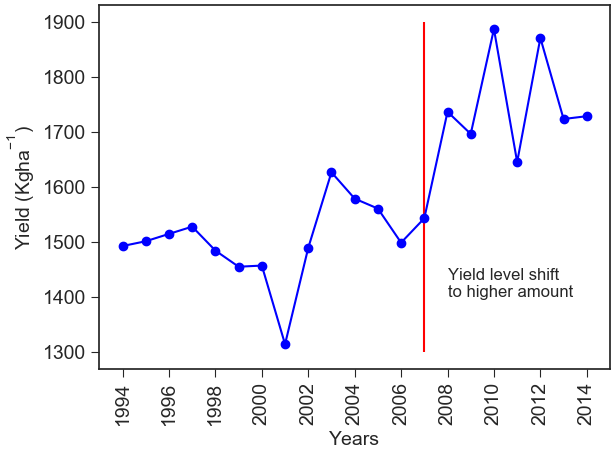
Figure 4Maize yield in Ghana 1994–2014. There are two separate periods marked by the red lines during which we observe changes in yield. For 1994–2006 there is no clear trend in the yield produced and for 2007–2014 there is a shift in the production in which a higher yield is observed.
This case study demonstrates the use of the TAMSAT-ALERT system for forecasting the risk of poor maize harvest in Ghana. The first and second part of the case study describe the study area and the implementation and evaluation of a mechanistic crop model, GLAM. The third part demonstrates the implementation of GLAM as part of the TAMSAT-ALERT system for continually updated risk assessments.
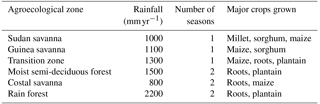
Table 1Characteristics of agroecological zones in Ghana (source: http://www.fao.org/nr/water/aquastat/countries_regions/GHA/, last access: June 2018).
3.1 Study area
Ghana is located on the southern coast of West Africa between latitudes 4∘44′ and 11∘11′ N and longitudes 3∘11′ W and 1∘11′ E. Rain-fed agricultural systems are the major component of the Ghanaian economy, accounting for 30 % of the GDP and employing half of the labor force (PARI, 2015). The country is divided into six agroecological zones, each with a distinct rainfall pattern (Fig. 2). The northern part is dominated by Guinea savanna with average annual rainfall of 1000–1100 mm from one rainy season spanning May to September, while in the southern part, moist semi-deciduous agroecology dominates, with an average annual rainfall of 1500 mm falling within two rainfall seasons (Owusu and Waylen, 2009, 2013). Most of the cereal crops (primarily sorghum, millet and maize) are produced in the northern part of Ghana (Martey et al., 2014). Table 1 shows the six agroecological zones with the average annual rainfall and major crops grown in the agroecological zones.
Maize is one of the major crops produced in Ghana. The production area and the amount of yield has been increasing since 1994 (Fig. 3). Figure 4 shows a time series of maize yield in Ghana (expressed in kg ha−1). From 1994–2006 there is no observed trend, but after 2007 there is a step change in yield coinciding with the introduction of a new variety by the Crop Research Institute (CRI) of the Council for Scientific and Industrial Research (CSIR) of Ghana in 2007 (Ragasa et al., 2013).
3.2 Data and methods
3.2.1 Datasets used
The driving weather datasets for the evaluation of the model were daily time series extracted from the Watch Forcing Data ERA-Interim (WFDEI; Weedon et al., 2014) for shortwave radiation, maximum temperature, minimum temperature and rainfall. For the demonstration of the system at a point, the driving data were based on daily, quality-controlled station data provided by the Ghana Meteorological Agency. The station used is Tamale, which is located in northern Ghana (9.41∘ N, 0.85∘ W; Fig. 2). Precipitation and maximum–minimum temperature were measured directly, and shortwave radiation was derived from sunshine hours. We chose to use Tamale because it is in the northern part of Ghana (Fig. 2) where most of the maize is grown. The station in Tamale also has a long-term record of the driving data for the crop model. It should be noted that TAMSAT-ALERT can in principle be run using any gridded meteorological data, like satellite rainfall estimates (e.g., TAMSAT (https://www.tamsat.org.uk/data/rfe/index.cgi, last access: June 2018), with a resolution of 4 km (Maidment et al., 2017).
Tercile forecast data were downloaded from the publicly available IRI regional forecasts (http://iri.columbia.edu/our-expertise/climate/forecasts/seasonal-climate-forecasts/, last access: June 2018). The IRI forecasts are based on a hybrid dynamical–statistical method developed by the U.S. National Oceanographic and Atmospheric Administration North American Multi-Model Ensemble Project (NOAA-NMME; Kirtman et al., 2014). The seasonal forecasts are issued at the beginning of each month for precipitation and temperature at a global scale with a spatial resolution of 2.5∘ for precipitation and 2∘ for temperature (Barnston and Tippett, 2014). The IRI forecasts were chosen for this analysis because of their wide use by African meteorological services and regional climate outlook forums. In this study the seasonal forecast data were used in the form they are supplied to farmers, i.e., tercile probabilities of 3-month cumulative rainfall and 3-month mean temperature at a regional level.
In addition to meteorological time series, GLAM requires data on soil type and the agronomic properties of maize (Sect. 3.2.2). For this study, the soil texture was set to be sandy loam and the planting date was set to start from the 124th day of the year to the 154th day of the year, which allows for a 30-day planting window. The maize agronomic properties were taken from the published literature and are presented in the Supplement (Table S1).
GLAM was evaluated against national-level maize yield data released by the FAOSTAT (http://www.fao.org/faostat/, last access: June 2018; see Fig. 4). Although the FAO issues guidance on the compilation of these datasets, in practice there is little quality control and the data should be treated with caution.
3.2.2 The GLAM crop model
As described in Sect. 2.1, the TAMSAT-ALERT system can be used to assess any metric of risk that can be output by a model driven with meteorological data. In this study, the General Large Area Model (GLAM) for annual crops is used to simulate maize yield and subsequently to monitor the probabilistic risk of poor harvest as the growing season progresses.
GLAM is a process-based crop simulation model, which incorporates sufficient processes to capture the impact of climate variability on crop yield (Challinor et al., 2004; Ramirez-Villegas et al., 2015b). GLAM uses a limited number of driving datasets and an intermediate complexity of crop development process representation. Nevertheless, previous studies have demonstrated that GLAM has skill in capturing the impact of weather on crops (Challinor et al., 2005, 2006). Such information enables users to translate time series of weather into a time series of yield estimates (Challinor and Wheeler, 2008). GLAM has also been used to model weather and climate change impact on crop yield and adaptation strategies (Parkes et al., 2015; Ramirez-Villegas et al., 2015a; Ramirez-Villegas and Challinor, 2016).
GLAM requires daily values of precipitation, shortwave radiation, maximum temperature and minimum temperature as driving weather data with additional inputs of soil properties and planting window (Watson and Challinor, 2013). GLAM accumulates the aboveground biomass, which is a product of daily transpiration and a predetermined transpiration efficiency value, within the growing season to determine total biomass production, which is converted into yield using a harvest index (Osborne et al., 2007). The planting date is either prescribed by the user or determined using GLAM's intelligent planting date system (the approach taken in this study). It is important to note that GLAM does not account, in a process-based fashion, for non-meteorological influences on crop growth, such as pests, diseases and fertilizer use. Rather, these factors are encapsulated in the yield gap parameter (YGP), which is determined by calibrating the model yield with observed yield (Challinor et al., 2004). The YGP is assigned a value between 0 and 1, where 1 represents the potential yield given the weather conditions, soil texture and crop development parameters (Challinor et al., 2005).
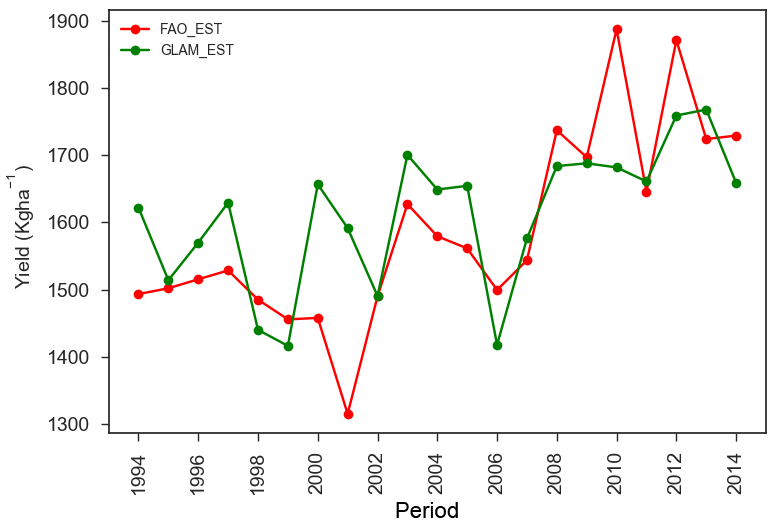
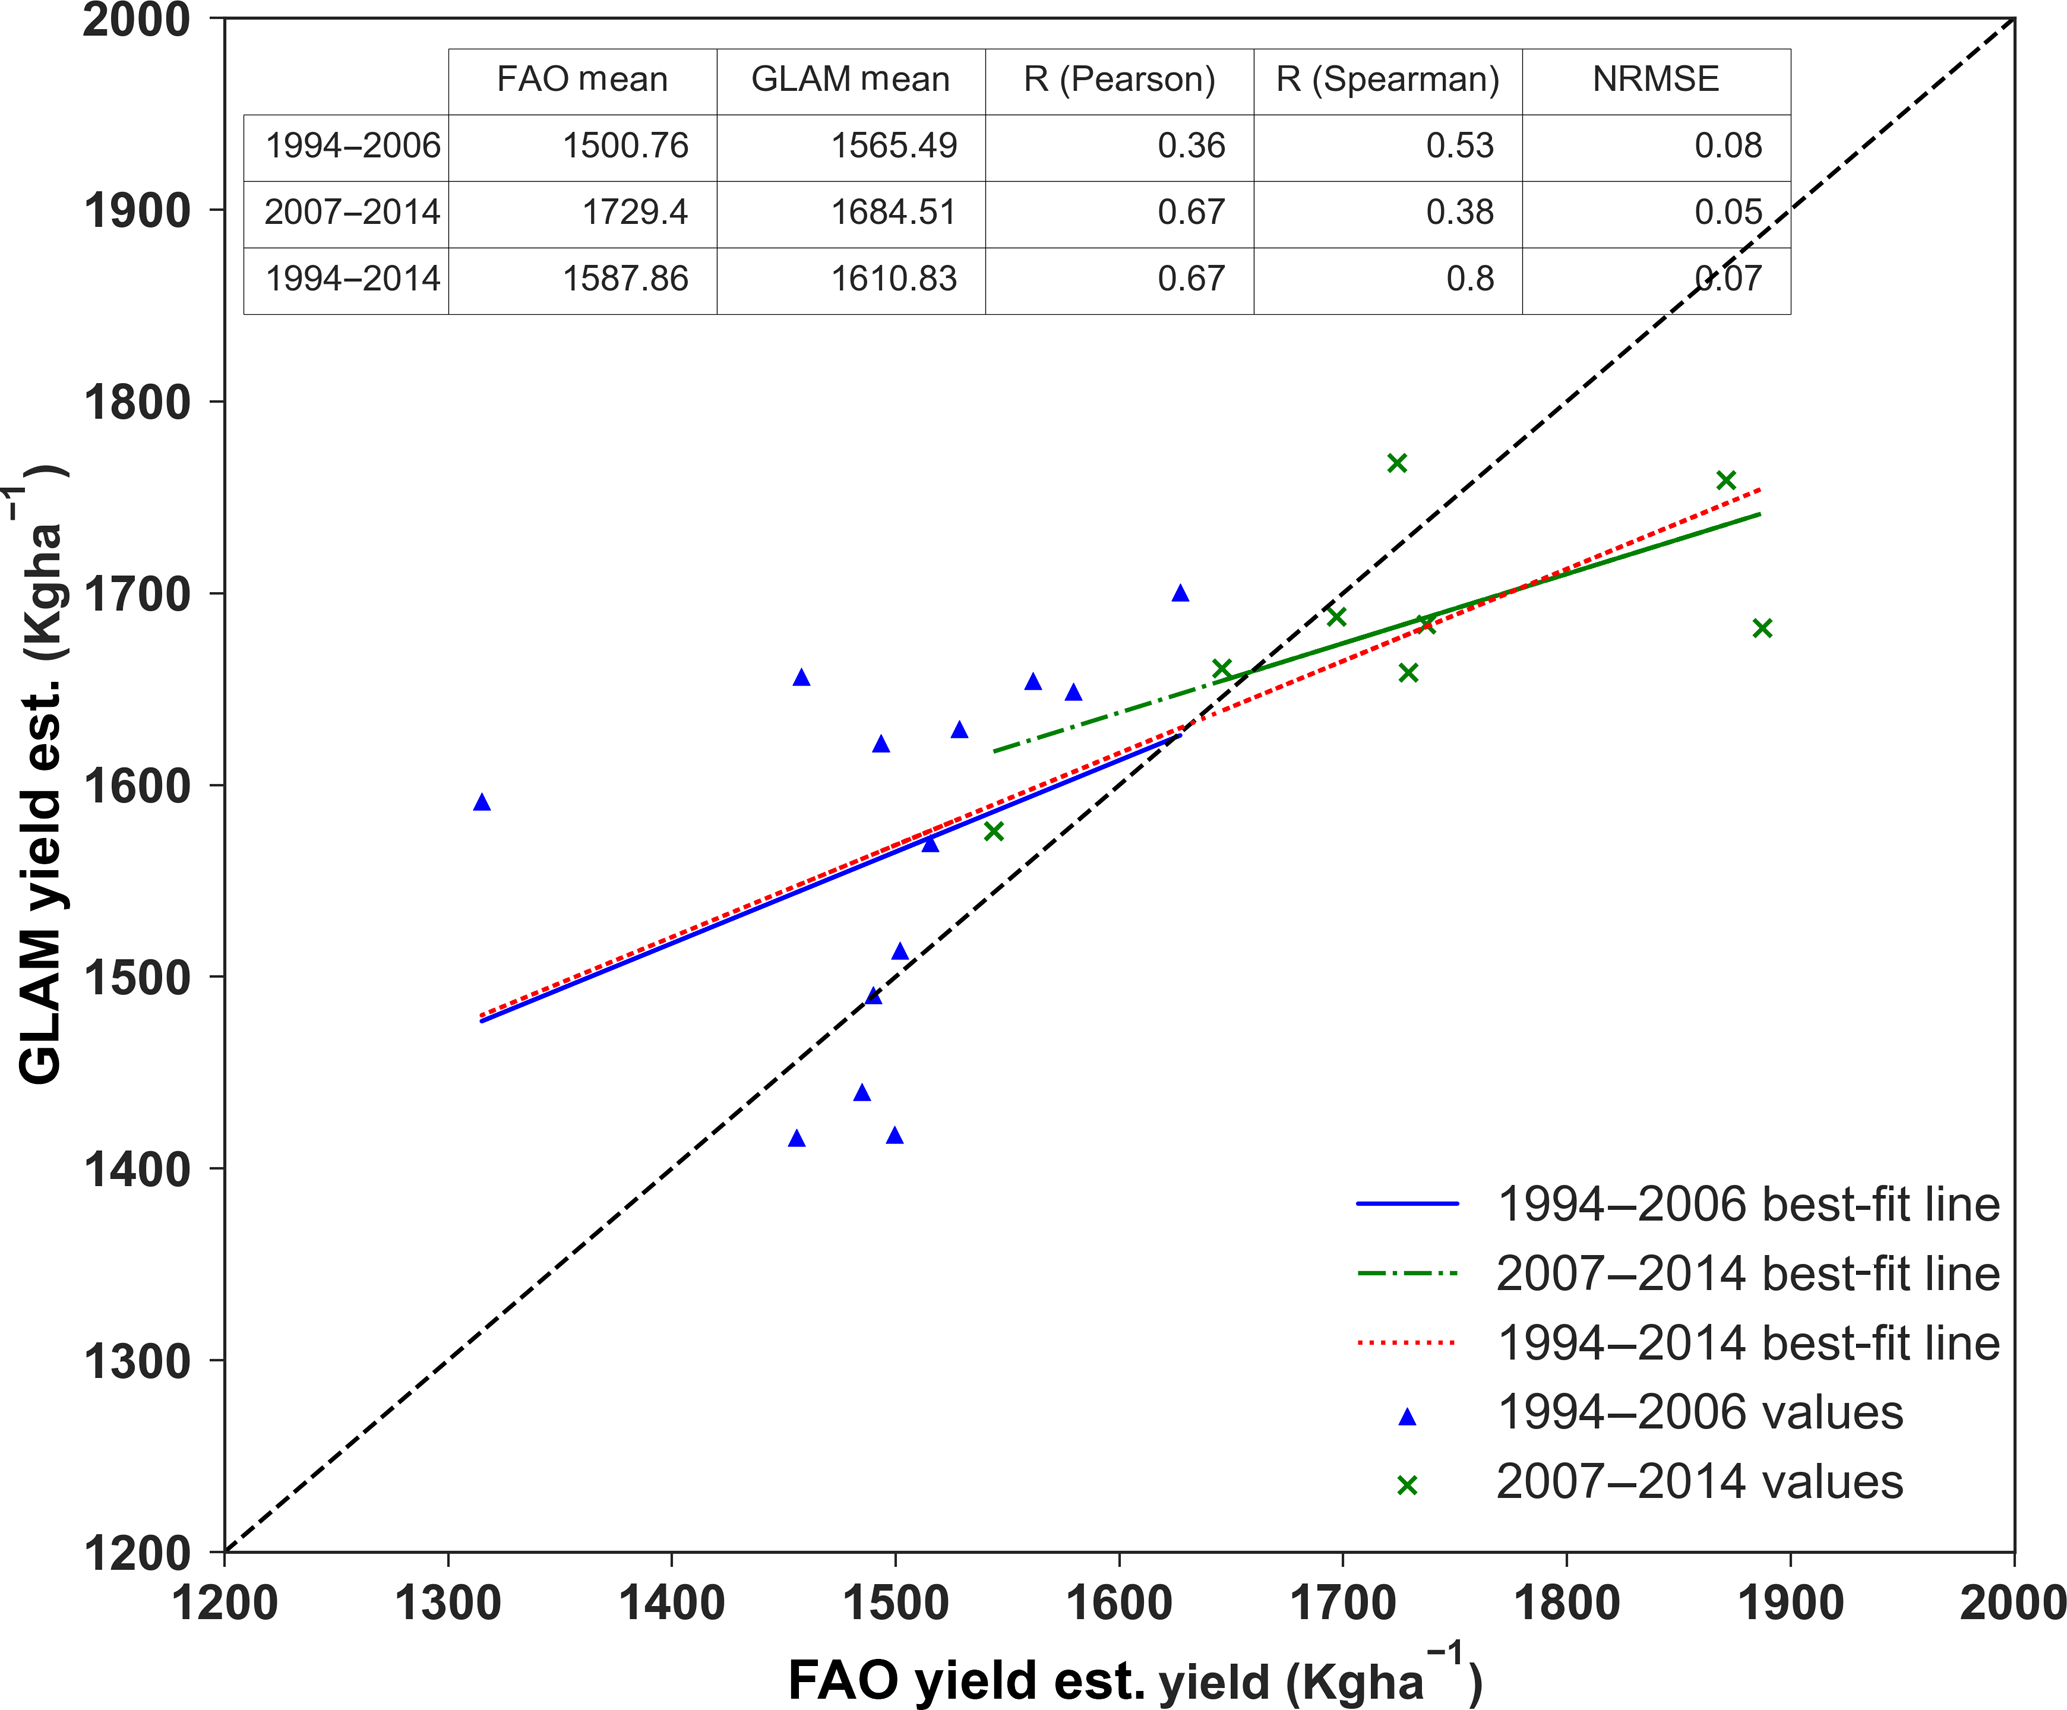
Figure 6Scatter plot between FAO yield and GLAM-simulated yield. The red dotted line is the best-fit line for the whole period considered (1994–2014). The blue solid line shows the best-fit line for the period 1994–2006. The green line shows the best-fit line for the period 2007–2014.
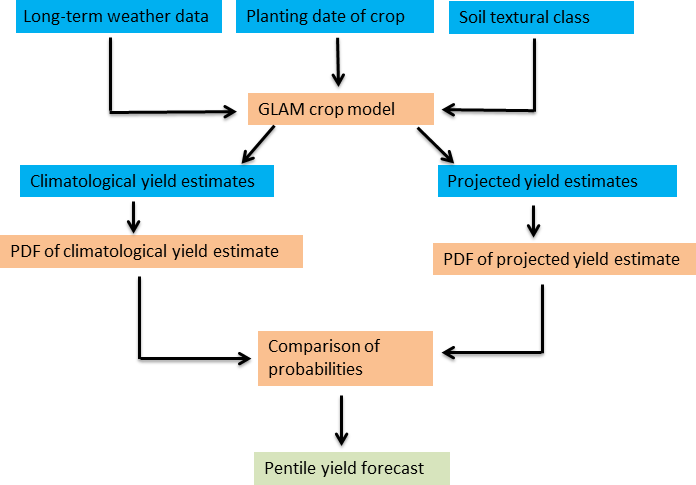
Figure 7Process flowchart for crop yield forecasting within the TAMSAT-ALERT system. The blue boxes represent input data sources, the orange represents the processes involved in the system and the green box shows the final probabilistic forecast for the crop yield.
3.2.3 GLAM evaluation
GLAM was used to simulate the yield from 1994 to 2014 using the WFDEI as a driving dataset. The WFDEI has a 0.5∘ by 0.5∘ resolution and so GLAM was output at this resolution. The simulated yield at each grid point was then weighted by the year 2000 season fraction of production area over each grid point to make a country average yield (Weedon et al., 2014; Monfreda et al., 2008). This country average yield was then compared with the FAO maize yield dataset for the same period. It is shown in Fig. 4 that maize production can be split into two distinct periods: 1994–2006 and 2007–2014. Because of the reported changes in agronomic practice and drought-tolerant maize variety introduction through the drought-tolerant maize for Africa (DTMA) project (Obeng-Antwi et al., 2013; Ragasa et al., 2013) the transpiration efficiency (TE) value was increased from 7.0 for the period 1997–2006 to 8.0 for the period 2007–2014. The YGP was maintained at 0.4 for the whole simulation period.
The results of the simulated crop yield are presented in Fig. 5 and the statistical values of the comparison are presented with the scatter plot in Fig. 6. GLAM was able to maintain the overall mean yield and, and as a result the normalized root mean square error (NRMSE) is very low (0.07). The overall correlation value is found to be 0.67 (Pearson) and the Spearman correlation, which is less affected by outliers, is 0.8. The difference in the Spearman and Pearson correlation coefficients is mainly due to the severe overestimation of 2001 season yield, probably resulting from a long dry spell, the impact of which on farming practices was not fully accounted for by GLAM (FAO/WFP-Global Information and Early Warning System on food and agriculture, 2002). Some of the correlation strength is due to capturing the change in mean yield from the 1994–2006 to 2007–2014 period, and this is done by changing the transpiration efficiency (TE) value for the two periods. The strength of the correlation of yield suggests that the link between Ghana-wide weather and yield is moderate – an important consideration for policy makers when they make use of information from TAMSAT-ALERT. This is primarily due to the myriad of factors that can affect yield, including agronomic practice, pests and disease, and socioeconomic problems. Nevertheless, in vulnerable regions, the meteorological risk to yield is, in itself, an important consideration for agricultural agencies because action can be taken to mitigate the hazard. This might include subsidizing drought-resistant varieties or encouraging early planting and replanting.

Figure 8An example hindcast of maize yield using GLAM implemented into the TAMSAT-ALERT system. Black dots represent individual ensemble members and red lines are the climatology.
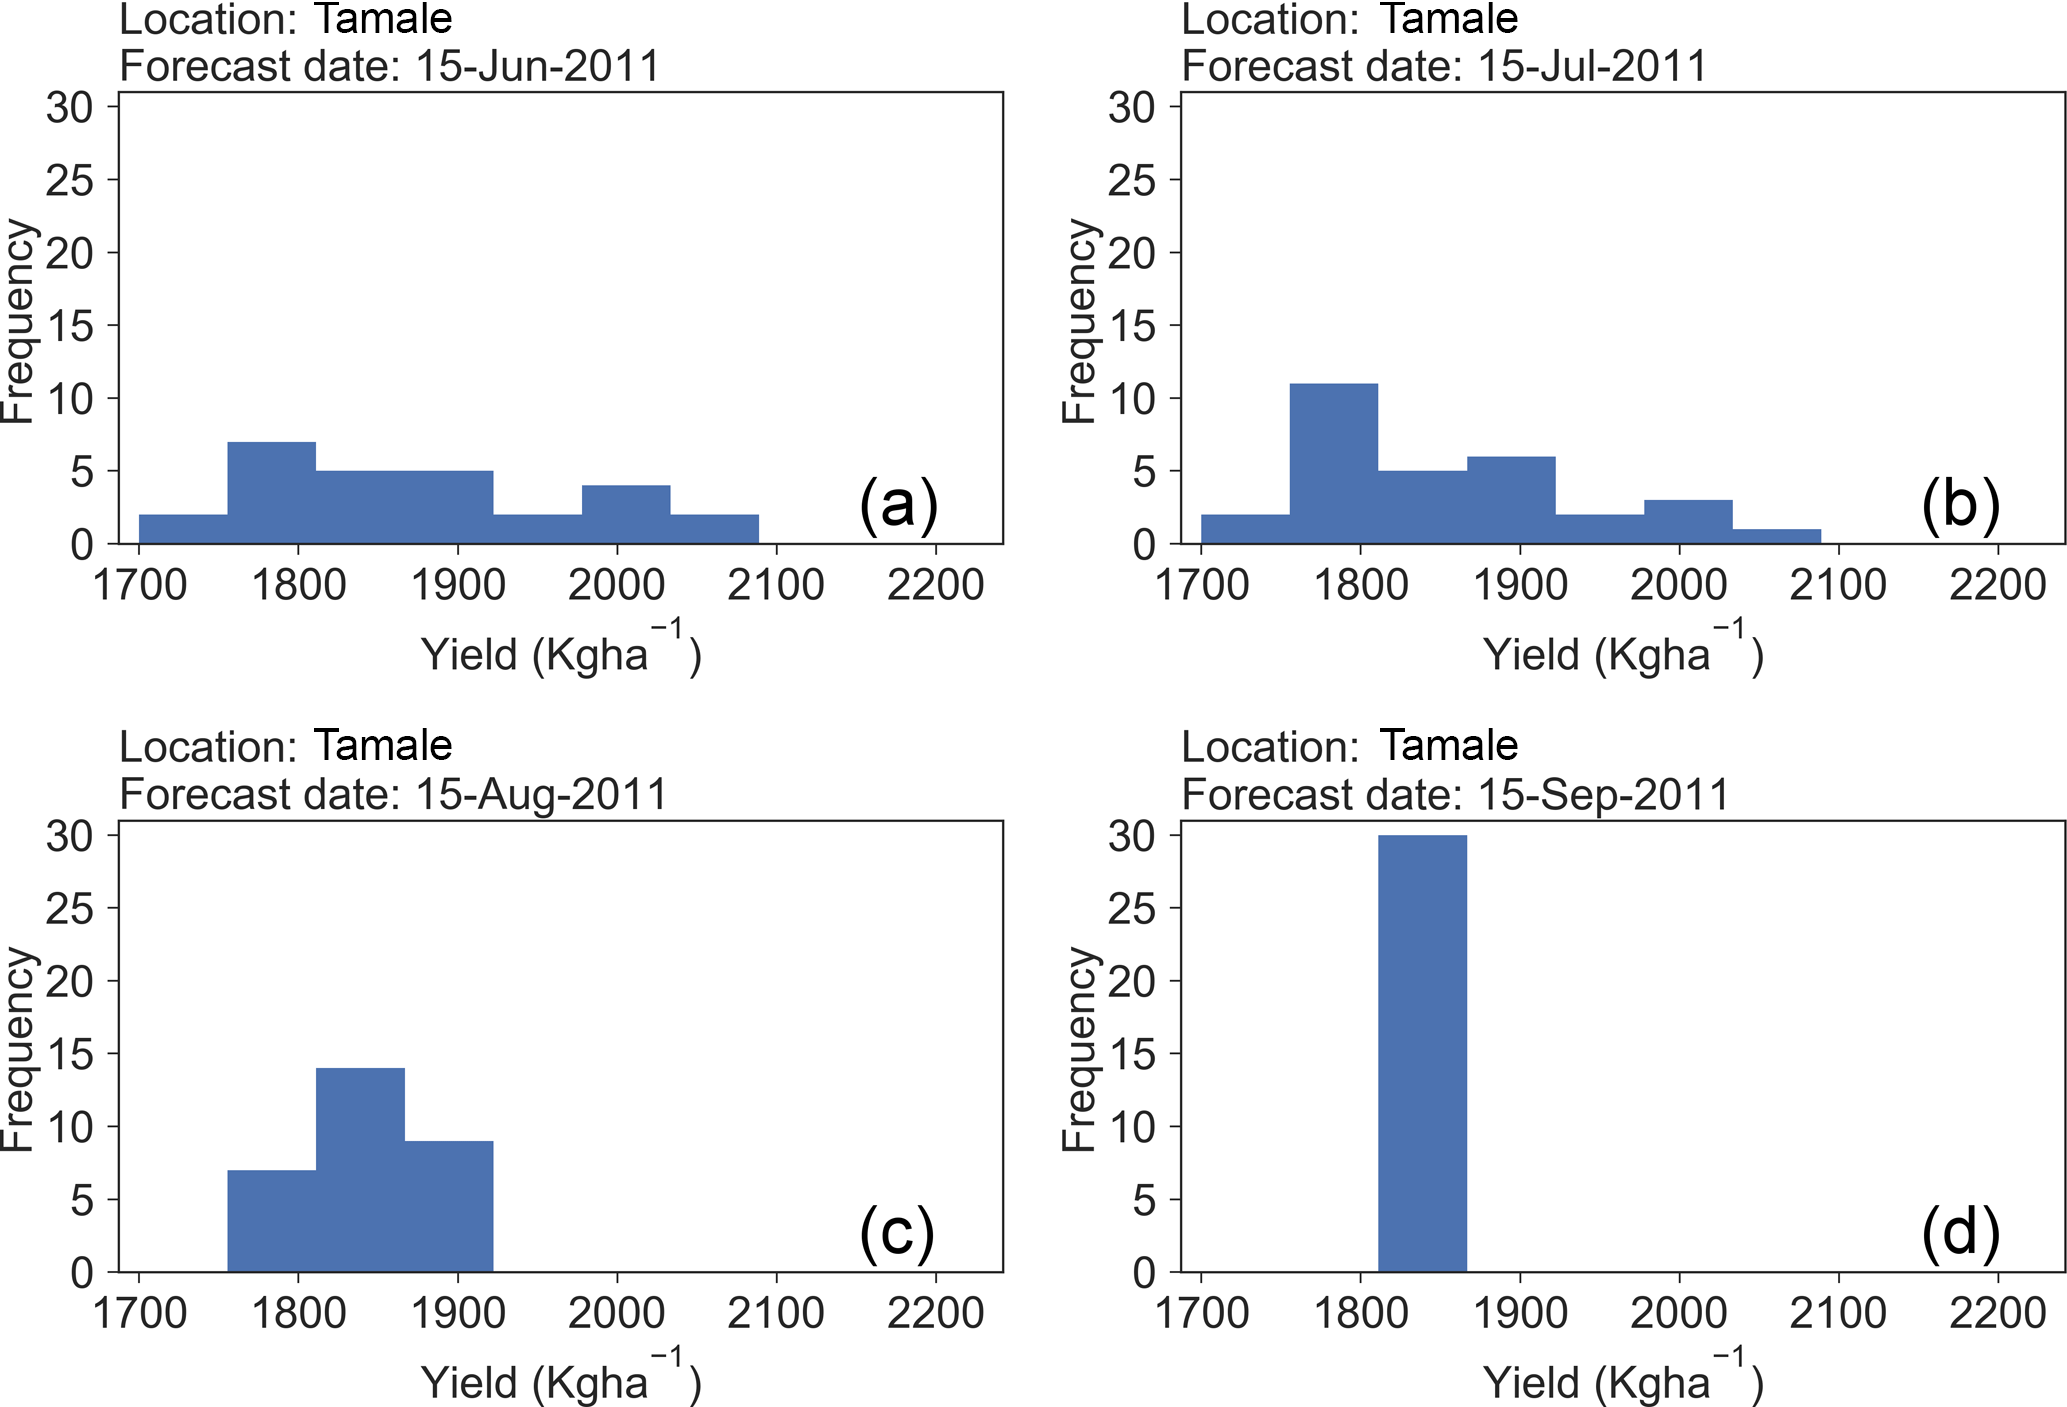
Figure 9Histograms of yield forecast for (a) 15 June 2011, (b) 15 July 2011, (c) 15 August 2011 and (d) 15 September 2011.
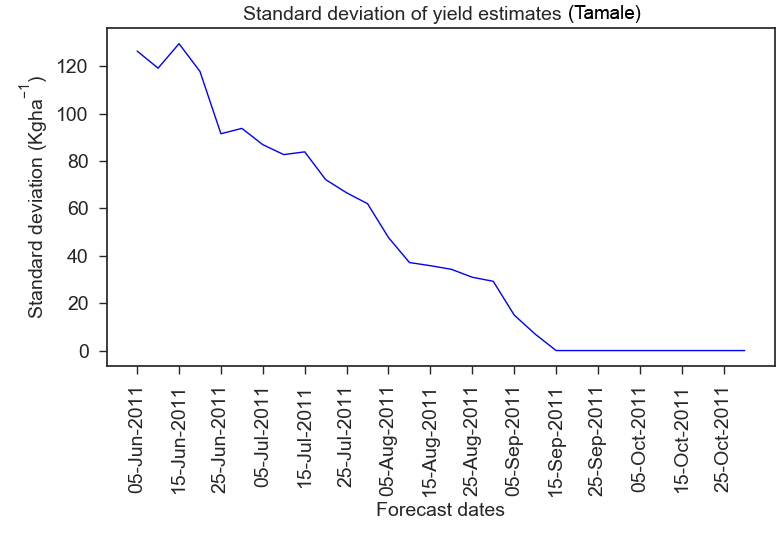
Figure 10Standard deviation of the yield estimate initiated on the dates displayed on the x axis.
3.2.4 Incorporation of GLAM into TAMSAT-ALERT
Figure 7 shows how GLAM has been incorporated into the TAMSAT-ALERT system. As described in Sect. 2, time series of driving data based on historical observations are used both to derive climatological yield and to generate an ensemble of predicted yield. Individual planting dates are determined for each ensemble member using GLAM's intelligent planting date system, and the crop is harvested when the growing degree-day requirement is fulfilled (Challinor et al., 2004; Challinor and Wheeler, 2008). Because of the way TAMSAT-ALERT is set up to incorporate observational data continually as the season progresses, once the optimum planting time has passed for the year being hindcast, the planting date for each ensemble member converges. Analogously, once the harvest date for the hindcast year has passed in the observations, the harvest date, and indeed the predicted yield, for each ensemble member is identical. In this implementation of GLAM, a climatological period of 30 years (1980–2009) was used for the yield forecast.
3.3 Case study results
3.3.1 Yield forecasting using GLAM: 2011 season example
Figures 8, 9 and 10 illustrate the implementation of TAMSAT-ALERT for the 2011 growing season, which nationally was a low yield year compared to other post-2007 years (noting that we do not have yield data for Tamale). The hindcasts were initiated every 5 days. GLAM infers that planting occurred on 4 June and harvesting on 15 September to 20 September. Figure 8 depicts all ensemble members in the context of the climatological spread in yield. Figure 9 shows histograms of ensemble members at monthly intervals, starting 10 days after planting. Figure 10 shows a time series of ensemble spread (standard deviation of ensemble yield predictions).

Figure 11Probabilistic forecasts for maize yield in northern Ghana (Tamale) for five dates: (a) 4 June 2011, (b) 4 July 2011, (c) 4 August 2011, (d) 4 September 2011 and (e) 4 October 2011. The planting date was 4 June 2011. In the first day of planting the impact of the weather is not well indicated that the yield probabilities are spread more or less equally in all categories, but after 1 month on 4 July 2011 it is indicated that 62 % of the ensembles fall in the average and low categories. After 2 months on 4 August 2011, 76 % of the ensembles indicate an average and low yield estimate compare to the climatological yield. A few days before harvest on 5 September 2011, 100 % of the yield is estimated to be in the average and low quintile category.
At the outset of the season, the yield estimates are derived only from the meteorological climatology; no in-season observational data are incorporated. The spread is thus large (equivalent to the climatology). During the season, as in-season data are incorporated by TAMSAT-ALERT, the meteorological time series driving GLAM become progressively more similar. As a result, the ensemble rapidly converges. In this example, for instance, 2 months after planting, the ensemble standard deviation is 34 % of the climatology.
The yield forecasts can be communicated with end users in a probabilistic form, with the ensemble expressed as quintiles representing the following categories: above the 80th, 60th–80th, 40th–60th, 20th–40th and below 20th percentile. These categories can be equated to very high, high, average, low and very low yield, respectively. An example of such quintile forecasts at monthly intervals during the 2011 growing season is shown in Fig. 11. Consistent with Figs. 8 and 9, at the outset of the season, the categories are equally likely except the extreme categories, the difference in probability coming from the change in planting date for some years in the climatological period considered (1980–2009). As the season progresses, the average and low categories become more likely and the extreme categories (very high and very low) less likely.
It is evident from Fig. 11 that the ensemble mean tends towards average or low values, even 2 months ahead of the harvest date during 2011, suggesting a degree of precision, even towards the beginning of the growing season. Section 3.3.3 presents a formal evaluation of skill for the 2002–2011 period.
3.3.2 Incorporation of meteorological forecasts
As described in Sect. 2.1, the TAMSAT-ALERT framework can use probabilistic information from meteorological forecasts to weight the yield forecast ensemble, providing a means of incorporating forecast information into the decision support system. In this study, we consider tercile forecasts of cumulative 90-day rainfall and mean 90-day temperature to reflect the information currently available to the Ghana Meteorological Agency. The forecasts are commonly issued at the start of every month. Hence, we have applied the forecasts only to the meteorological season being forecasted with the remaining season not included in the weighting estimation. For example, for running TAMSAT-ALERT on 4 June, the seasonal forecast of June–July–August is applied. To illustrate the process of including forecasts, we continue with the 2011 case study. We have used idealized tercile seasonal forecasts for total June–July–August (JJA) precipitation to weight the forecast on 4 June 2011, July–August–September (JAS) precipitation to weight the forecast on 4 July 2011, August–September–October (ASO) precipitation to weight the forecast on 4 August 2011 and September–October–November (SON) precipitation to weight the forecast on 4 September 2011.
To assess the potential value of tercile rainfall and temperature seasonal forecast information, we have weighted the ensemble as if the next 90 days of temperature and cumulative rain are known (i.e., perfect forecast experiment). So, we consider three probabilistic forecasts: tercile weightings of [0,0,1] for the lower, middle and upper tercile, respectively (perfect wet forecast), [0,1,0] for the lower, middle and upper tercile, respectively (perfect normal forecast), and [1,0,0] for the lower, middle and upper tercile, respectively (perfect dry forecast). The ensemble was weighted by these perfect tercile forecasts according to the actual total rainfall (perfect rainfall forecast) or the actual mean temperature (perfect temperature forecast) that ensued in the next 90 days following each TAMSAT-ALERT hindcast.
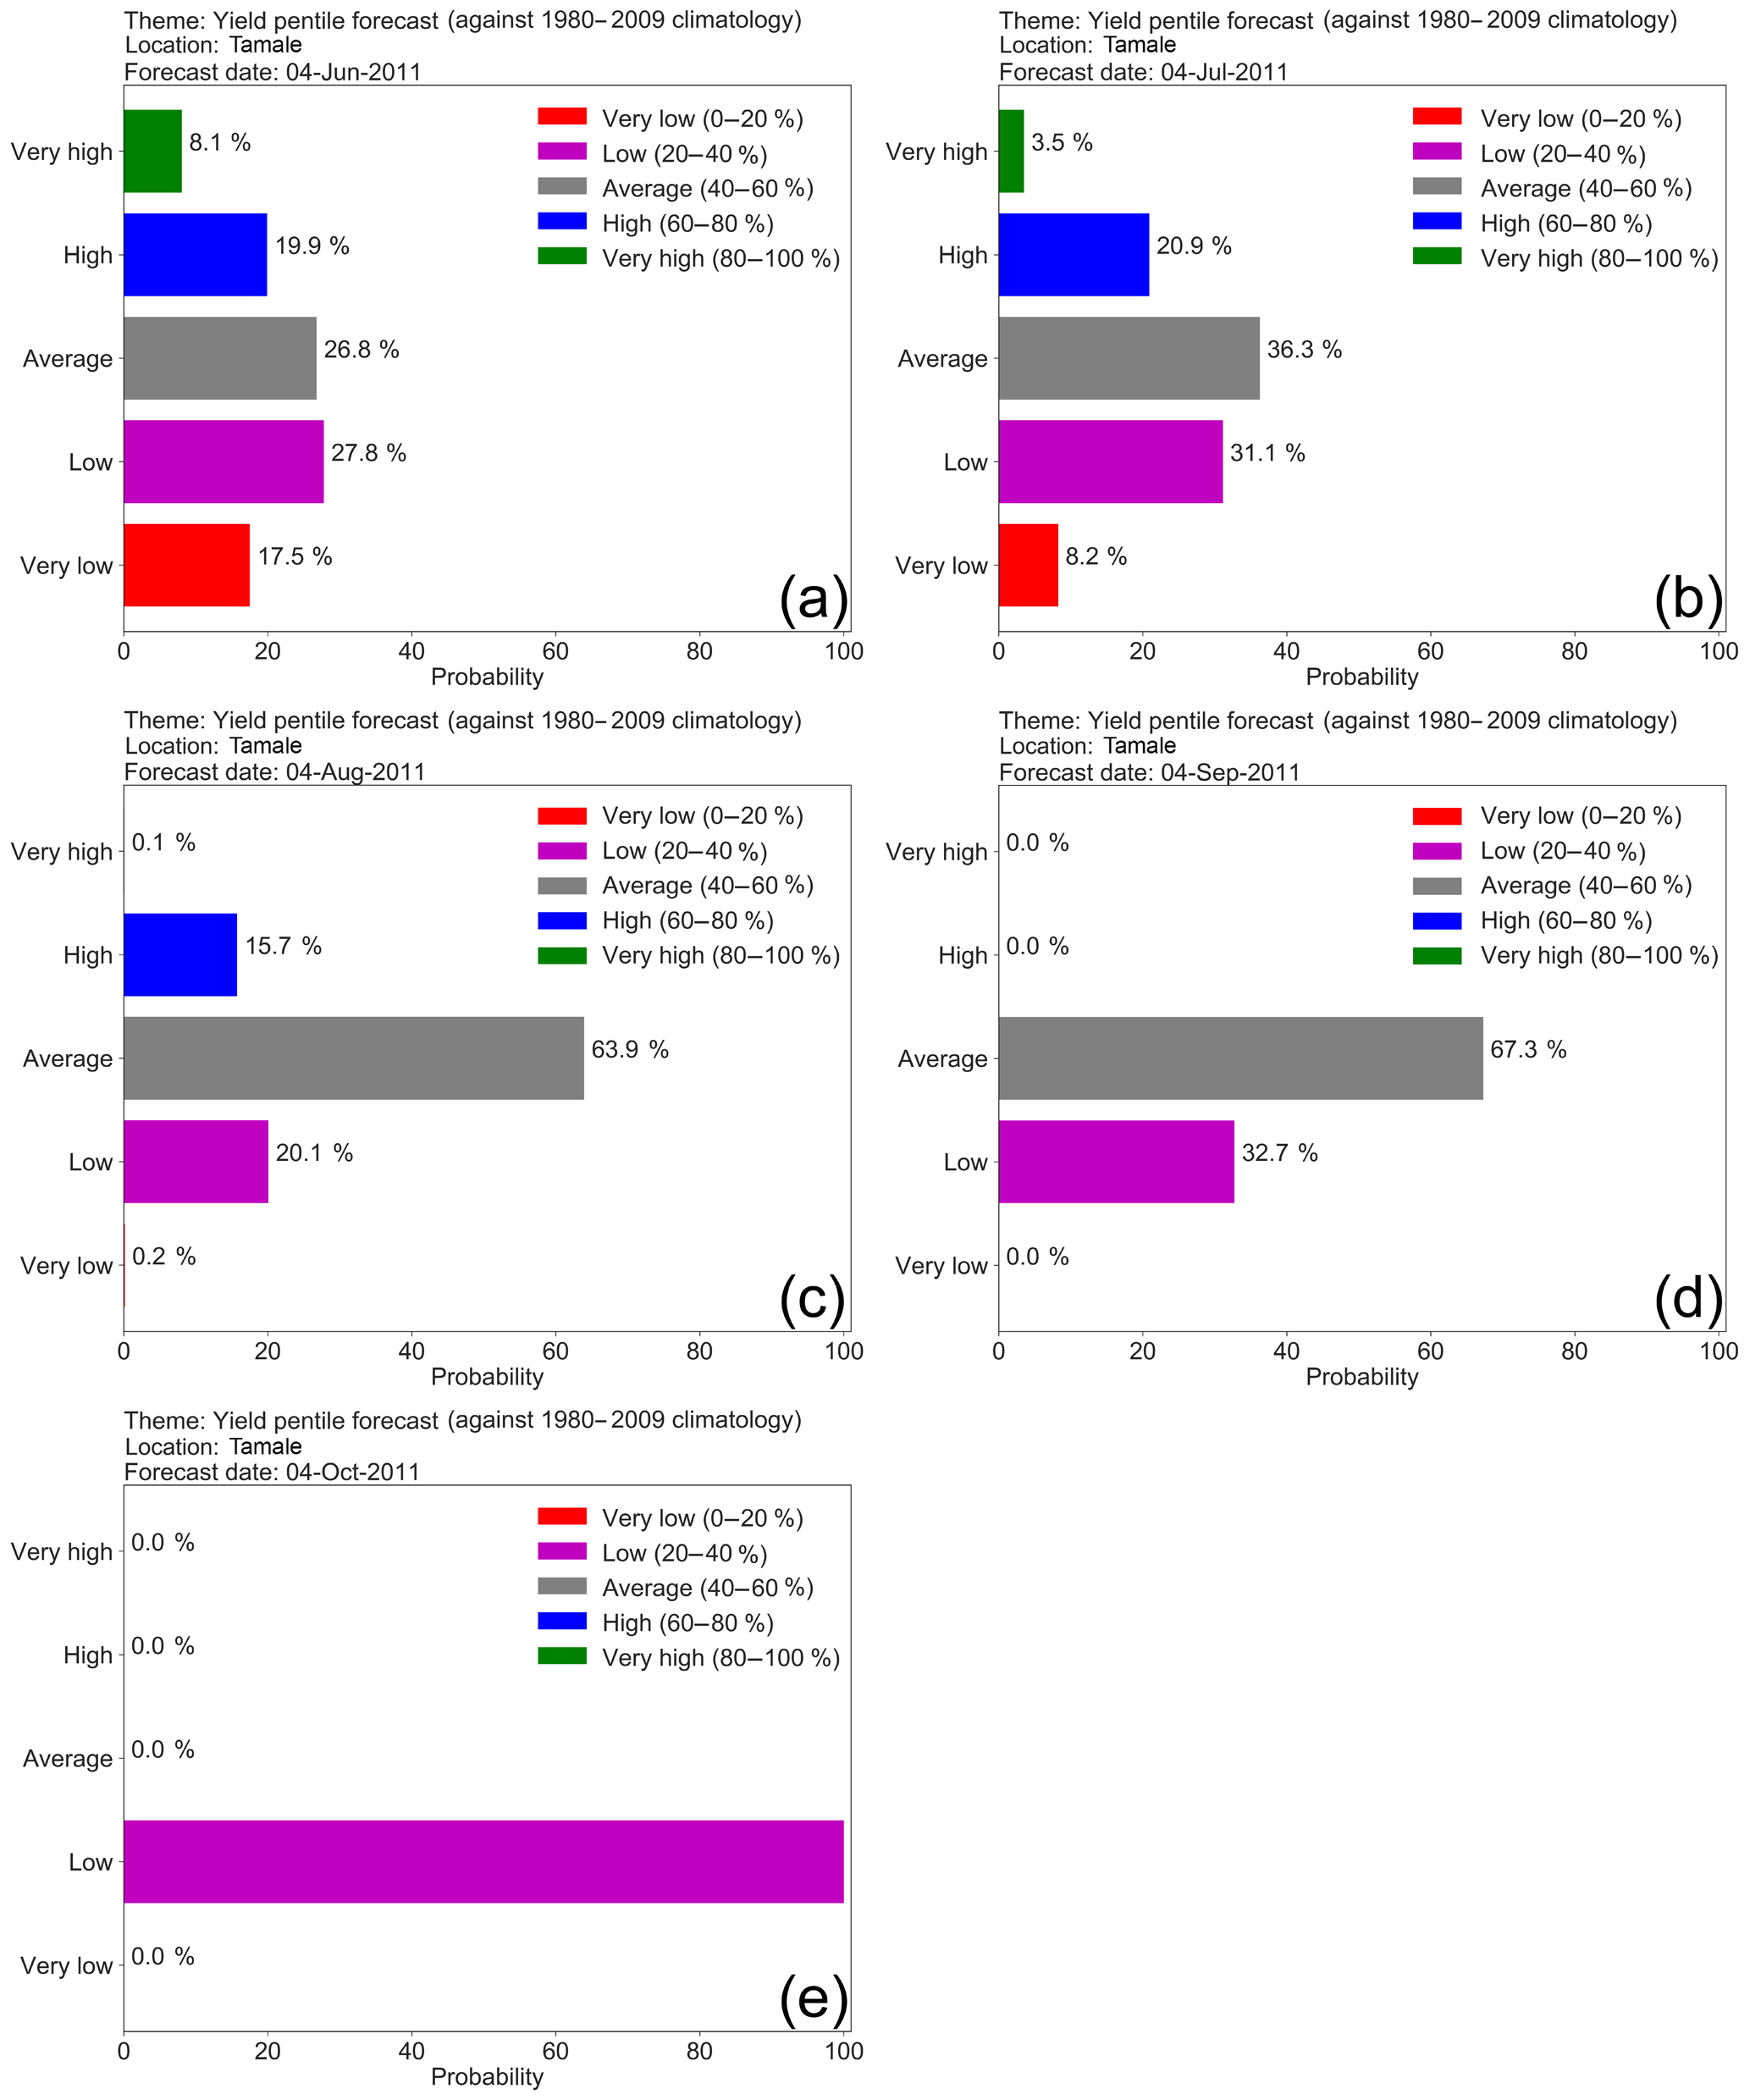
Figure 12Yield probability forecast for the year 2011 for five forecast dates, (a) 4 June, (b) 4 July, (c) 4 August, (d) 4 September and (e) 4 October, when ensembles are weighted by a perfect tercile seasonal rainfall forecast.
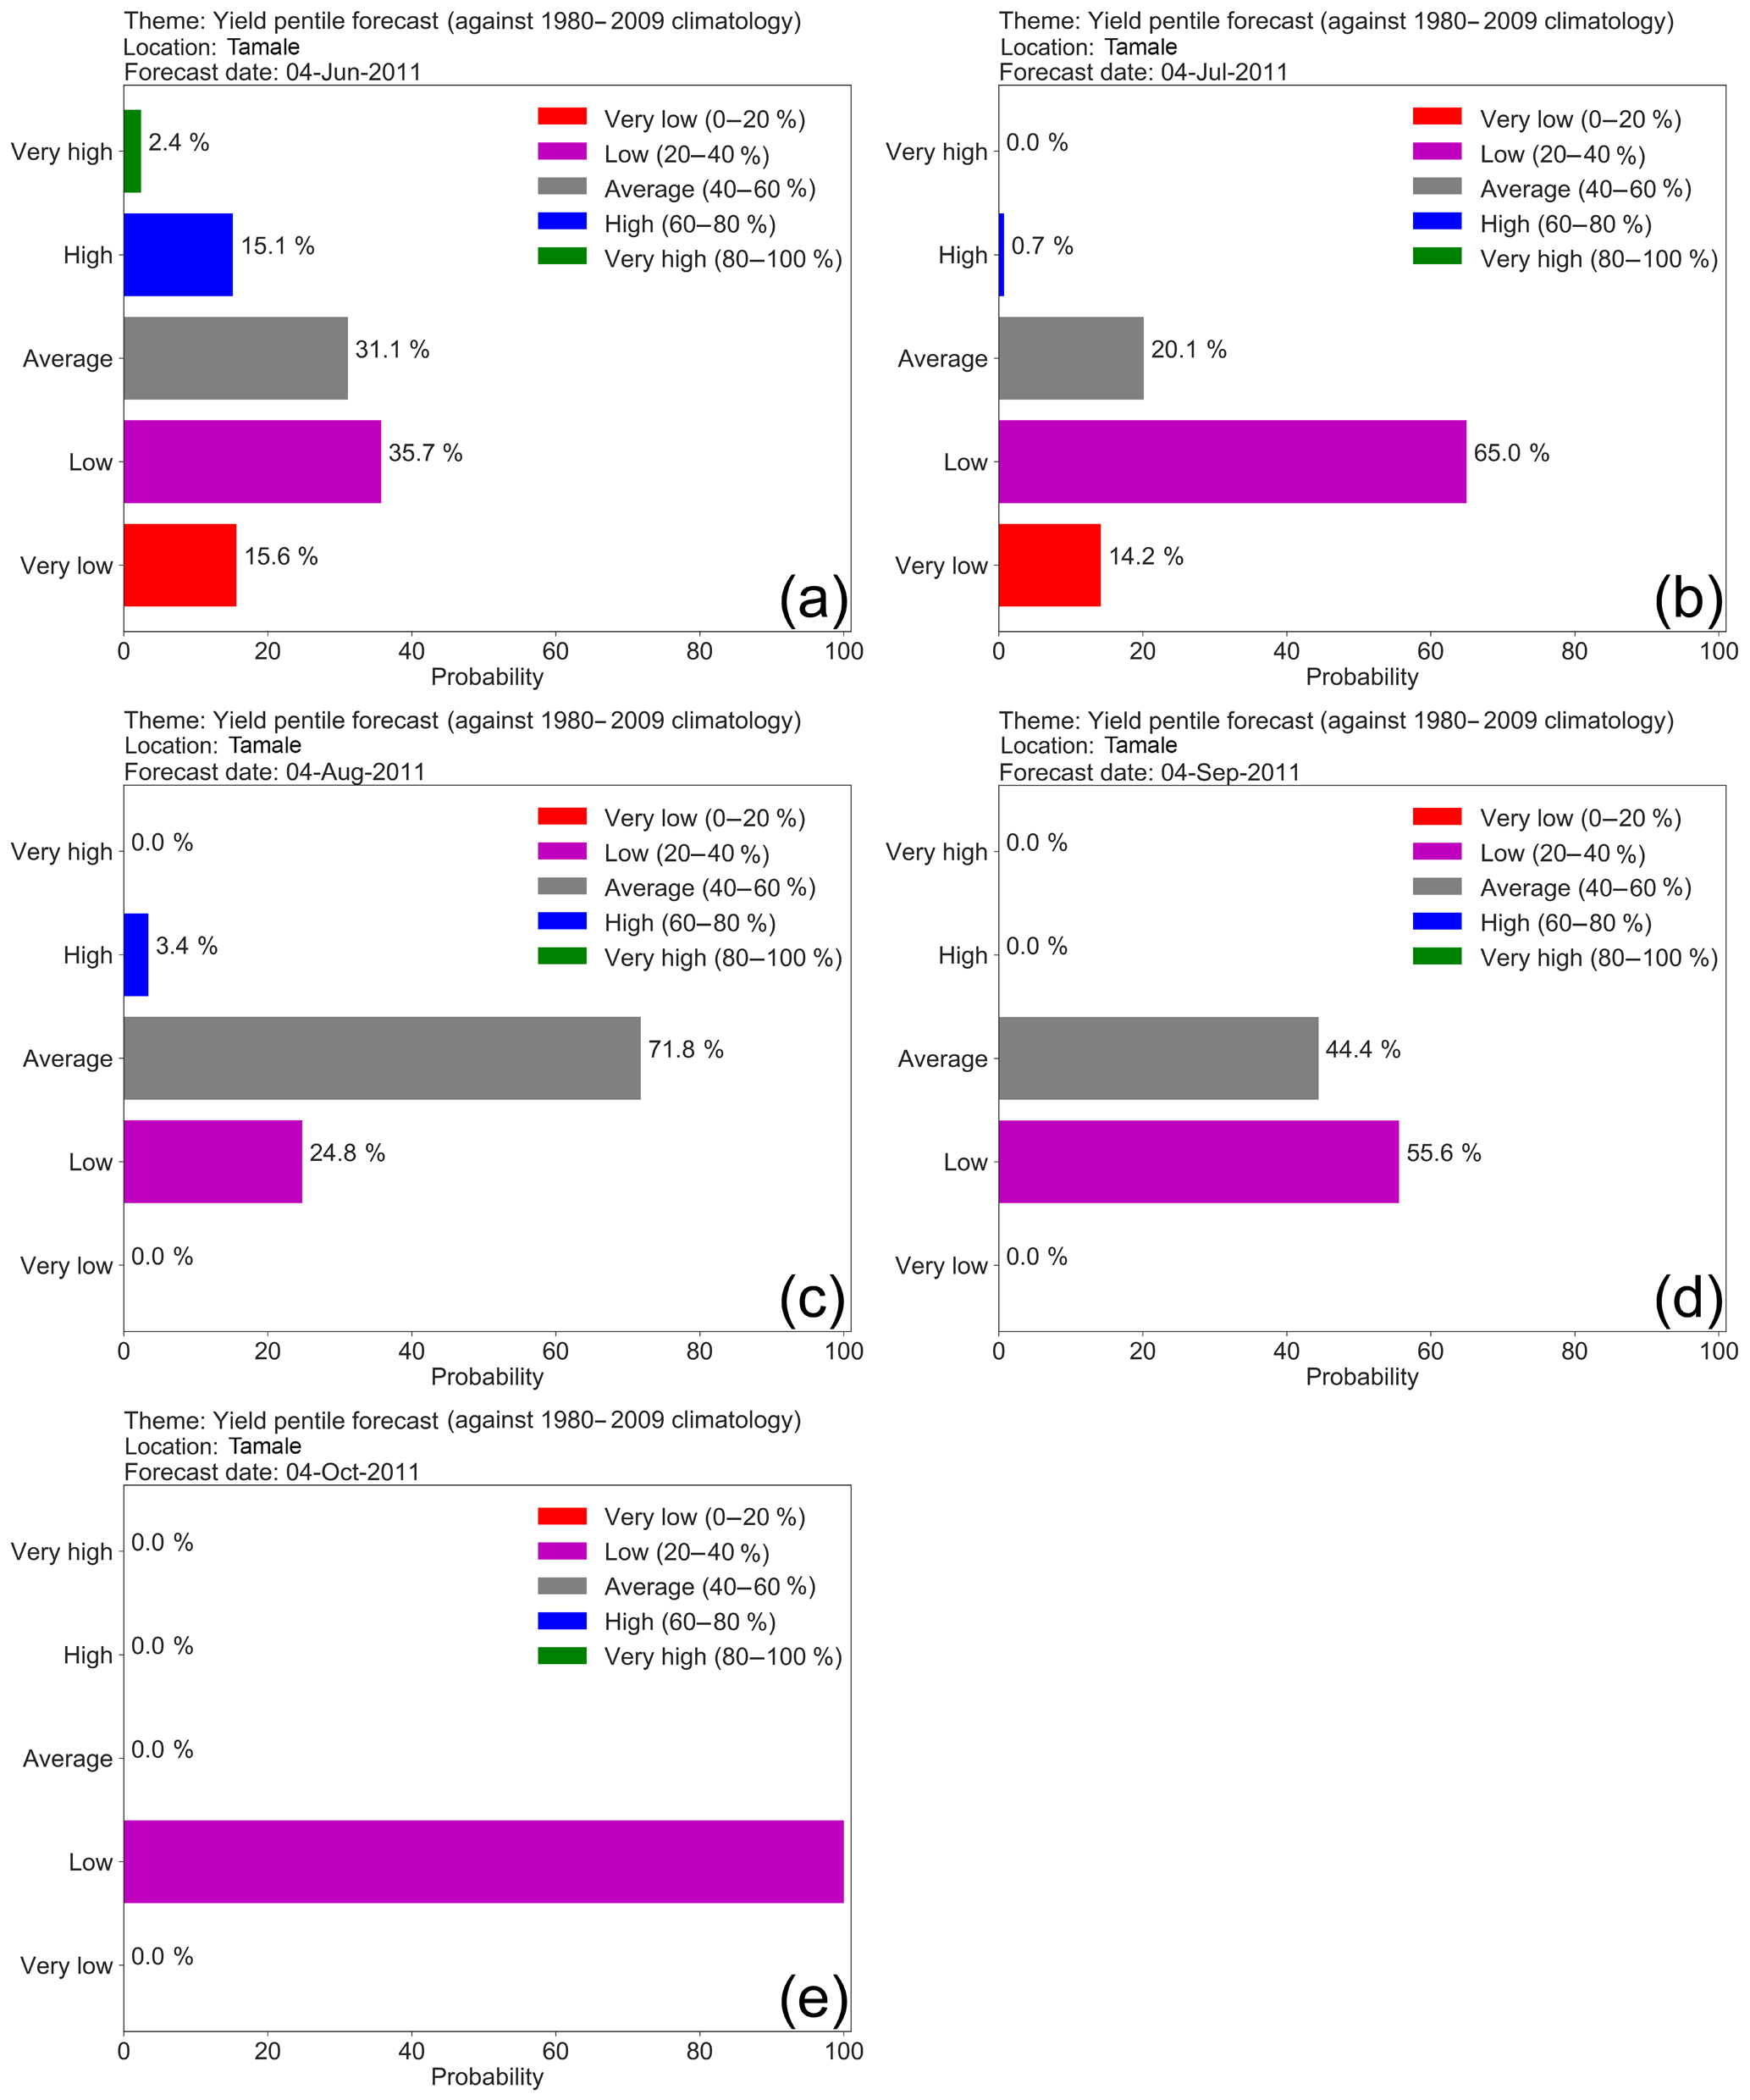
Figure 13Yield probability forecast for the year 2011 for five forecast dates, (a) 4 June, (b) 4 July, (c) 4 August, (d) 4 September and (e) 4 October, when ensembles are weighted by a perfect average temperature of seasonal forecast.
Figure 12 shows the yield forecast probabilities when the perfect rainfall forecast is used. When a perfect rainfall forecast is used to weight the ensemble, the probabilities of the quintile forecast show more rapid convergence, especially 2 months into the season. The improvement is less noticeable in June and July, perhaps reflecting the fact that, at least in the GLAM crop model, cumulative rainfall in this part of the season is comparatively less strongly correlated with yield.
An alternative approach is to use temperature forecasts to weight the ensemble. To investigate the effect of temperature forecasts, the ensemble was weighted using idealized June–July–August (JJA) tercile temperature forecasts to weight the forecast on 4 June 2011, July–August–September (JAS) tercile temperature forecasts to weight the forecast on 4 July 2011, August–September–October (ASO) tercile temperature forecasts to weight the forecast on 4 August 2011 and September–October–November (SON) tercile temperature forecasts to weight the forecast on 4 September 2011. As with rainfall, the upper, middle and lower terciles are weighted [1,0,0] for a “perfect cold forecast”, [0,1,0] for a “perfect normal forecast” and [0,0,1] for a “perfect warm forecast”. Figure 13 shows the forecast for the 2011 cropping season with a perfect average temperature forecast. Due to a negative correlation of the average temperature with maize yield, a warmer temperature forecast is associated with predictions of lower yield. Comparison between Figs. 12 and 13 suggests that temperature forecasts have a greater effect on the risk assessments than rainfall forecasts.
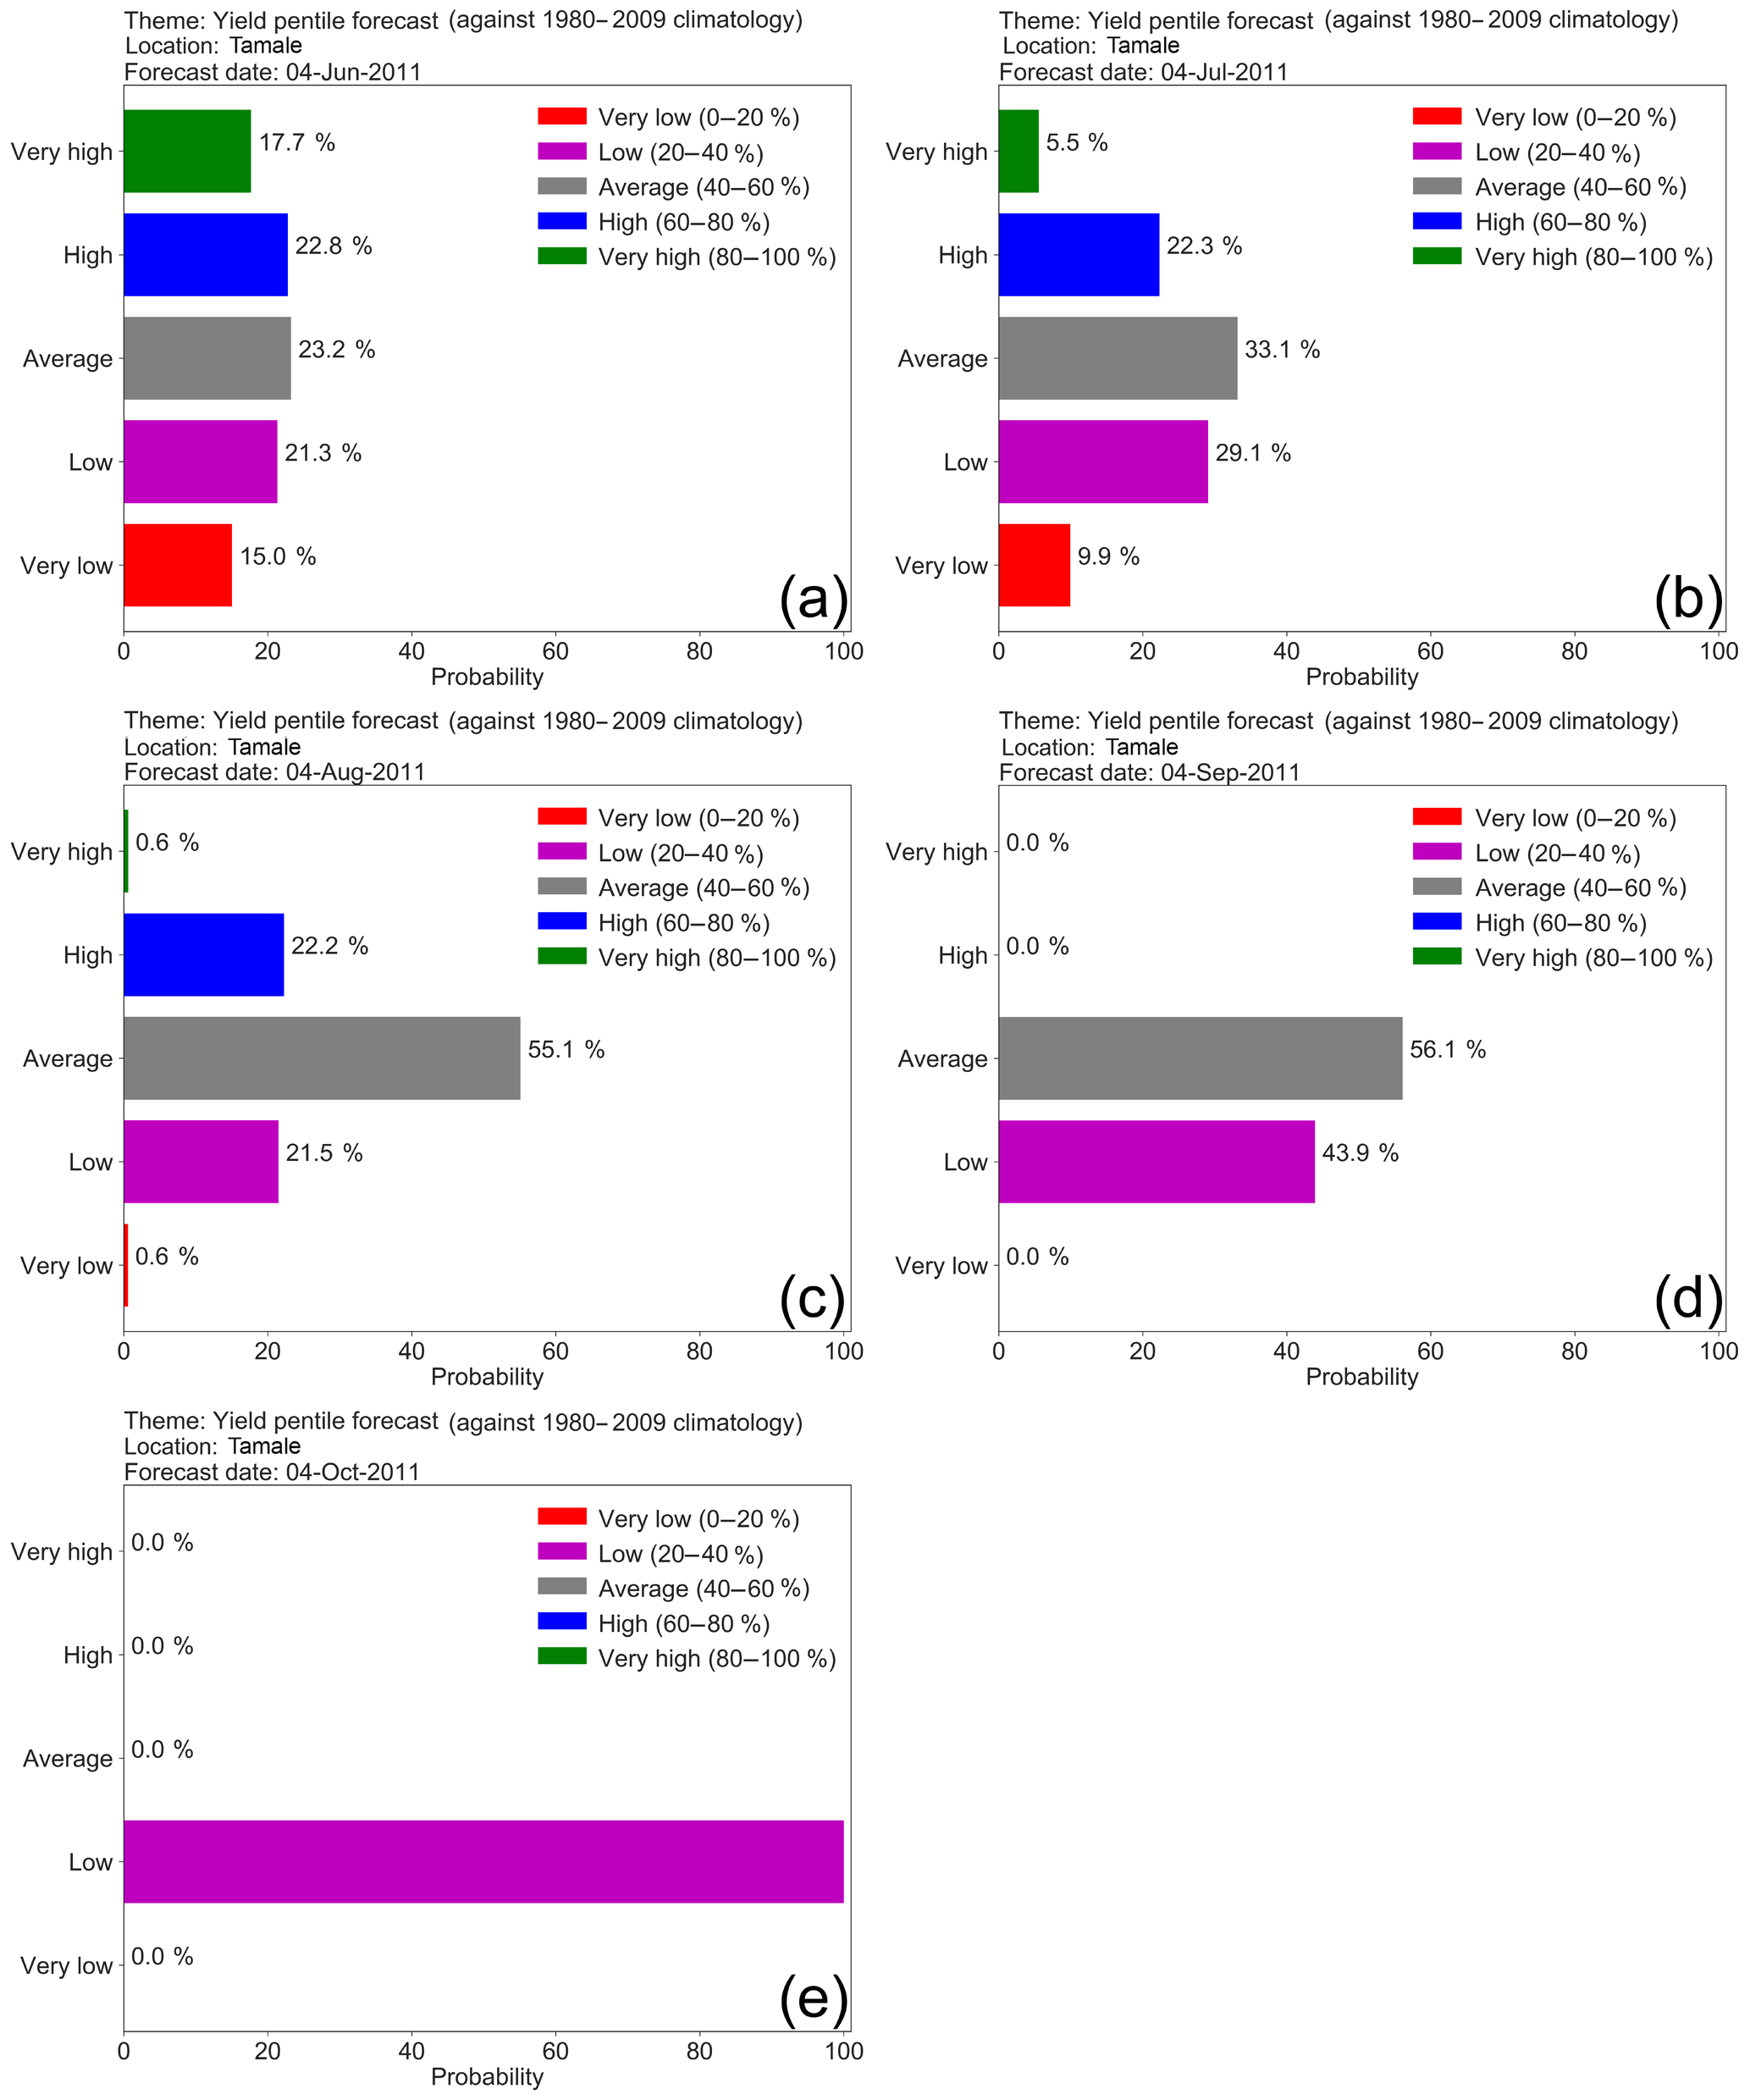
Figure 14Yield probability forecast for the year 2011 for five forecast dates, (a) 4 June, (b) 4 July, (c) 4 August, (d) 4 September and (e) 4 October, when ensembles are weighted by IRI seasonal rainfall forecast.

Figure 15Yield probability forecast for the year 2011 for five forecast dates, (a) 4 June, (b) 4 July, (c) 4 August, (d) 4 September and (e) 4 October, when ensembles are weighted by IRI seasonal forecast average temperature.
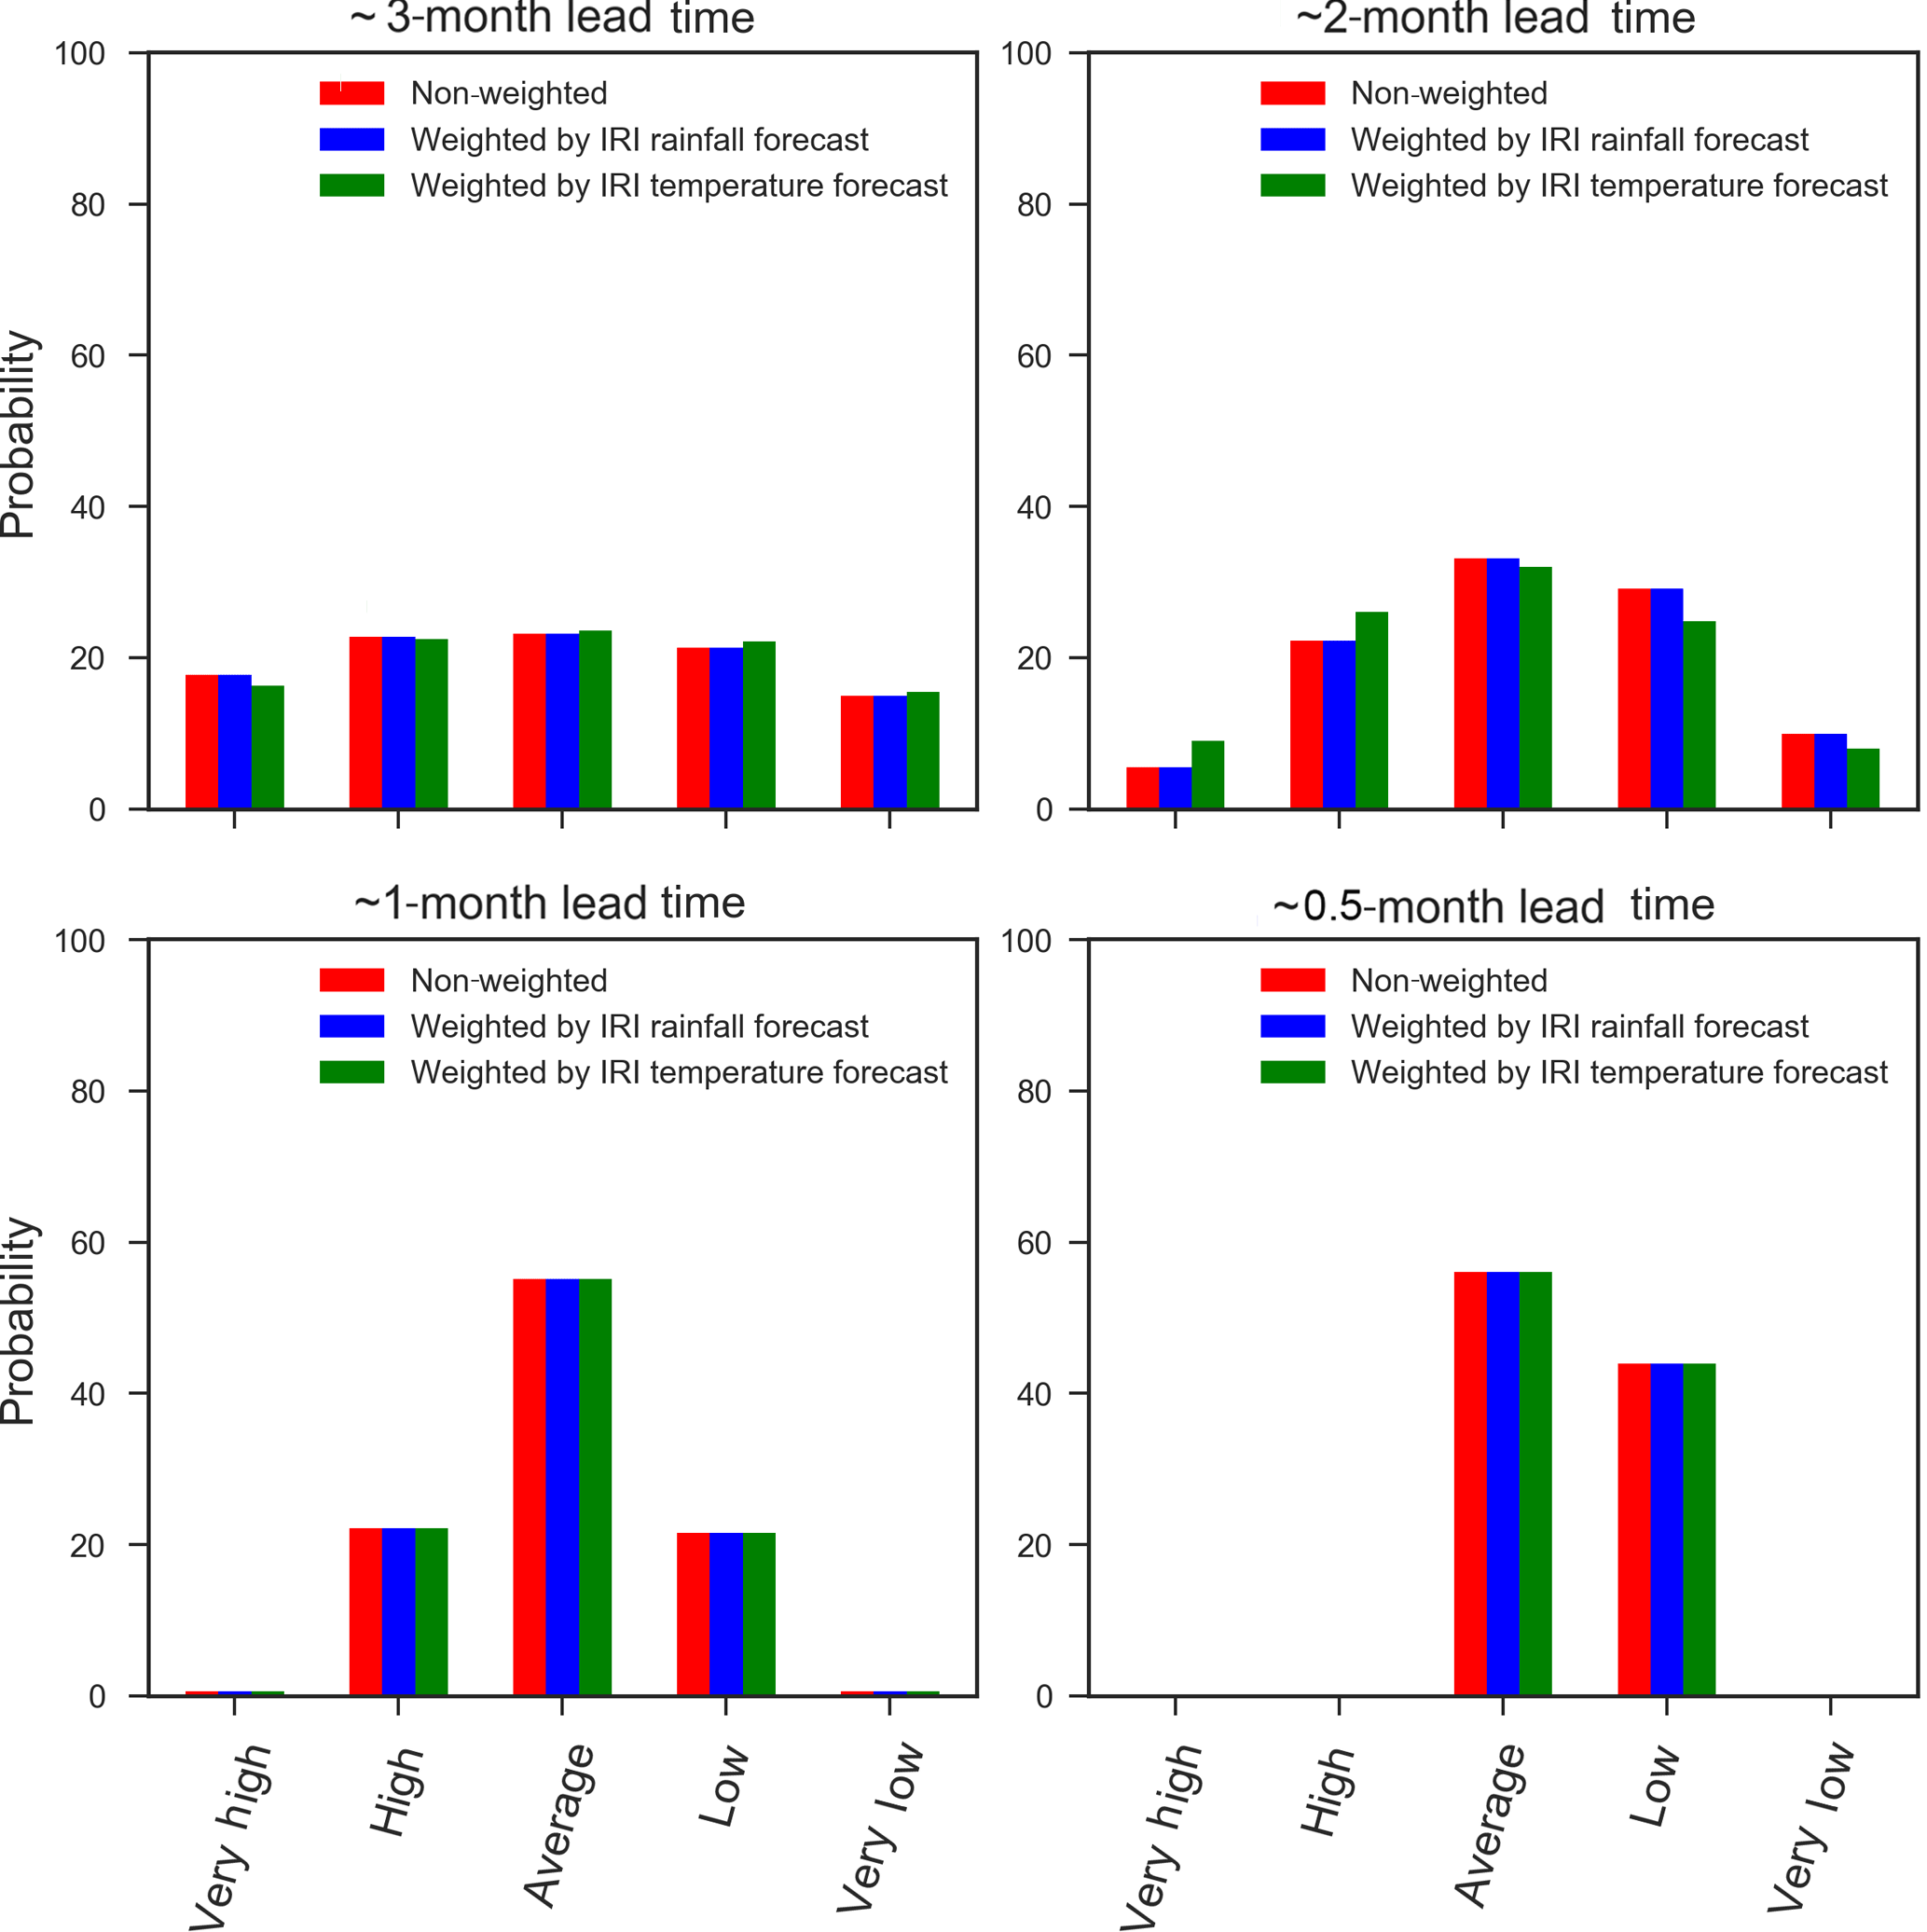
Figure 16Probability of yield forecast for the 2011 growing season when weighted by IRI seasonal forecast of rainfall (blue), when weighted by IRI seasonal forecast of temperature (green) and when no weightings are used (red). The x axis represents the pentile categories used in the yield forecast.
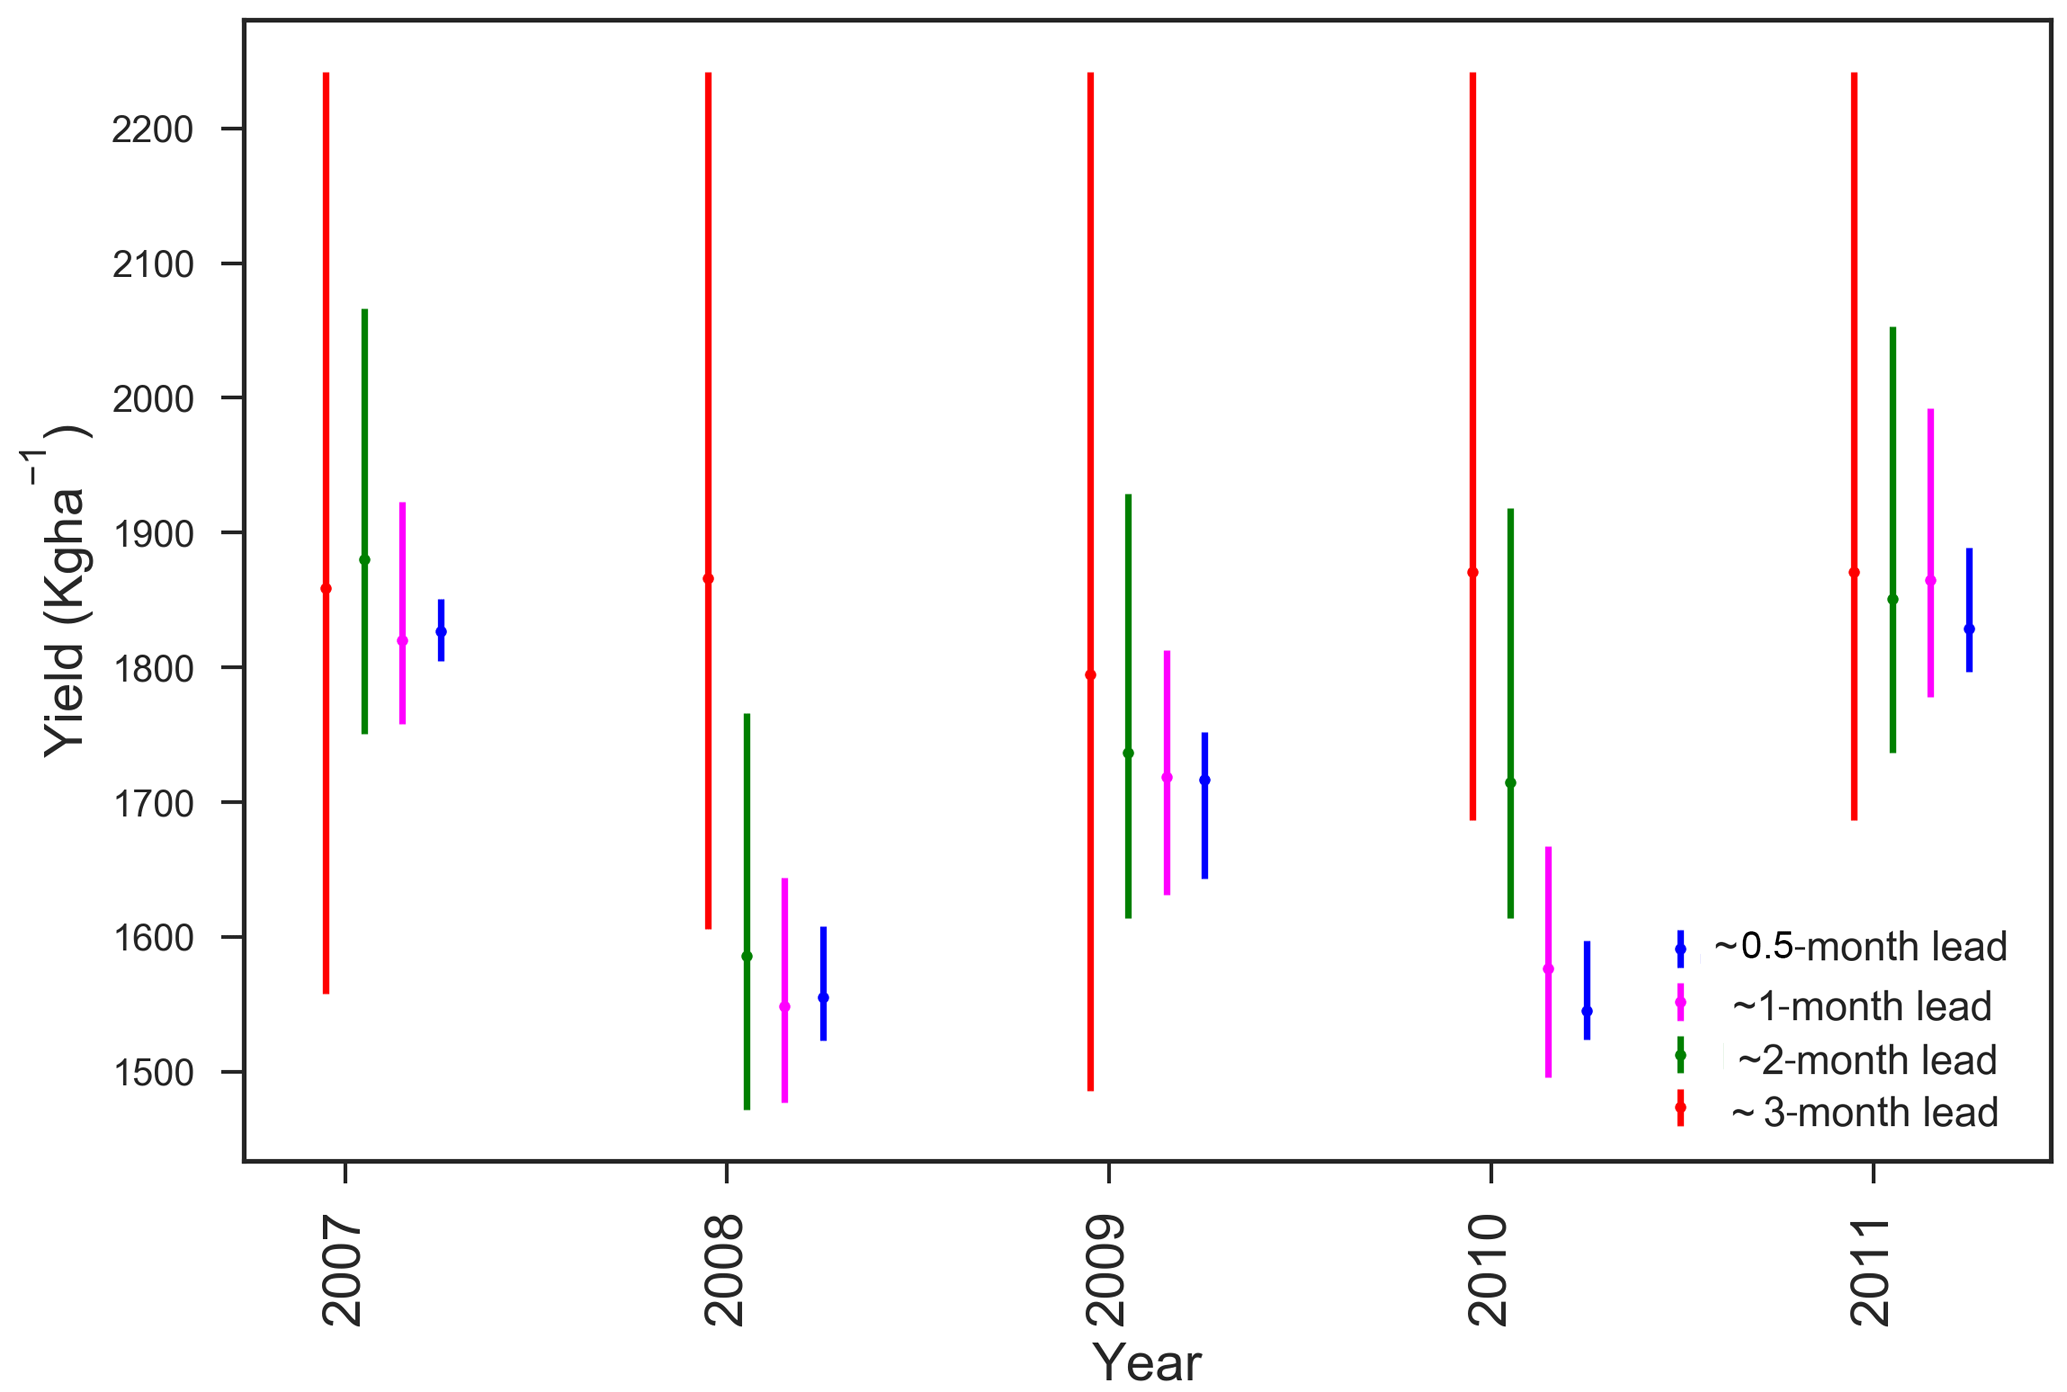
Figure 17Time series of maize yield forecast in Ghana from 2007 to 2011 with four lead times of forecast. This is done using a hindcast for each year and comparing the plots of ∼ 3-month lead time (red), ∼ 2-month lead time (green), ∼ 1-month lead time (magenta) and ∼ 0.5-month lead time (blue).

Figure 18Discrete ranked probability skill score for the yield forecasts over Tamale using the TAMSAT-ALERT system at different lead times.
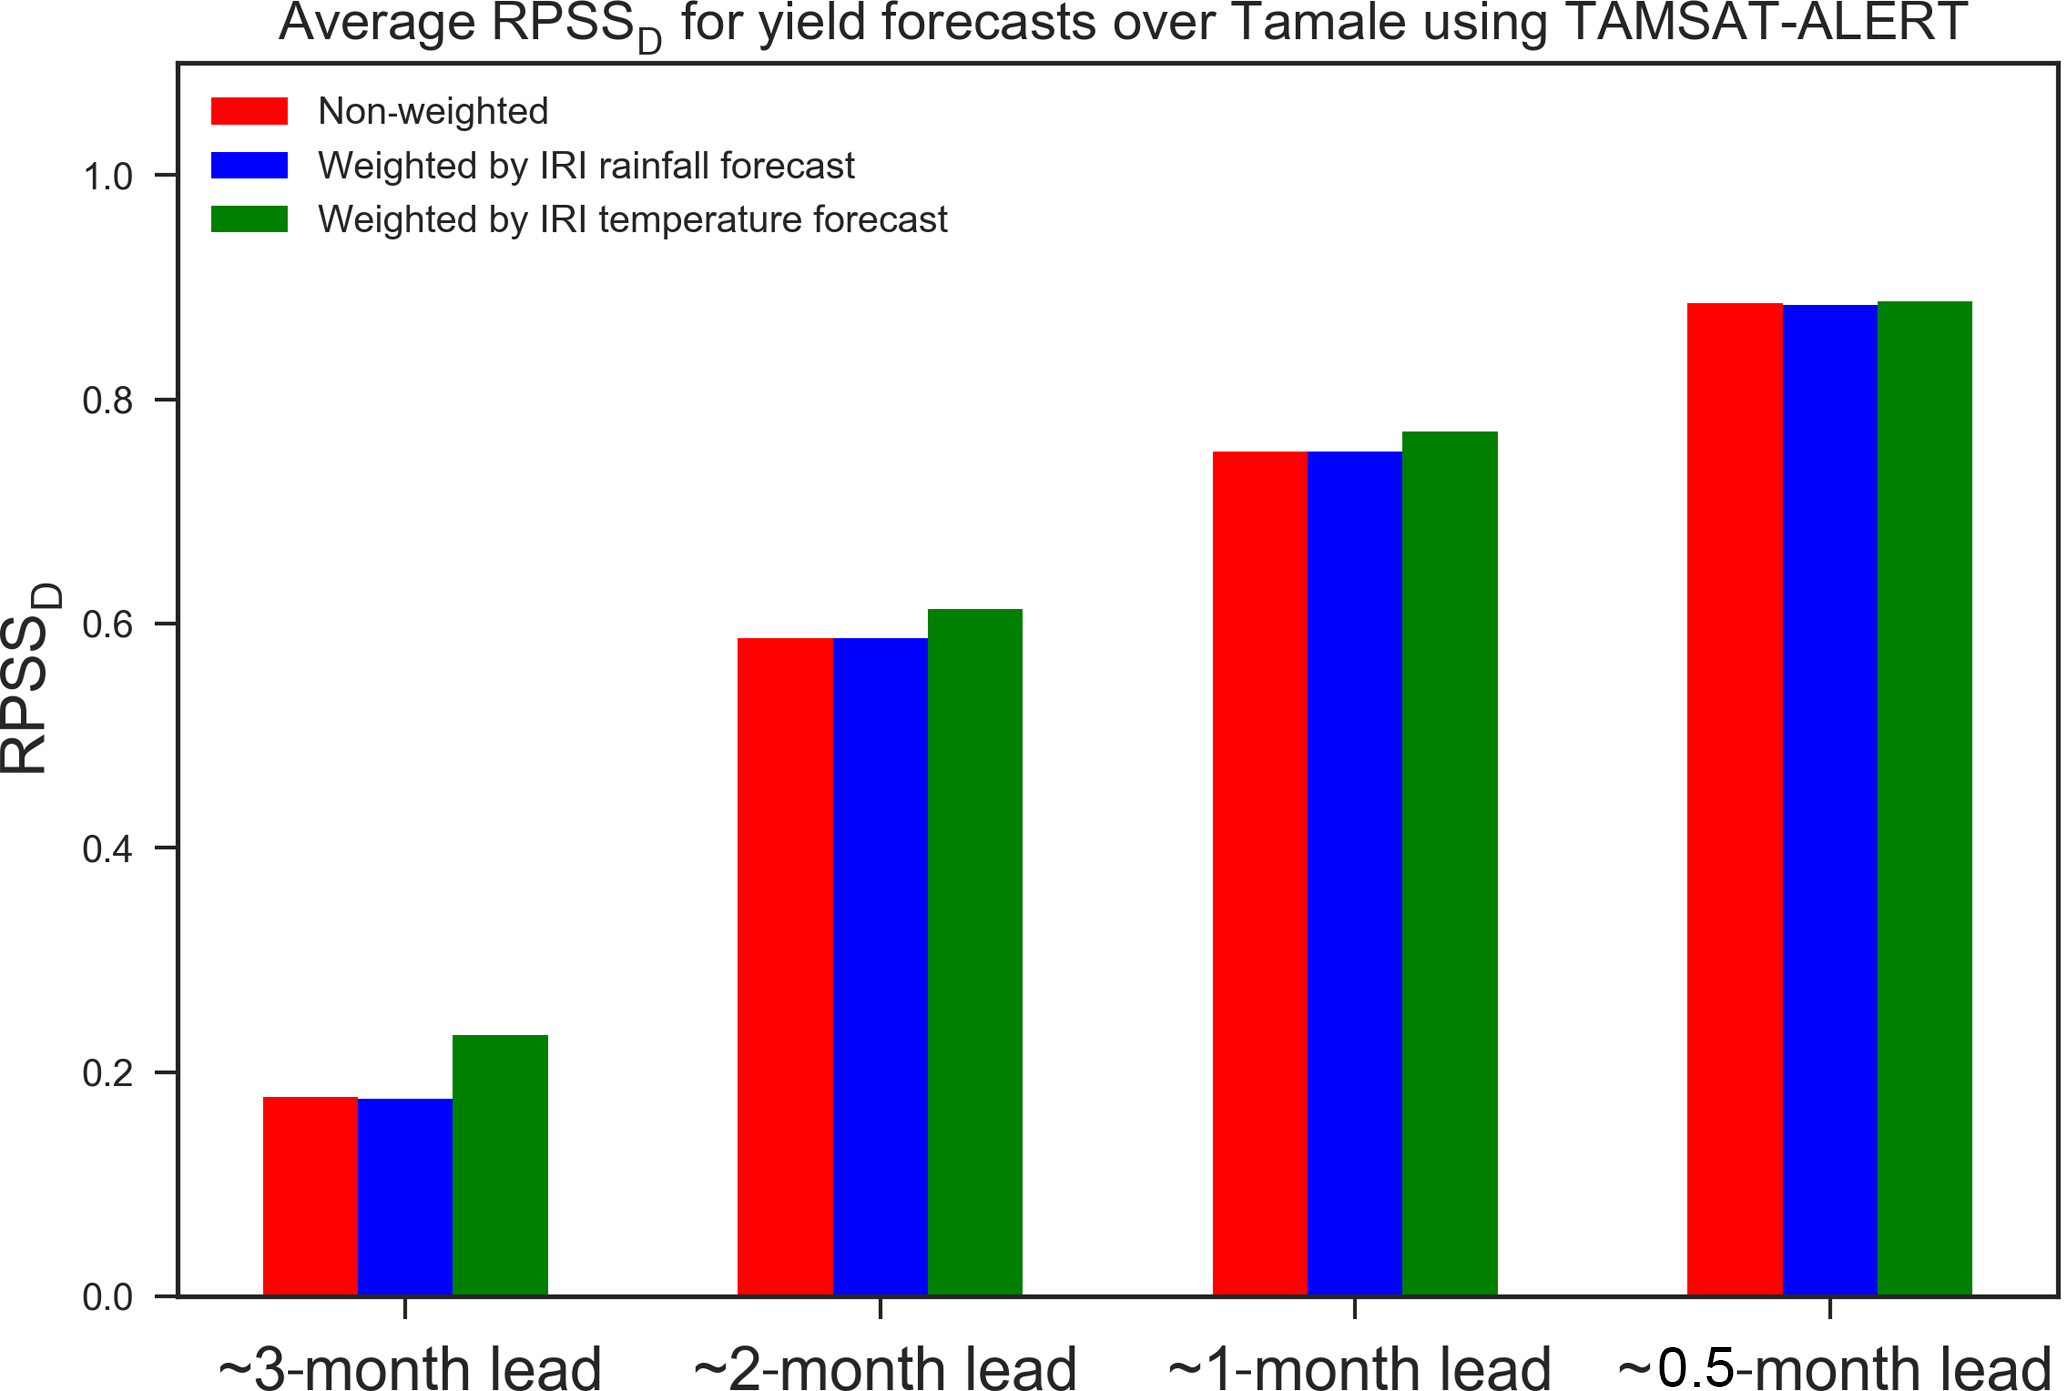
Figure 19Discrete ranked probability skill score for the yield forecasts over Tamale using the TAMSAT-ALERT system at different lead times averaged for 2002–2011.
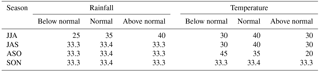
So far, only idealized forecasts have been considered. In the next section, we demonstrate the effect of using actual tercile forecast information issued by the International Research Institute (IRI) for rainfall and temperature. The seasonal forecasts from IRI for 2011 in northern Ghana are shown in Table 2.
Figure 14 shows the yield forecast probabilities based on weighting the yield ensembles by seasonal rainfall forecasts from IRI. Comparison with Fig. 11 suggests that the weighting has little effect. Figure 15 shows the quintile yield predictions when temperature forecast weightings from IRI are applied. As with rainfall, comparison with Fig. 15 shows that the weighting has little effect.
The results are summarized in Fig. 16, which represents the probability of each yield pentile at different lead times in the 2011 season yield forecast with no seasonal forecast, precipitation forecast or temperature forecast applied. For all lead time periods indicated, weighting by IRI seasonal forecast for the 2011 season showed no improvement in predicting the final yield compared to the non-weighted values. This is not surprising because the relationship between the seasonal cumulative rainfall and seasonal mean temperature with maize yield is very low (see Figs. S1 and S2 in the Supplement). The tercile weightings for the IRI forecast (Table 2) are close to climatology, and the previous discussion showed that even a perfect and precise seasonal forecast has relatively little impact.
In summary, Figs. 12 and 13 indicate that if meteorological forecasts have sufficient accuracy and precision, they can add information to the decision-making process, especially in the middle to later part of the growing season. However, Figs. 14–16 show that the tercile forecasts currently issued in northern Ghana do not have sufficient precision information to yield risk assessments. A further application of TAMSAT-ALERT could be to investigate the level of skill that is required for meteorological forecasts to contribute useful information to such decision-making processes.
3.3.3 Formal skill evaluation
The objective of TAMSAT-ALERT is to provide early warning of the meteorological risk to yield, which is not an observable quantity. For this reason, evaluations of TAMSAT-ALERT skill are carried out in a “perfect model” framework, in which we attempt to forecast the yield simulated by GLAM forced with observed weather data. It is important not to confuse these skill assessments with evaluation of GLAM (Sect. 3.2.3), although the usefulness of the framework depends to a large extent on the quality of the model and data incorporated within it.
Figure 17 shows GLAM hindcasts at four approximate lead times (i.e., ∼ 3, ∼ 2, ∼ 1, ∼ 0.5 months ahead of harvest) for 5 years. Towards the outset of the season, the hindcasts for each year are similar and close to the climatology, with the minor differences explained by variation in planting date. For all the lead times considered the spread of the ensembles is reduced as the season progresses. Only the years 2007–2012 are presented in Fig. 17 because the maize variety changed in 2007, making the hindcasts of these years more relevant to the present day than the 1994–2006 period (see Fig. S3).
As described in Sect. 3.3.1, the probabilistic ensemble forecasts will be presented as the likelihood of quintile categories. The skill of the probabilistic forecast was assessed using the ranked probability skill score (RPSS). The RPSS is a skill score formulated from the ranked probability score (RPS) that compares the cumulative squared probability error for climatological forecasts in each category identified. The RPSS is negatively biased with smaller ensemble sizes (< 40) and due to this a correction was done on the reference RPS used before calculating the final RPSS. The bias-corrected RPSS is called the discrete ranked probability skill score (RPSSD). Details on the calculation and bias-correction are given in Muller et al. (2005) and Weigel et al. (2007). Positive values indicate better skill than the climatology; a unit value represents a perfect score and zero or below-zero values indicate no skill in the forecast.
The RPSSD for Tamale was derived for the period 2002–2011. This period is used because IRI seasonal forecasts for precipitation and temperature issued on a monthly basis are only available from 2002. Figure 18 indicates the skill scores for the four lead times for the forecasts made using the TAMSAT-ALERT system. The skill scores are generally above 0.4 for ∼ 2-month lead time and over 0.6 for ∼ 1-month lead time over the 10-year period considered. There are some years in which the skill score was lower than the stated values and this is mainly because of shifts in forecast categories towards the end of the season, which tends to happen if the yield is near a category boundary. For example, the 2011 final yield was in the low category, but 1 month earlier than harvest the ensembles indicate 56 % in the average category and 44 % in the low category (see Fig. 11), which results in a low skill score for that year. The overall skill of the system is presented in Fig. 19, which shows a good skill even 2 months ahead of harvest. The average RPSSD shows an increase in skill as the lead time decreases, which is expected. Comparison of similar period skill scores for yield forecasted weighted by the IRI seasonal weather forecast of rainfall and temperature showed a similar result to that of the non-weighted forecast. This indicates that the seasonal forecasts have little impact in predicting the maize yield in the region, which is associated with both the low correlation of seasonal weather values and maize yield and with the vague nature of the forecasts.
The TAMSAT-ALERT framework complements and extends previous systems by driving impact models with ensembles based on observed weather rather than weather generators or direct forcing with seasonal forecasts. This provides a simple means of combining information at different scales and bias-correcting seasonal forecasts. The framework is thus capable of integrating multiple sources of environmental observations and forecasts into continually updated assessments of the likelihood of a user-defined adverse event, such as unfavorable weather conditions for maize yield. While the emphasis of our study has been on forecasting adverse events, such as low yields, it should be noted that TAMSAT-ALERT is also capable of anticipating favorable conditions, enabling decision makers to maximize the benefits of such years, for example by managing post-harvest storage and markets. The system can, moreover, work at any spatial scale for which driving data are available, including for individual communities.
The use of decision support tools for agricultural activities in Africa is low because of low capacity for model use, lack of funding from governments in the development of agricultural decision support tools, lack of data availability for the validation and calibration of models, and low knowledge among decision makers about the use of decision-making tools (MacCarthy et al., 2018). Nevertheless, the demand for meteorologically driven crop models, such as the Decision Support System for Agrometeorology Transfer (DSSAT), World Food Studies (WOFOST) and Crop Environment Resource Synthesis–Maize (CERES–Maize) for sub-Saharan Africa, speaks to a need for the quantification of the meteorological hazard to yield (Dzotsi et al., 2003; Kassie et al., 2014, 2015; MacCarthy et al., 2017). The implementation of TAMSAT-ALERT described in this study quantifies the meteorological risk to agriculture, and as such potentially provides information for government, aid agencies and nongovernmental organizations working in agriculture. A key result is that, even in the absence of meteorological seasonal forecasts, low yield can be anticipated 6–8 weeks before with some skill.
In the example described in this paper, we have used the GLAM crop model. It is clear from the validation of GLAM against national yield statistics presented in Sect. 3.2.3 that the model's ability to simulate year to year variation in Ghana-wide maize yield is moderate. Nevertheless, previous studies have demonstrated that GLAM can capture the meteorological hazard to yield (Challinor et al., 2007, 2010; Osborne et al., 2013) when the model is driven with high-quality meteorological data and is compared against robust information on yield. The provision of the scripts for the GLAM implementation will enable further studies to be carried out at locations with more robust information on yield and agronomic characteristics.
This study used the GLAM crop model as an illustration of the implementation of the system. The strength of TAMSAT-ALERT, however, is its modularity. TAMSAT-ALERT can be implemented for any impact model driven with meteorological data. There is now demand for TAMSAT-ALERT in locations throughout East and West Africa, with the system adapted to implement trusted metrics and models. This modularity and flexibility is important, since the skill of the TAMSAT-ALERT system is constrained by the quality of the model and its calibration. In this study, for example, the evaluation and calibration of GLAM was hampered by quality-control issues with the available yield data. The system would be much improved if used in house by agencies with access to high-quality yield data and locally calibrated models. Nevertheless, it is important that model error is taken into account in the decision-making process, and forecasts should therefore be issued in the context of model evaluations like the one presented in this study. TAMSAT-ALERT's modular structure, moreover, permits forecasts to be produced using an ensemble of crop models and crop model parameterizations, facilitating formal analysis of model uncertainties.
A key finding from our study is that tercile seasonal forecasts have little impact on TAMSAT-ALERT's skill for the case study considered. This is not unexpected. The correlation of 90-day total rainfall with GLAM-simulated maize yield in this region is low. The low correlation means that we do not expect precipitation seasonal forecasts to improve the yield forecasts even if they are skillful. Our results do not suggest that there is no information available from seasonal forecasts. However, we do show that 90-day tercile forecasts of temperature and rainfall, even if perfectly skillful, provide comparatively little information for risk assessments of low maize yield. This could be because the sensitivity of crops to moisture is on a specific period of their growth and the sensitivity of crops to temperature is also not similar throughout their growth stage. In other words, our findings highlight the necessity of more specific and localized forecasts if users are to benefit from the inherent skill contained in the forecasts. These findings are consistent with anecdotal evidence that the tercile seasonal forecasts of rainfall routinely issued by forecasting organizations are of little practical benefit for decision making. A secondary application of TAMSAT-ALERT could be to provide guidance on forecasts that would potentially be of use for decision makers should they have sufficient skill. Such analyses are currently underway as part of a major national capability program being carried out at the National Centre for Atmospheric Science.
In summary, TAMSAT-ALERT is a lightweight system, which can be run either using the computing facilities available in house at meteorological services or on the cloud. Its modular design enables it to work alongside existing systems to combine multiple sources of data into quantitative assessments of risk. Together with socioeconomic assessments, this information could be of significant value for governments, policy makers and humanitarian service providers tasked with mitigating the effect of drought on Africa's poorest farmers.
The TAMSAT-ALERT v1.0 framework code and the user manual are openly available on GitHub (https://github.com/tamsat-alert/v1-0, last access: June 2018) and Zenodo (Asfaw et al., 2018). The GLAM v3 crop model is provided under a license agreement, so it is not possible to directly release it on GitHub but it is possible to obtain it through the contact form at the following link (http://www.see.leeds.ac.uk/research/icas/research-themes/climate-change-and-impacts/climate-impacts/glam/, last access: June 2018).
The supplement related to this article is available online at: https://doi.org/10.5194/gmd-11-2353-2018-supplement.
The authors declare that they have no conflict of interest.
Any opinions, findings, conclusion or recommendations expressed in this publication are those of the author(s) and do not necessarily reflect the views of the BMGF.
Dagmawi Asfaw is supported by a studentship implemented by CIMMYT as part of Taking Maize Agronomy to Scale in Africa (TAMASA), made possible by the generous support of the Bill and Melinda Gates Foundation (BMGF).
Emily Black is supported by the NERC/GCRF Official Development Assistance
program, ACREW, which forms part of the core program of the National
Centre for Atmospheric Science – Climate Division. She also gratefully
acknowledges support from the BRAVE (NE/M008983/1) and HyCristal
(NE/M020371/1) projects. Matthew Brown's and Frederik Otu-Larbi's work on
this project was supported by the University of Reading impact program.
Ewan Pinnington and Tristan Quaife were funded by the UK Natural Environment
Research Council project ERADACS (NE/P015352/1) and the National Centre for
Earth Observation. Kathryn Jane Nicklin and Andrew Challinor were funded by
the NERC/DFID Future Climate for Africa program under the AMMA-2050 project,
grant number NE/M020126/1.
Edited by: Carlos Sierra
Reviewed by: two anonymous referees
Asfaw, D., Black, E., Brown, M., Nicklin, K. J., Otu-Larbi, F., Pinnington, E., Challinor, A., Maidment, R., and Quaife, T.: TAMSAT-ALERT v1: A new framework for agricultural decision support, https://doi.org/10.5281/zenodo.1164603, 2018.
Bannayan, M., Crout, N. M., and Hoogenboom, G.: Application of the CERES-Wheat model for within-season prediction of winter wheat yield in the United Kingdom, Agron. J., 95, 114–125, https://doi.org/10.2134/agronj2003.0114, 2003.
Barnston, A. G. and Tippett, M. K.: Climate information, outlooks, and understanding-where does the IRI stand?, Earth Perspectives, 1, 20, https://doi.org/10.1186/2194-6434-1-20, 2014.
Black, E., Greatrex, H., Young, M., and Maidment, R.: Incorporating satellite data into weather index insurance, B. Am. Meteorol. Soc., 97, ES203–ES206, https://doi.org/10.1175/BAMS-D-16-0148.1, 2016.
Boyd, E., Cornforth, R. J., Lamb, P. J., Tarhule, A., Lélé, M. I., and Brouder, A.: Building resilience to face recurring environmental crisis in African Sahel, Nat. Clim. Change, 3, 631–638, https://doi.org/10.1038/NCLIMATE1856, 2013.
Brown, M., Black, E., Asfaw, D., and Otu-larbi, F.: Monitoring drought in Ghana using TAMSAT-ALERT: a new decision support system, Weather-Royal Meteorology Society, 72, 201–205, https://doi.org/10.1002/wea.3033, 2017.
Canal, N., Deudon, O., Le Bris, X., Gate, P., Pigeon, G., Regimbeau, M., and Calvet, J.-C.: Anticipation of the winter wheat growth based on seasonal weather forecasts over France, Meteorol. Appl., 24, 432–443, https://doi.org/10.1002/met.1642, 2017.
Challinor, A. J. and Wheeler, T. R.: Crop yield reduction in the tropics under climate change: Processes and uncertainties, Agr. Forest Meteorol., 148, 343–356, https://doi.org/10.1016/j.agrformet.2007.09.015, 2008.
Challinor, A., Wheeler, T. R., Osborne, T. M., and Slingo, J. M.: Assessing the vulnerability of crop productivity to climate change thresholds using an integrated crop-climate model, in: Avoiding Dangerous Climate Change, edited by: Schellnhuber, J., Cramer, W., Nakicenovic, N., Yohe, G., and Wigley, T., Cambridge University Press, United Kingdom, 187–194, doi10.2277/0521864712, 2006.
Challinor, A. J., Wheeler, T. R., Craufurd, P. Q., Slingo, J. M., and Grimes, D. I. F.: Design and optimisation of a large-area process-based model for annual crops, Agr. Forest Meteorol., 124, 99–120, https://doi.org/10.1016/j.agrformet.2004.01.002, 2004.
Challinor, A. J., Slingo, J. M., Wheeler, T. R., and Doblas-Reyes, F. J.: Probabilistic simulations of crop yield over western India using the DEMETER seasonal hindcast ensembles, Tellus A, 57, 498–512, https://doi.org/10.3402/tellusa.v57i3.14670, 2005.
Challinor, A. J., Wheeler, T. R., Craufurd, P. Q., Ferro, C. A. T., and Stephenson, D. B.: Adaptation of crops to climate change through genotypic responses to mean and extreme temperatures, Agr. Ecosyst. Environ., 119, 190–204, https://doi.org/10.1016/j.agee.2006.07.009, 2007.
Challinor, A. J., Simelton, E. S., Fraser, E. D. G., Hemming, D., and Collins, M.: Increased crop failure due to climate change: assessing adaptation options using models and socio-economic data for wheat in China, Environ. Res. Lett., 5, 034012, https://doi.org/10.1088/1748-9326/5/3/034012, 2010.
Dzotsi, K., Agboh-Noameshie, A., Struif Bontkes, T., Singh, U., and Dejean, P.: Using DSSAT to derive optimum combinations of cultivar and sowing date for maize in southern Togo, in: Decision Support Tools for Smallholder Agriculture in Sub-Saharan Africa; A Practical Guide, edited by: Bontkes, T. and Wopereis, M., IFDC Muscle Shoals, USA, and CTA, Wageningen, 100–112, 2003.
FAO/WFP-Global Information and Early Warning System on food and agriculture (FAO/WFP-GIEWS): Special report FAO/WFP crop and food supply assessment mission to northern Ghana, available at: http://www.fao.org/docrep/005/y6325e/y6325e00.htm (last access: June 2018), 2002.
Hansen, J. W. and Indeje, M.: Linking dynamic seasonal climate forecasts with crop simulation for maize yield prediction in semi-arid Kenya, Agr. Forest Meteorol., 125, 143–157, https://doi.org/10.1016/j.agrformet.2004.02.006, 2004.
Hansen, J. W., Challinor, A., Ines, A., Wheeler, T., and Moron, V.: Translating climate forecasts into agricultural terms: Advances and challenges, Clim. Res., 33, 27–41, https://doi.org/10.3354/cr033027, 2006.
Kassie, B. T., Van Ittersum, M. K., Hengsdijk, H., Asseng, S., Wolf, J., and Rötter, R. P.: Climate-induced yield variability and yield gaps of maize (Zea mays L.) in the Central Rift Valley of Ethiopia, Field Crop. Re., 160, 41–53, https://doi.org/10.1016/j.fcr.2014.02.010, 2014.
Kassie, B. T., Asseng, S., Rotter, R. P., Hengsdijk, H., Ruane, A. C., and Van Ittersum, M. K.: Exploring climate change impacts and adaptation options for maize production in the Central Rift Valley of Ethiopia using different climate change scenarios and crop models, Clim. Change, 129, 145–158, https://doi.org/10.1007/s10584-014-1322-x, 2015.
Kirtman, B. P., Min, D., Infanti, J. M., Kinter, J. L., Paolino, D. A., Zhang, Q., Van Den Dool, H., Saha, S., Mendez, M. P., Becker, E., Peng, P., Tripp, P., Huang, J., Dewitt, D. G., Tippett, M. K., Barnston, A. G., Li, S., Rosati, A., Schubert, S. D., Rienecker, M., Suarez, M., Li, Z. E., Marshak, J., Lim, Y. K., Tribbia, J., Pegion, K., Merryfield, W. J., Denis, B., and Wood, E. F.: The North American multimodel ensemble: Phase-1 seasonal-to-interannual prediction; phase-2 toward developing intraseasonal prediction, B. Am. Meteorol. Soc., 95, 585–601, https://doi.org/10.1175/BAMS-D-12-00050.1, 2014.
MacCarthy, D. S., Adiku, S. G. K., Freduah, B. S., and Gbefo, F.: Using CERES-Maize and ENSO as Decision Support Tools to Evaluate Climate-Sensitive Farm Management Practices for Maize Production in the Northern Regions of Ghana, Front. Plant Sci., 8, 1–13, https://doi.org/10.3389/fpls.2017.00031, 2017.
MacCarthy, D. S., Kihara, J., Masikati, P., and Adiku, S. G. K.: Decision support tools for site-specific fertilizer recommendations and agricultural planning in selected countries in sub-Sahara Africa, Nutr. Cycl. Agroecosys., 110, 343–359, https://doi.org/10.1007/s10705-017-9877-3, 2018.
Maidment, R. I., Grimes, D., Black, E., Tarnavsky, E., Young, M., Greatrex, H., Allan, R. P., Stein, T., Nkonde, E., Senkunda, S., and Alcantara, E. M. U.: A new, long-term daily satellite-based rainfall dataset for operational monitoring in Africa, Scientific Data, 4, 1–19, https://doi.org/10.1038/sdata.2017.63, 2017.
Martey, E., Wiredu, A. N., Etwire, P. M., Buah, S. S. J., Fosu, M., Bidzakin, J., Ahiabor, B. D. K., and Kusi, F.: Fertilizer Adoption and Use Intensity Among Smallholder Farmers in Northern Ghana: A Case Study of the AGRA Soil Health Project, Sustainable Agriculture Research, 3, 24–36, https://doi.org/10.5539/sar.v3n1p24, 2014.
Monfreda, C., Ramankutty, N., and Foley, J. A.: Farming the planet. Part 2: Geographic distribution of crop areas, yields, physiological types, and net primary production in the year 2000, Glob. Biogeochem. Cy., 22, GB1022, https://doi.org/10.1029/2007GB002947, 2008.
Muller, C., Cramer, W., Hare, W. L., and Lotze-Campen, H.: Climate change risks for African agriculture, P. Natl. Acad. Sci. USA, 108, 4313–4315, https://doi.org/10.1073/pnas.1015078108, 2011.
Muller, W. A., Appenzeller, C., Doblas-Reyes, F. J., and Liniger, M. A.: A debiased ranked probability skill score to evaluate probabilistic ensemble forecasts with small ensemble sizes, J. Climate, 18, 1513–1523, https://doi.org/10.1175/JCLI3361.1, 2005.
Obeng-Antwi, K., Manfred Ewool, A. H., Abate, T., Menkir, A., Badu-Apraku, B., and Abdoulaye, T.: New Drought Tolerant Maize Varieties for Ghana, A Quarterly Bulletin of the Drought Tolerant Maize for Africa Project, available at: http://dtma.cimmyt.org (last access: June 2018), 2, 1–4, 2013.
Osborne, T., Rose, G., and Wheeler, T.: Variation in the global-scale impacts of climate change on crop productivity due to climate model uncertainty and adaptation, Agr. Forest Meteorol., 170, 183–194, https://doi.org/10.1016/j.agrformet.2012.07.006, 2013.
Osborne, T. M., Lawrence, D. M., Challinor, A. J., Slingo, J. M., and Wheeler, T. R.: Development and assessment of a coupled crop-climate model, Glob. Change Biol., 13, 169–183, 2007.
Owusu, K. and Waylen, P.: Trends in spatio-temporal variability in annual rainfall in Ghana (1951–2000), Weather, 64, 115–120, https://doi.org/10.1002/wea.255, 2009.
Owusu, K. and Waylen, P. R.: The changing rainy season climatology of mid-Ghana, Theor. Appl. Climatol., 112, 419–430, https://doi.org/10.1007/s00704-012-0736-5, 2013.
PARI: Potentials and Possibilities for German Collaboration in Agriculture, Program of Accompanying Research for Agricultural Innovation, available at: http://research4agrinnovation.org/wp-content/uploads/2016/03/Ghana.pdf (last access: June 2018), 2015.
Parkes, B., Challinor, A., and Nicklin, K.: Crop failure rates in a geoengineered climate: impact of climate change and marine cloud brightening, Environ. Res. Lett., 10, 084003, https://doi.org/10.1088/1748-9326/10/8/084003, 2015.
Ragasa, C., Dankyi, A., Acheampong, P., Wiredu, A. N., Chapoto, A., Asamoah, M., and Tripp, R.: Patterns of adoption of improved rice technologies in Ghana, Ghana Strategy Support Program (GSSP) Working Paper, 36, 1–33, https://doi.org/10.13140/2.1.5093.4727, 2013.
Ramirez-Villegas, J. and Challinor, A. J.: Towards a genotypic adaptation strategy for Indian groundnut cultivation using an ensemble of crop simulations, Clim. Change, 138, 223–238, https://doi.org/10.1007/s10584-016-1717-y, 2016.
Ramirez-Villegas, J., Koehler, A. K., and Challinor, A. J.: Assessing uncertainty and complexity in regional-scale crop model simulations, Eur. J. Agron., 88, 84–95, https://doi.org/10.1016/j.eja.2015.11.021, 2015a.
Ramirez-Villegas, J., Watson, J., and Challinor, A. J.: Identifying traits for genotypic adaptation using crop models, J. Exp. Bot., 66, 3451–3462, https://doi.org/10.1093/jxb/erv014, 2015b.
Semenov, M. A. and Doblas-Reyes, F. J.: Utility of dynamical seasonal forecasts in predicting crop yield, Clim. Res., 34, 71–81, https://doi.org/10.3354/Cr034071, 2007.
Sheffield, J., Wood, E. F., Chaney, N., Guan, K., Sadri, S., Yuan, X., Olang, L., Amani, A., Ali, A., Demuth, S., and Ogallo, L.: A drought monitoring and forecasting system for sub-Sahara African water resources and food security, B. Am. Meteorol. Soc., 95, 861–882, https://doi.org/10.1175/BAMS-D-12-00124.1, 2014.
Sidibe, Y., Williams, T. O., and Kolavalli, S.: Flood recession agriculture for food security in Northern Ghana: Literature review on extent, challenges, and opportunities, Ghana Strategy Support Program working paper, 42, 1–18, https://doi.org/10.13140/RG.2.1.3250.8405, 2016.
Tarhule, A., Saley-Bana, Z., and Lamb, P. J.: RainWatch: A prototype GIS for rainfall monitoring in West Africa, B. Am. Meteorol. Soc., 90, 1607–1614, https://doi.org/10.1175/2009BAMS2697.1, 2009.
Watson, J. and Challinor, A.: The relative importance of rainfall, temperature and yield data for a regional-scale crop model, Agr. Forest Meteorol., 170, 47–57, https://doi.org/10.1016/j.agrformet.2012.08.001, 2013.
Weedon, G. P., Balsamo, G., Bellouin, N., Gomes, S., Best, M. J., and Viterbo, P.: The WFDEI meteorological forcing data set: WATCH Forcing data methodology applied to ERA-Interim reanalysis data, Water Resour. Res., 50, 7505–7514, https://doi.org/10.1002/2014WR015638, 2014.
Weigel, A. P., Liniger, M. A., and Appenzeller, C.: Generalization of the Discrete Brier and Ranked Probability Skill Scores for Weighted Multimodel Ensemble Forecasts, Mon. Weather Rev., 135, 2778–2785, https://doi.org/10.1175/MWR3428.1, 2007.