the Creative Commons Attribution 4.0 License.
the Creative Commons Attribution 4.0 License.
 | 10 Aug 2018
UK Global Ocean GO6 and GO7: a traceable hierarchy of model resolutions
David Storkey
Adam T. Blaker
Pierre Mathiot
Alex Megann
Yevgeny Aksenov
Edward W. Blockley
Daley Calvert
Tim Graham
Helene T. Hewitt
Patrick Hyder
Till Kuhlbrodt
Jamie G. L. Rae
Bablu Sinha
Versions 6 and 7 of the UK Global Ocean configuration (known as GO6 and GO7) will form the ocean components of the Met Office GC3.1 coupled model and UKESM1 earth system model to be used in CMIP61 simulations. The label “GO6” refers to a traceable hierarchy of three model configurations at nominal 1, 1∕4 and resolutions. The GO6 configurations are described in detail with particular focus on aspects which have been updated since the previous version (GO5). Results of 30-year forced ocean-ice integrations with the model are presented, in which GO6 is coupled to the GSI8.1 sea ice configuration and forced with CORE22 fluxes. GO6-GSI8.1 shows an overall improved simulation compared to GO5-GSI5.0, especially in the Southern Ocean where there are more realistic summertime mixed layer depths, a reduced near-surface warm and saline biases, and an improved simulation of sea ice. The main drivers of the improvements in the Southern Ocean simulation are tuning of the vertical and isopycnal mixing parameters. Selected results from the full hierarchy of three resolutions are shown. Although the same forcing is applied, the three models show large-scale differences in the near-surface circulation and in the short-term adjustment of the overturning circulation. The GO7 configuration is identical to the GO6 configuration except that the cavities under the ice shelves are opened. Opening the ice shelf cavities has a local impact on temperature and salinity biases on the Antarctic shelf with some improvement in the biases in the Weddell Sea.
- Article
(15408 KB) -
Supplement
(158 KB) - BibTeX
- EndNote


Since 2010 the UK Met Office, the National Oceanography Centre and the British Antarctic Survey have collaborated on the development of standard global ocean model configurations based on the NEMO code (Madec, 2016). These are intended to be used for a variety of applications across a range of timescales from ocean forecasting a few days ahead to century-scale climate modelling. The use of a single ocean model configuration for multiple applications is in the spirit of the seamless forecasting approach (Brown et al., 2012).
This paper describes the latest Global Ocean configurations GO6 and GO7, and presents results of testing them in forced mode with the GSI8.1 configuration of the CICE sea ice model. The GO6 ocean model is the ocean component of the GC3.1 version of the Met Office Hadley Centre coupled climate model (Williams et al., 2017; Hewitt et al., 2016) and the ocean component of the UKESM1 (UK Earth System Model; Kuhlbrodt et al., 2018), both of which will be used in CMIP6 simulations (Eyring et al., 2016) and associated OMIP3 simulations (Griffies et al., 2016). GO6 is expected to be incorporated into future versions of the FOAM4 ocean forecasting system (Blockley et al., 2014), the GloSea5 seasonal forecasting system (MacLachlan et al., 2015) and the DePreSys6 decadal forecasting system (Dunstone et al., 2016).
The previous configuration GO5 (Megann et al., 2014) was only released at a single resolution of a nominal horizontal grid spacing. GO6 is a traceable hierarchy of three horizontal resolutions: 1, 1∕4 and , all with the same vertical grid. By traceable we mean that the only differences between the three configurations are those that can be justified as necessitated by the change in resolution, an example being tuning of the horizontal viscosity. The main focus of this paper is on the configuration, but we also present selected results from the traceable hierarchy of resolutions in Sect. 6. The GO7 configuration is identical to GO6 except that the ice shelf cavities are open. GO7 currently only exists at resolution.
The paper is structured as follows. Section 2 gives a full model description of GO6; Sect. 3 describes the initialization and forcing data sets for the forced tests; Sect. 4 describes the aspects of the model that have changed relative to the GO5 configuration and presents some results of sensitivity experiments; Sect. 5 presents an overall model evaluation of the model comparing GO6 to GO5; Sect. 6 shows results from the hierarchy of resolutions of GO6; Sect. 7 briefly describes the impact of opening the cavities under the ice shelves and Sect. 8 presents a summary and indication of future developments.
GO6 and GO7 are part of the Global Ocean (GO) configuration series, building on the GO5 model described by Megann et al. (2014). This section provides a full model description of GO6/GO7 and also a brief overview of the GSI8.1 sea ice model. GO6 and GO7 are based on version 3.6 of the NEMO ocean model code (Madec, 2016). The 1∕4 and models are descended from versions of the global Drakkar configurations (Barnier et al., 2006; Drakkar, 2017), and still share many of the same dynamics and physics choices.
2.1 Model grid and bathymetry
The hierarchy of resolutions is based on the “ORCA” family of global grids within the NEMO framework (Madec, 2016), specifically ORCA1, ORCA025 and ORCA12. These have nominal 1, 1∕4 and resolution at the Equator and an isotropic Mercator grid in which the meridional grid spacing is reduced to match the reduction in the zonal grid spacing in the poleward direction. In the Northern Hemisphere there is a quasi-isotropic bipolar grid with poles at land points in Siberia and Canada. The ORCA1 model has increased resolution in the meridional direction near the Equator. In the Southern Hemisphere, the grids have been extended southwards compared to the original versions7 with the southern limit changed from 77 to 85∘ S to permit the modelling of the circulation under ice shelves in Antarctica. A simple extension of the Mercator grid southwards would result in very small grid spacings at the southernmost points giving a severe CFL limit on the time step. An alternative procedure described in Mathiot et al. (2017) is therefore used, whereby segments of the Northern Hemisphere bipolar part of the grid are scaled and joined to the southern edge of the existing grid.
The three models share a common set of 75 vertical levels (Culverwell, 2009). The level thickness is 1 m near the surface and 200 m at depth, increasing as a double tanh function. This gives a balance between high resolution near the surface to resolve short-term ocean responses to atmospheric forcing and reasonable resolution in the thermocline. Stewart et al. (2017) show that 75 levels is the minimum number capable of resolving the second baroclinic mode. Cells spanning partial model levels are allowed next to the bathymetry (Barnier et al., 2006; Adcroft et al., 1997).
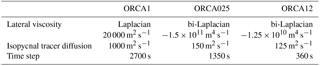
Table 1Table giving GO6 parameters and settings that vary between resolutions.
The model bathymetries for each of the three resolutions were derived from different data sets; in this respect the hierarchy of resolutions is not yet fully traceable. The ORCA1 bathymetry is derived from the ETOPO2 data set (NOAA, 2006) with the bathymetry on the Antarctic shelf based on IBSCO (Arndt et al., 2013). For ORCA025, the bathymetry is derived from the ETOPO1 data set (Amante and Eakins, 2009) with modifications in coastal regions based on GEBCO (IOC, IHO and BODC, 2003) and the bathymetry on the Antarctic shelf derived from IBSCO (Arndt et al., 2013). For ORCA12 the bathymetry is derived from GEBCO_2014 (Weatherall et al., 2015).
2.2 Free surface solution and advection
The model uses a nonlinear free surface in which the cell thicknesses throughout the water column are allowed to vary with time (the z* coordinate of Adcroft and Campin, 2004). This permits an exact representation of the surface fresh water flux. The equation for the surface pressure gradient is solved using a filtered solution in which the fast gravity waves are damped by an additional force in the equation (Roullet and Madec, 2000).
The momentum advection term is a vector-invariant formulation in which the horizontal advection is split into rotational and irrotational parts. The vorticity term (including the Coriolis term) is calculated using the energy and enstrophy conserving scheme of Arakawa and Lamb (1981). There are two versions of this scheme in NEMO which differ according to how the topography boundary condition is handled. For GO6 we choose the ln_dynvor_een_old=true option which reinforces the tendency of the flow to follow isobaths (Madec, 2016, Sect. 6.2). This is the same option that was used for GO5. The irrotational part of the momentum advection is formulated according to Hollingsworth et al. (1983) in order to avoid vertical numerical instabilities. Advection of tracers is done using the total variance diminishing (TVD) scheme of Zalesak (1979).
2.3 Mixing and boundary conditions
Lateral diffusion of momentum is on geopotential surfaces and uses a Laplacian viscosity in ORCA1 and a bi-Laplacian viscosity in ORCA025 and ORCA12 with coefficients given in Table 1. The viscosity coefficients reduce polewards – linearly with grid size for the Laplacian and with the cube of the grid length for the bi-Laplacian – in order to avoid numerical diffusion instabilities. Lateral diffusion of tracers is along isoneutral surfaces using Laplacian mixing with coefficients given in Table 1. For ORCA1, a parameterization of adiabatic eddy mixing (Gent and Mcwilliams, 1990) with a spatially varying coefficient (Held and Larichev, 1996) is used, but this is not included in ORCA025 or ORCA12. A free slip lateral boundary condition on momentum is applied at all resolutions. For the 1∕4 and configurations, the momentum boundary condition is changed around the coastline of Antarctica to a partial slip condition at and a no-slip condition at . This is to avoid instabilities associated with artificial cliffs in the bathymetry at the edge of the ice shelves where the ice cavities have been closed.
The vertical mixing of tracers and momentum is parameterized using a modified version of the Gaspar et al. (1990) turbulent kinetic energy (TKE) scheme (Madec, 2016). Unresolved mixing due to internal wave breaking is represented by a background vertical eddy diffusivity of m2 s−1, which decreases linearly from latitude to a value of m2 s−1 at latitude (Gregg et al., 2003) and a globally constant background viscosity of m2 s−1. Additionally there is enhanced mixing at the surface depending on the wind stress to represent mixing due to surface wave breaking (Craig and Banner, 1994), a representation of Langmuir cell mixing (Axell, 2002), and an ad hoc representation of mixing due to near-inertial wave breaking (Rodgers et al., 2014). This latter term has an associated length scale which can be varied geographically. This was tuned in GO5 (Megann et al., 2014) and further tuning of this term has taken place as part of the development of GO6, which is described in Sect. 4.3.
Convection in the model is parameterized as an enhanced vertical diffusivity of 10 m2 s−1 for momentum and tracer fields where the water column is unstable. A parameterization of double diffusive mixing is included (Merryfield et al., 1999). A climatological geothermal heat flux due to Stein and Stein (1992) is used as a bottom boundary condition. A quadratic bottom friction is used with increased friction in the Indonesian Throughflow, Denmark Strait and Bab-el-Mandeb regions. The bottom boundary layer scheme of Beckmann and Döscher (1997) is used with advective and diffusive components. The tidal mixing parameterization of Simmons et al. (2004) is included with a special formulation for the Indonesian Throughflow (Koch-Larrouy et al., 2008).
2.4 Fresh water input from land
Fresh water runoff from land is input in the surface layer of the ocean with the assumption that the runoff is fresh and at the same temperature as the local sea surface temperature. An enhanced vertical mixing of m2 s−1 is added over the top 10 m of the water column at runoff points to mix the runoff vertically and avoid instabilities associated with very shallow fresh layers at the surface. Fresh water input from ice sheets in Greenland and Antarctica is modelled using a Lagrangian iceberg scheme and a parameterization of ice shelf basal melting .
The Lagrangian iceberg model is that of Bigg et al. (1997) and Martin and Adcroft (2010), which was implemented in NEMO by Marsh et al. (2015). Icebergs are represented by Lagrangian particles with each particle representing a collection of icebergs within a given size range. The momentum balance for icebergs comprises the Coriolis force, air and water form drags, the horizontal pressure gradient force and a wave radiation force. The mass balance for an individual iceberg is governed by basal melting, buoyant convection at the sidewalls and wave erosion. While this model gives a reasonable approximation of iceberg behaviour, there are a number of weaknesses. Firstly, the icebergs only exchange heat and fresh water with the surface layer of the ocean (of 1 m thickness in GO6) and are advected by surface currents, whereas in reality many icebergs have draughts of hundreds of metres and so will interact with the ocean at depth. Secondly, there is no momentum exchange with sea ice. Thirdly, while the latent heat of melting is extracted from the ocean, the heat content of the meltwater input to the ocean is neglected.
The extended versions of the ORCA grids and developments in the NEMO 3.6 code make it possible to model the ocean circulation beneath the major ice shelves around Antarctica (Mathiot et al., 2017). In the GO6 configuration we close these cavities and prescribe climatological fresh water input through depth at the edge of the ice shelves to mimic the effect of ice shelf basal melt on the wider circulation, a parameterization described in Mathiot et al. (2017). In GO7 the cavities are open and climatological melting is prescribed at the bottom of the ice shelf.
2.5 Sea ice model
For the CORE2-forced experiments described in this paper, GO6 and GO7 are run with the GSI8.1 configuration of the Los Alamos National Laboratory sea ice model CICE. The GSI8.1 configuration is described in detail by Ridley et al. (2018). It consists of version 5.2.1 of the CICE base code with multi-layer, energy-conserving thermodynamics (Bitz and Lipscomb, 1999), elastic-viscous-plastic ice rheology (Hunke and Dukowicz, 1997) and multi-category ice thickness (Bitz et al., 2001) with 5 thickness categories. The multi-layer thermodynamics uses four layers of ice and one layer of snow. The impact of surface melt ponds is included, with the melt pond fraction and depth calculated using the topographic melt pond model of Flocco et al. (2010). The freezing point of the ocean is dependent on the local salinity. Ridley et al. (2018) describe tests of GSI8.1 within the context of the GC3.1 coupled model (Williams et al., 2017). In the coupled configuration the sea ice thermodynamics calculation is split, with the internal sea ice thermodynamics being solved in CICE but the surface energy balance solved in the land surface model JULES as described by West et al. (2016). For the forced experiments described in this paper, the sea ice thermodynamics and radiative transfer are solved entirely within the sea ice model component. The CICE default (CCSM3) radiation scheme is used which has been modified to include topographic melt ponds in the same manner as described in Ridley et al. (2018). The CCSM3 radiation scheme in CICE is analogous to the JULES scheme used in the coupled model (Ridley et al., 2018) except that penetration of solar radiation into bare ice is included and, to account for internal scattering, the bare ice albedo is increased as outlined in Sect. 4.6 below.
While the ocean model is solved on the Arakawa C-grid, (Arakawa, 1966), the sea ice model is solved on the Arakawa B-grid, with the tracer points of the two grids aligned with each other. An interpolation routine is used to couple ocean and ice velocities. To avoid issues related to the difference in model grids, single point inlets were filled-in around Antarctica in all three resolutions. As in the coupled model, the ice and ocean components are combined into a single executable, avoiding the need for a coupler.
2.6 Model performance
The GO6 models were run on the Met Office Cray XC40 supercomputing facility and the joint Met Office – NERC MONSooN collaboration service. The ORCA1 configuration with a time step of 2700 s runs one model year in 80 min on 224 cores of the XC40 with 32 of these cores dedicated to postprocessing diagnostic output using the NEMO XIOS module. The ORCA025 configuration with a time step of 1350 s runs one model year in 12 h on 486 cores of the XC40, with 6 of these cores dedicated to XIOS. The ORCA12 configuration with a time step of 300 s runs one model year in 50 h on 6237 cores of the XC40, with 72 cores dedicated to XIOS. The XIOS cores are spread over 12 depopulated nodes with only 6 cores used on each node. The NEMO code includes an option referred to as “land suppression” (Madec, 2016), which excludes much of the global land area from the calculations. For the performance figures quoted here, the land suppression option was only used for ORCA12. These figures are for integrations which output the full ocean diagnostic requirement for CMIP6 (Eyring et al., 2016).
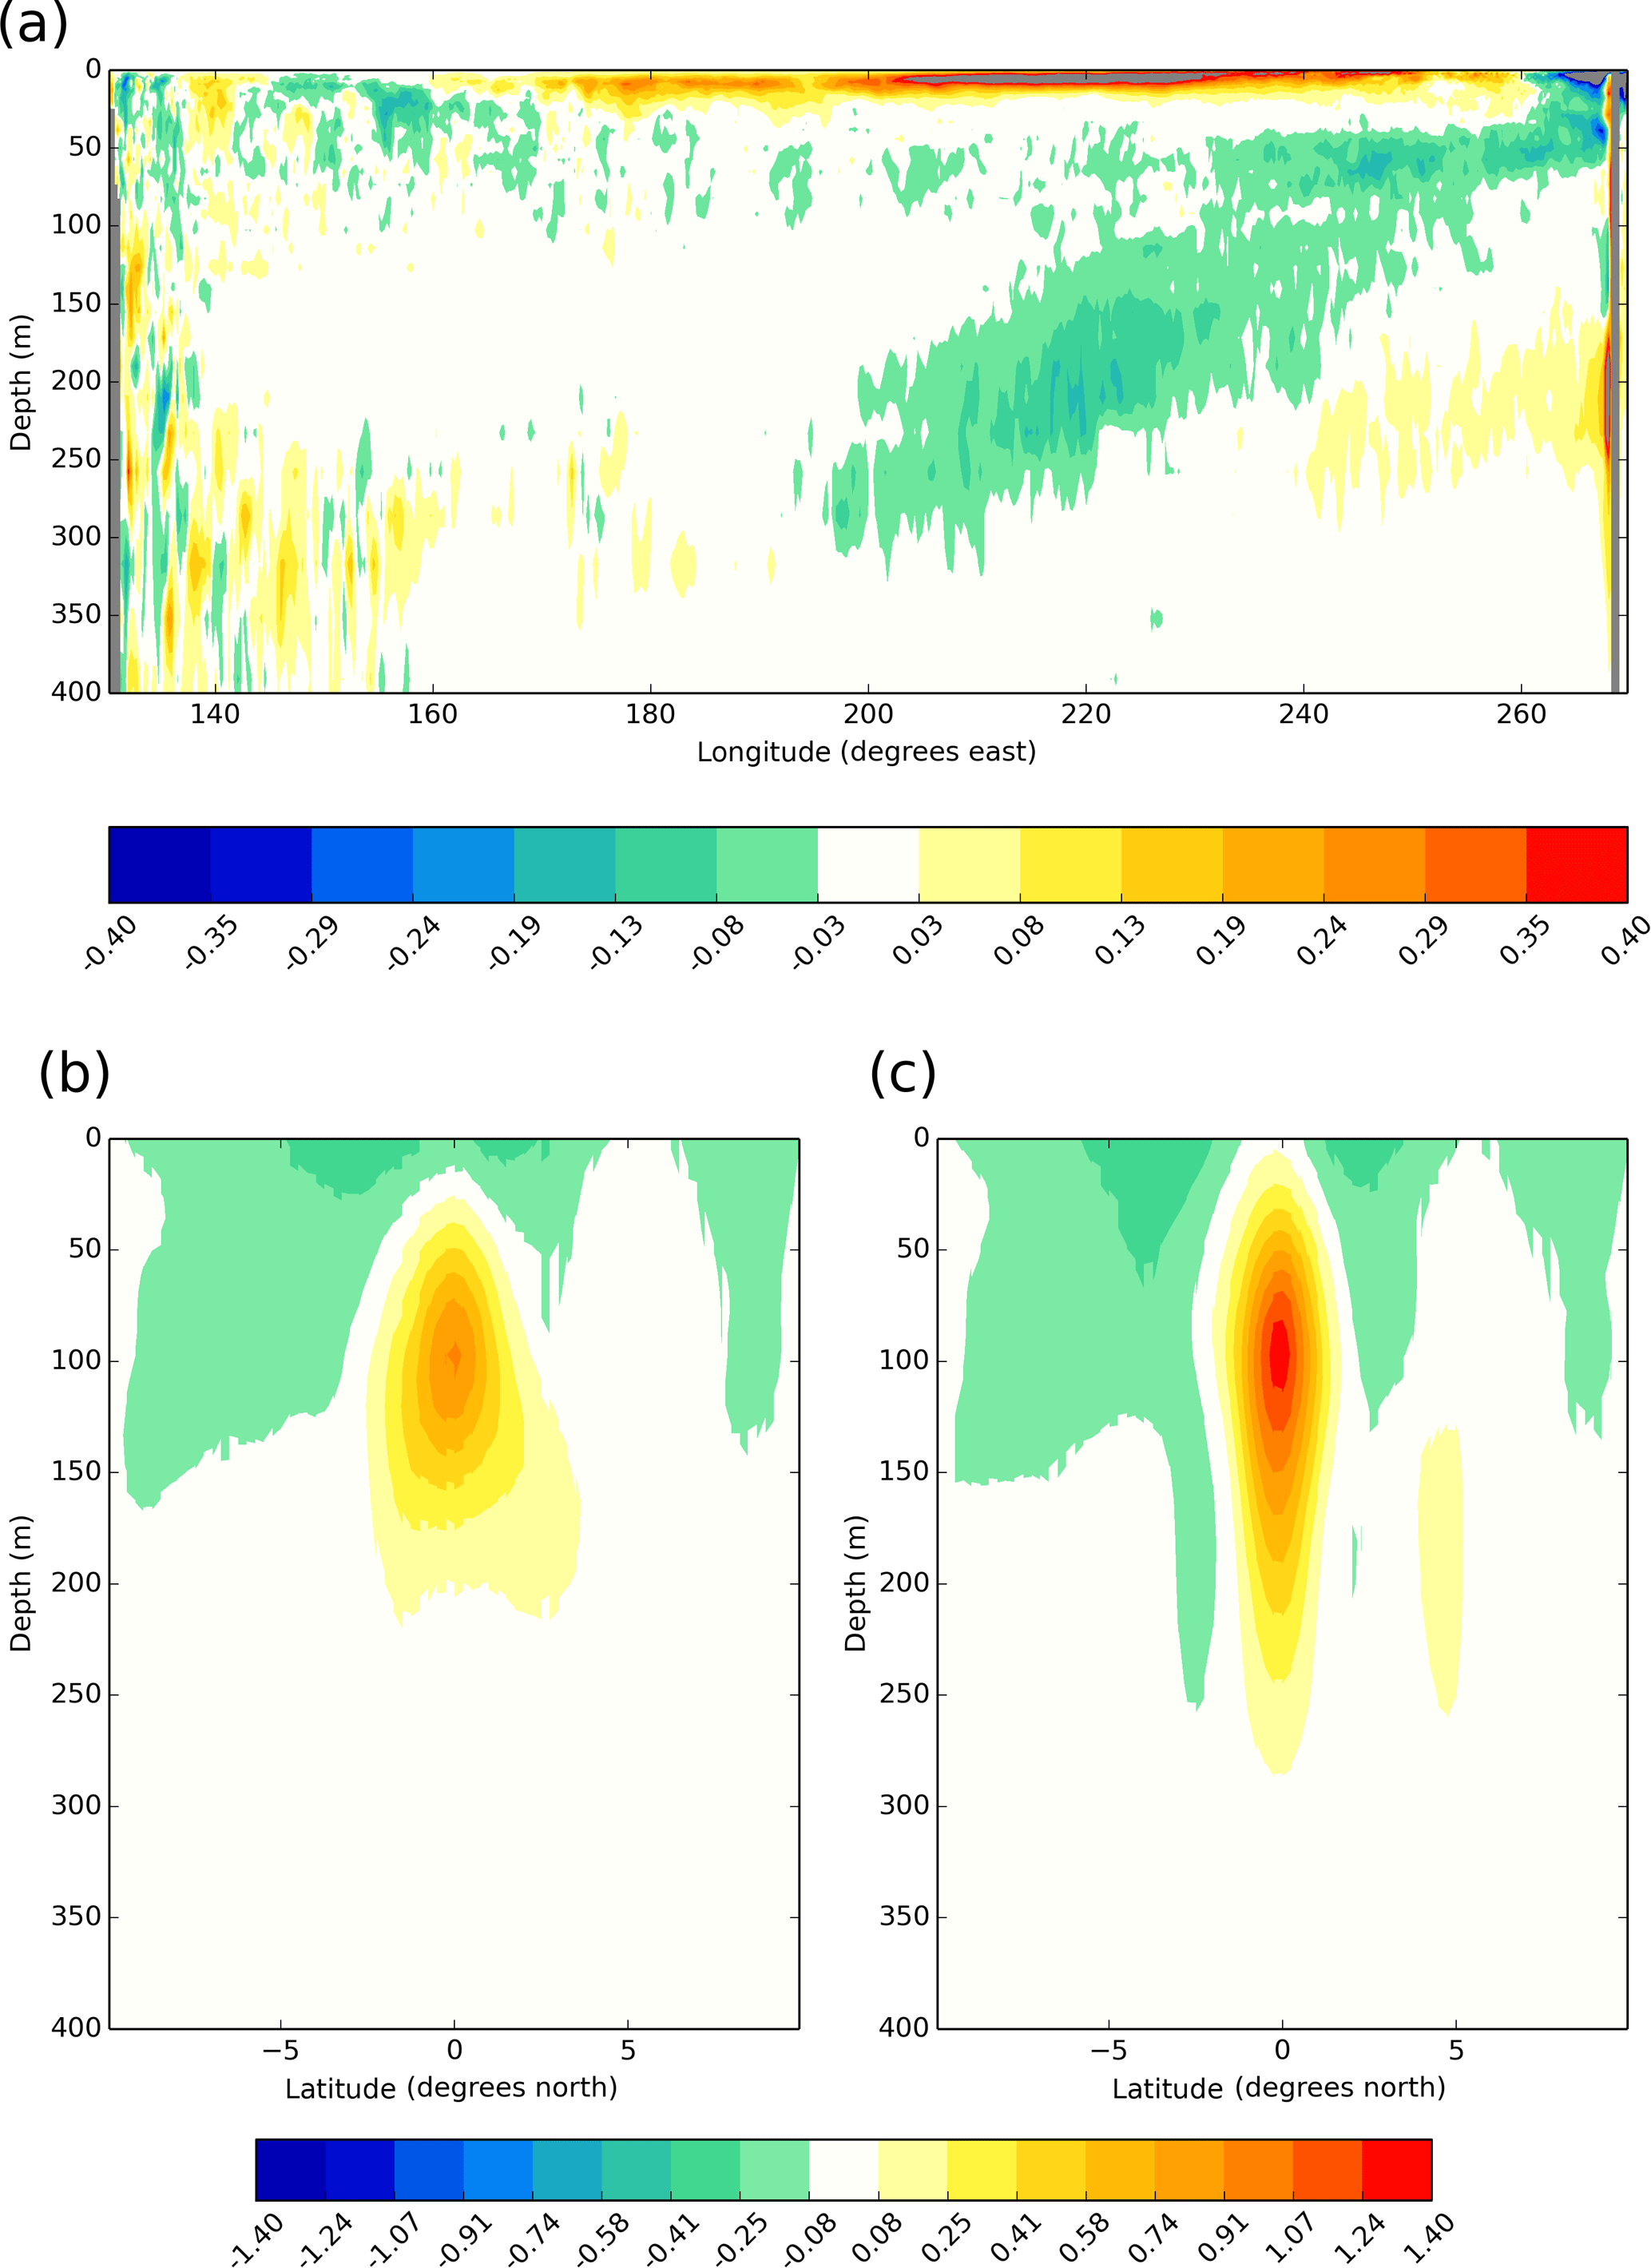
Figure 1Figure showing the impact of turning on the Hollingsworth et al. (1983) scheme for momentum advection: (a) cross section along the Equator in the Pacific of the difference between experiment and control of the diagnosed vertical tracer diffusivity (m2 s−1) from the TKE scheme; (b, c) cross sections of zonal velocity (m s−1) at 136∘ W in the Pacific, (b) without Hollingsworth, (c) with Hollingsworth. Model fields are 5-year means from the second 5 years of a 10-year spin-up.
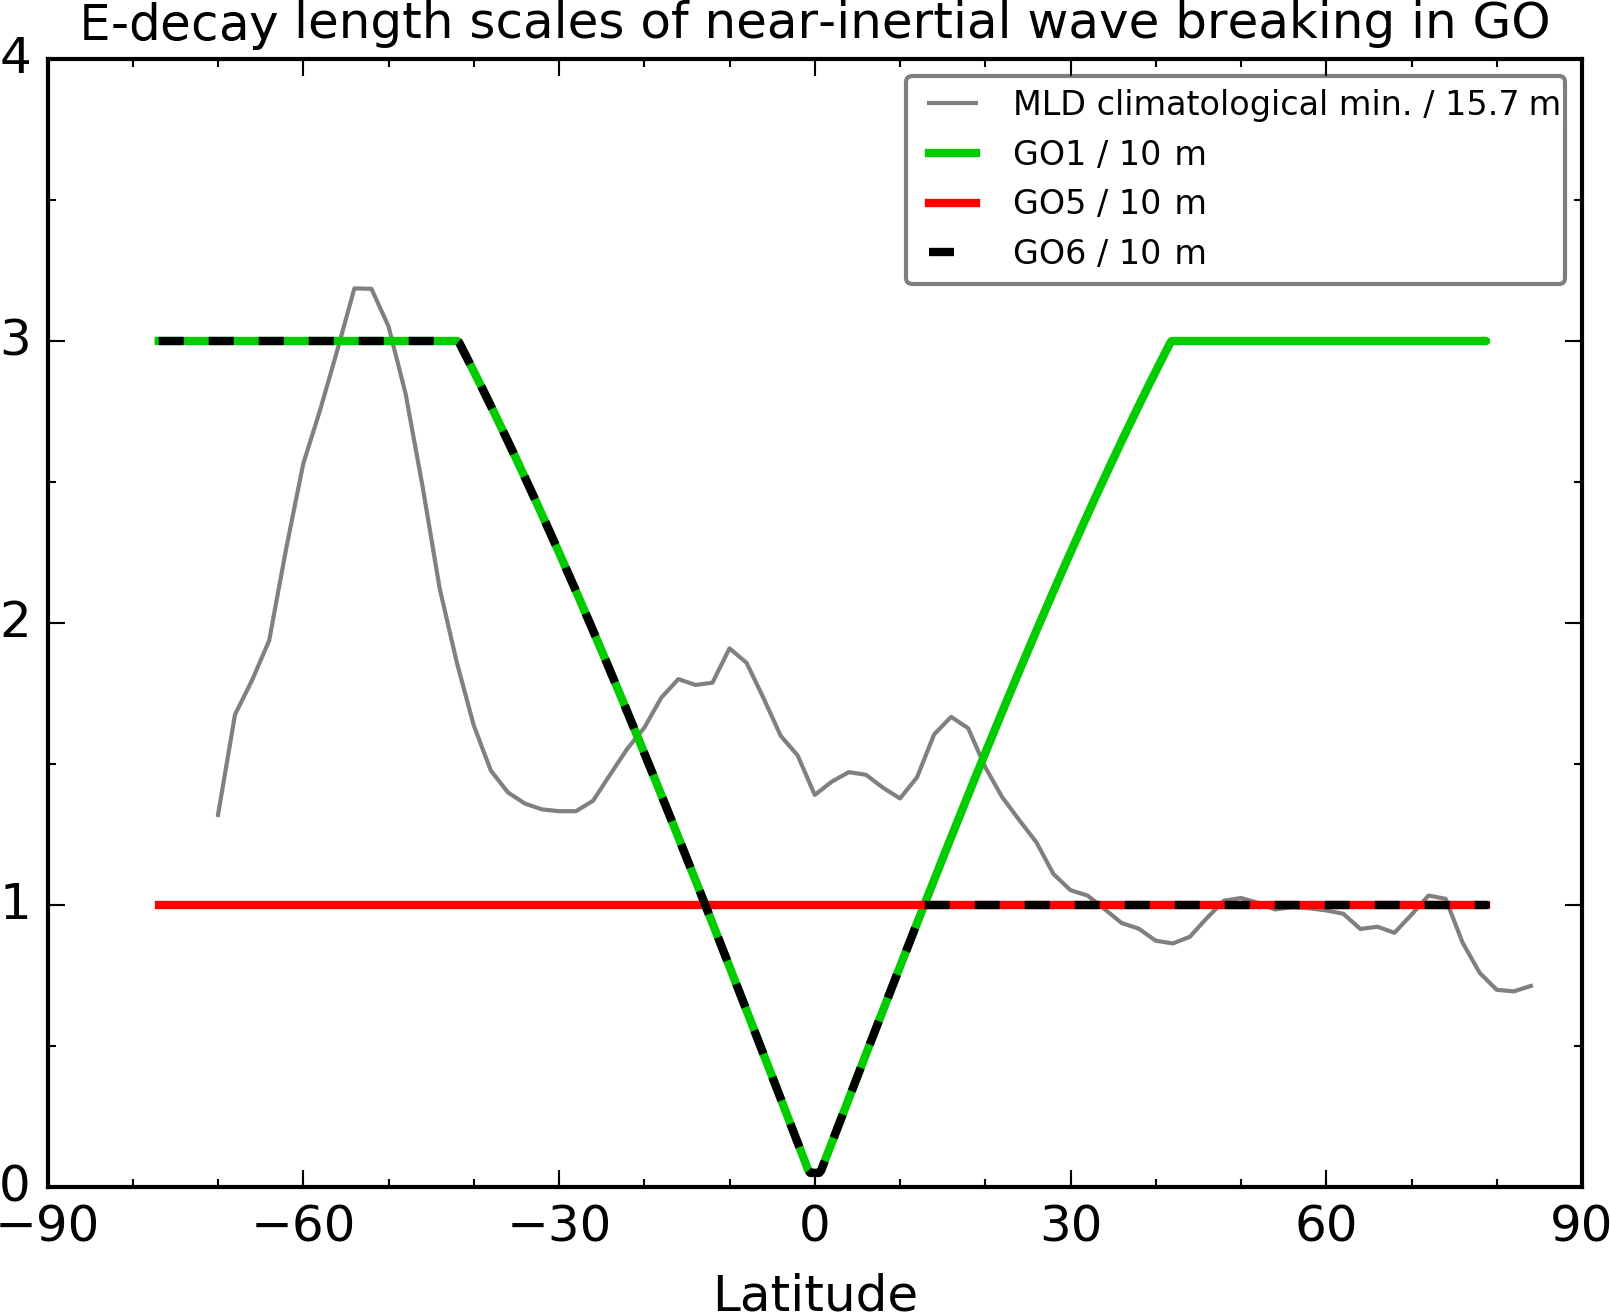
Figure 2Figure showing the variation in the nn_htau length scale with latitude for different GO configurations. This length scale controls the depth of the additional near-surface mixing added by the Rodgers et al. (2014) parameterization as described in Sect. 2.3. The length scale is normalized by 10 m. Also shown as a grey line is the zonal-mean monthly minimum mixed layer depth from the de Boyer Montégut et al. (2004) climatology. This has been normalized by 15.7 m.
For the forced experiments described in this paper, GO6 was driven over the period 1976–2005 by the CORE2 surface forcing data set (Large and Yeager, 2009). The bulk formulae proposed by Large and Yeager (2009) are used to calculate turbulent flux transfer coefficients. Wind stresses are calculated as the relative stress between the wind and the ocean current. An artificial diurnal cycle is imposed on the daily mean shortwave fluxes such that the total incident energy is unchanged.
A restoring fresh water flux is applied to restore the sea surface salinity (SSS) towards monthly mean climatological values. In common with many global ocean models this is necessary to avoid large drifts in the salinity and overturning circulation. The retroaction coefficient used is −33.333 mm day−1 psu−1, corresponding to a piston velocity of about 50 m per 4 years, which Griffies et al. (2009) describe as weak restoring.
A climatological monthly runoff field derived by Bourdalle-Badie and Treguier (2006) from the Dai and Trenberth (2002) climatology is applied. The Lagrangian iceberg scheme is fed with a seasonal climatology of glacial accumulation at the shore due to Marsh et al. (2015). The parameterization of ice shelf basal melt around Antarctica uses climatological data from Rignot et al. (2013).
Initial conditions for temperature and salinity are obtained from monthly climatologies based on the “EN” reanalyses. For the comparison of GO6 and GO5 on the grid in Sect. 5, the initial conditions are from a climatology based on the EN3 monthly objective analysis (Ingleby and Huddleston, 2007), years 2004–2008. For other results presented in this paper, the initial conditions were from a climatology based on the years 1995–2014 from the more recent EN4 objective analysis (Good et al., 2013). In all cases the model is spun-up from a state of rest. The initial conditions for the sea ice were taken from a time-mean of 20 years of January-mean fields from a present-day forcing integration of the GC2 coupled model (Williams et al., 2015).
In this section, we describe in more detail the model changes between GO5 and GO6/GO7 and present results of sensitivity experiments showing the impact of individual changes. The integrations for sensitivity tests were often shorter than the 30-year test performed for the GO6–GO5 comparison; details for each set of results are noted in the figure captions.
4.1 NEMO version upgrade and nonlinear free surface
The version of the NEMO base code has been upgraded from NEMO 3.4 to NEMO 3.6 which was released in 2015. Among the new features available for NEMO 3.6 (compared to 3.4) are the Hollingsworth et al. (1983) formulation for momentum advection, the Lagrangian icebergs scheme and the ability to simulate the circulation beneath ice shelves. The first two of these are activated in GO6 and are discussed in Sects. 4.2 and 4.5. Testing of the under-ice-shelf functionality is described in Sect. 7.
GO5 employed a linear free surface in which the volume of the ocean remains constant and the surface fresh water flux is represented as a virtual salt flux (Roullet and Madec, 2000). For GO6 we switch to the nonlinear free surface in which the volume of the ocean grid cells throughout the water column is allowed to vary with time (the z* coordinate of Adcroft and Campin, 2004). This has the advantage that the fresh water flux at the surface can be represented accurately. It is also a prerequisite for the future inclusion of tides in the global model.
Both the upgrade to the base code version and the switch to the nonlinear free surface have been tested in separate sensitivity experiments and have been shown to have small impacts on the large-scale simulated climate (not shown).
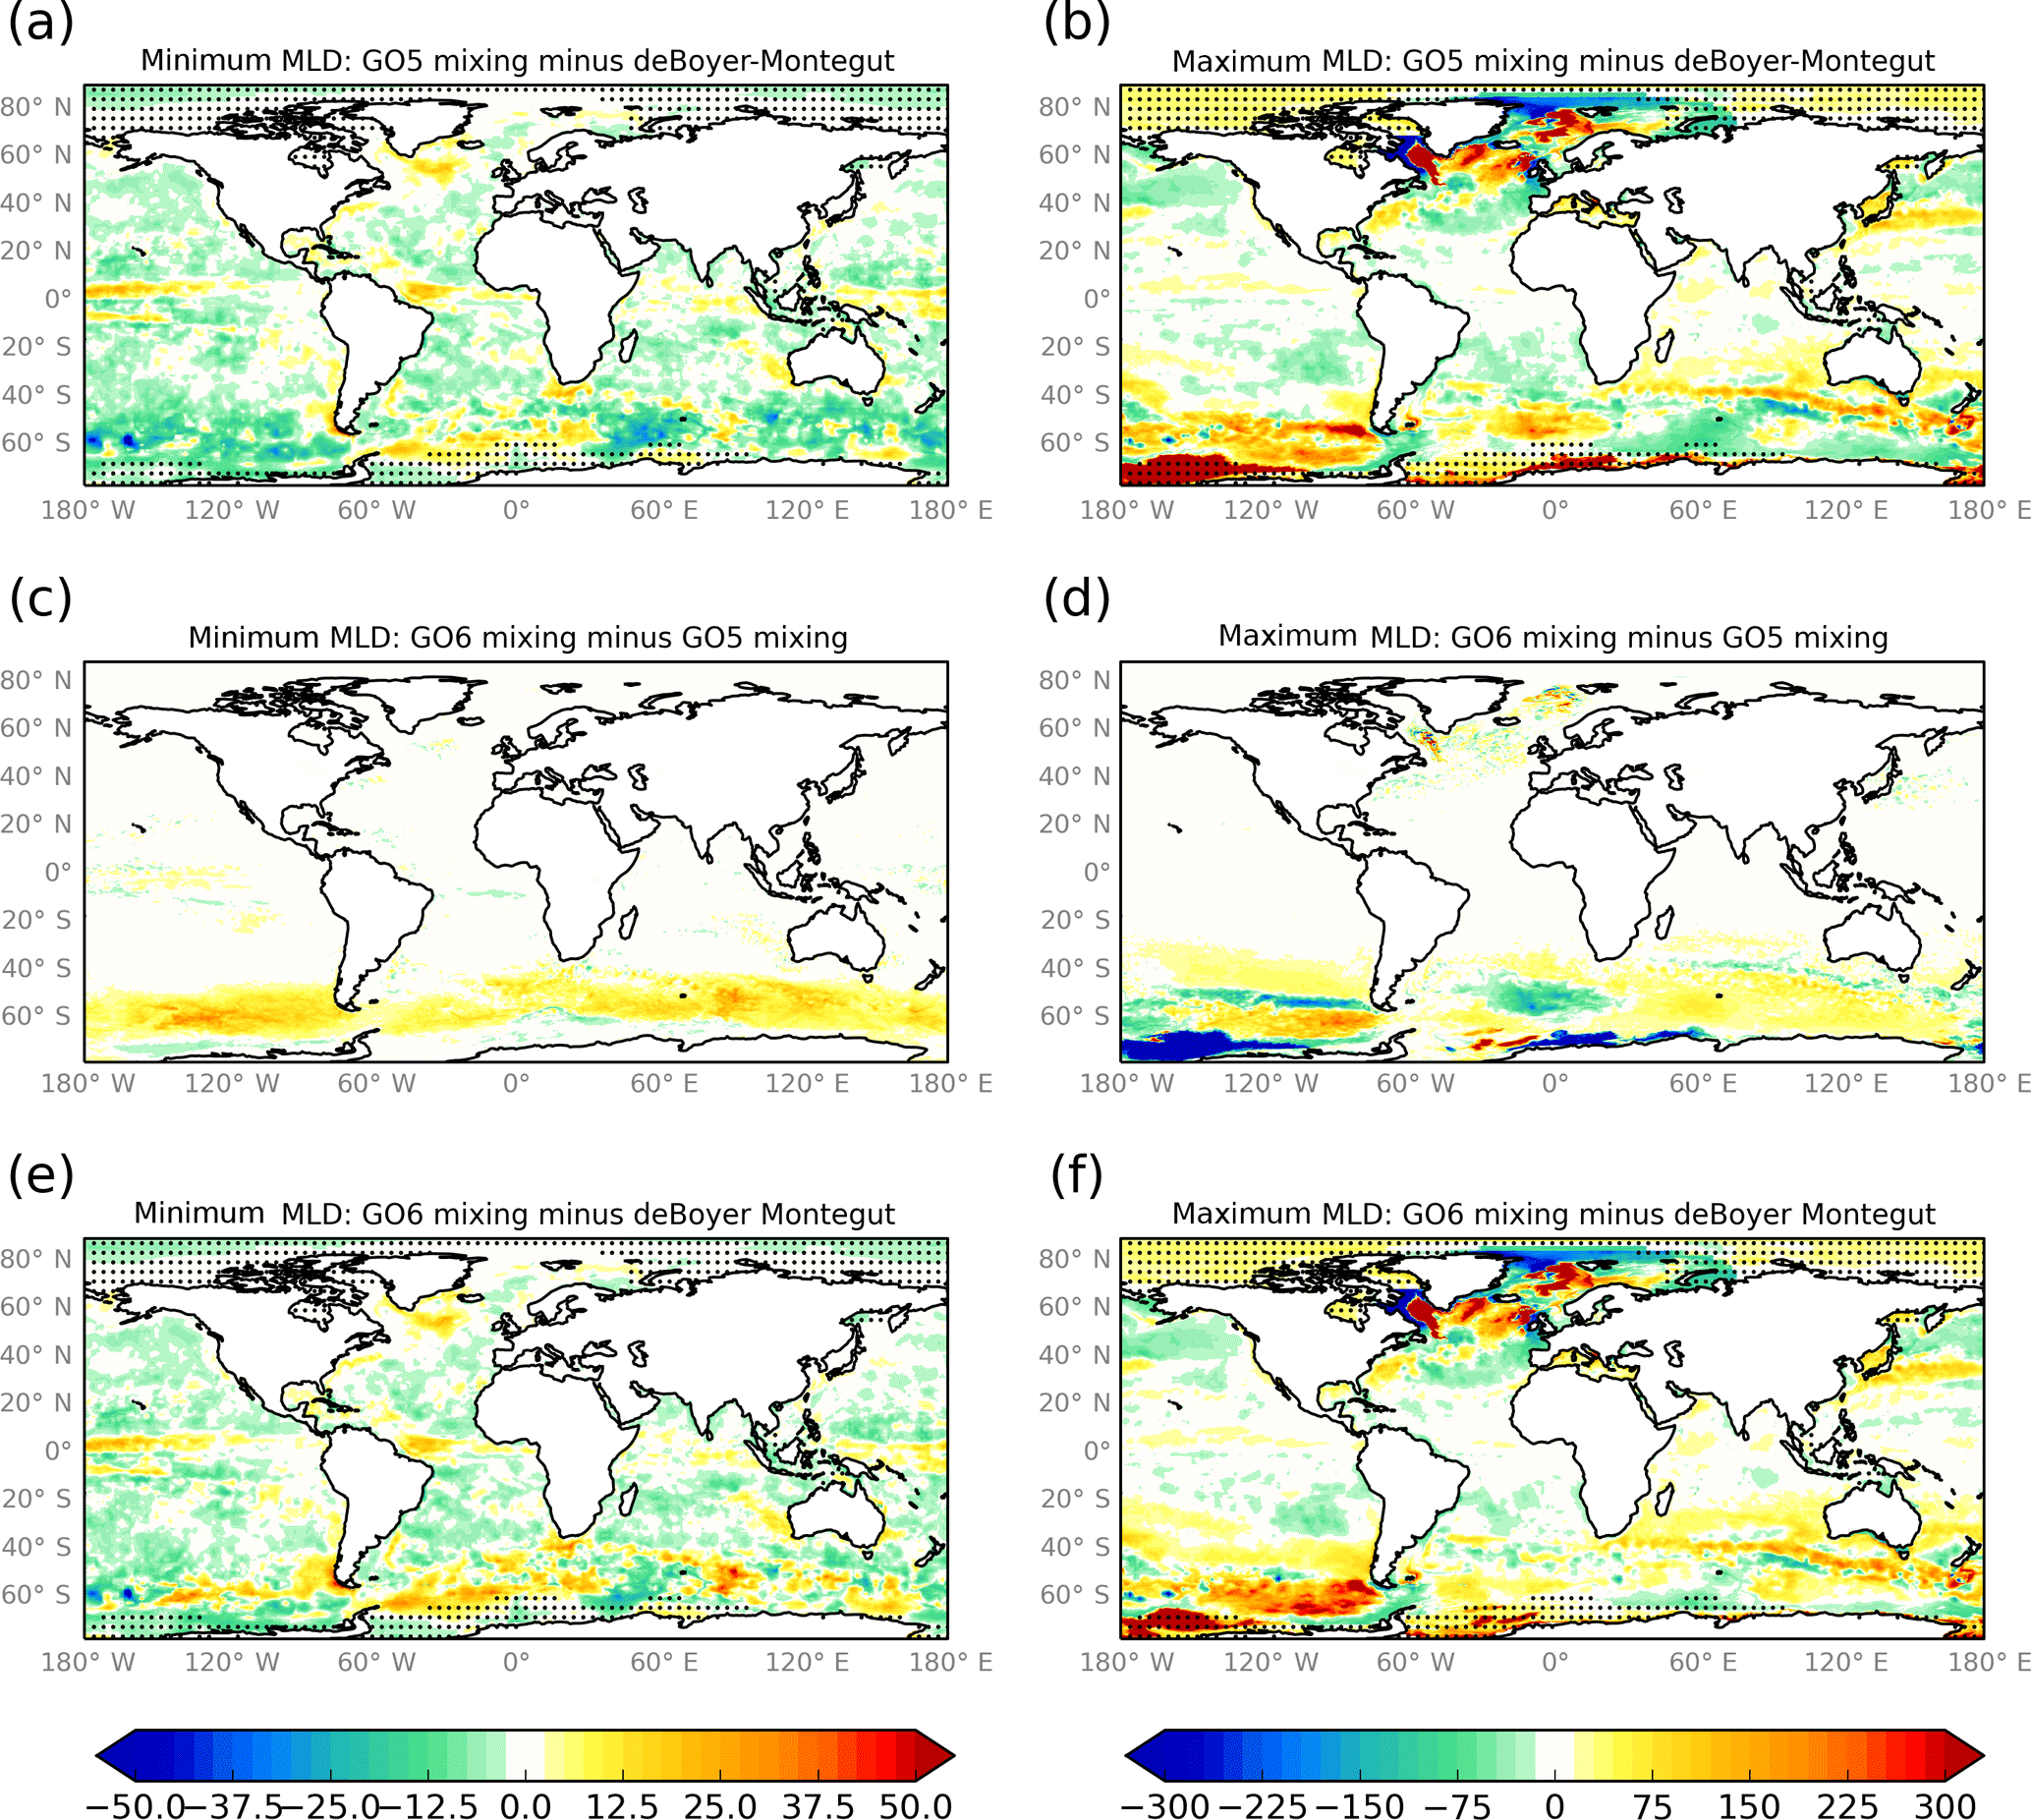
Figure 3Results from a sensitivity study where the nn_htau length scale was tuned (see Sect. 4.3). A mean monthly climatology of the mixed layer depth field in metres was calculated for the third decade of the spin-up (1996–2005). The point-wise minimum and maximum monthly values have then been calculated and plotted as anomalies against the same quantities from the de Boyer Montégut et al. (2004) climatology and as difference fields between the GO5 and GO6 mixing choices. Hashed regions indicate the presence of sea ice at any time during the year.
4.2 Improved formulation of momentum advection
Hollingsworth et al. (1983) describe a computational symmetric instability associated with the vector-invariant form of the momentum equations due to Arakawa and Lamb (1981). They also provide a modified formulation for the kinetic energy divergence term which prevents the instability arising. This formulation is available in NEMO from version 3.6 and has been selected in the GO6 configuration. Ducousso et al. (2017) tested the new formulation in ORCA025 and found impacts in the most active regions of the model. In particular they found that the new formulation produced a more realistic representation of the equatorial current system in the east Pacific with a stronger and better-defined equatorial undercurrent and increased eddy kinetic energy.
Sensitivity experiments with the GO6 configuration have shown results that are consistent with Ducousso et al. (2017). Figure 1a shows the impact of turning on the Hollingsworth et al. (1983) formulation on the time-mean vertical diffusivity from the TKE scheme. Particularly noticeable is a reduction in the vertical mixing in the thermocline between about 100 and 300 m in the eastern Pacific. (There is also a reduction in the subsurface mixing in the equatorial Indian Ocean – not shown.) The reduction in mixing results in an increase in the strength of the equatorial undercurrent as shown in Fig. 1b and c, which show cross sections of the zonal currents at 136∘ W. The equatorial undercurrent (EUC) is substantially stronger in the integration with the Hollingsworth et al. formulation and extends deeper to 250 m. Comparison with the in situ cruise data presented in Fig. 1 of Wang (2005) shows that the shape and vertical extent of the EUC with the new formulation appears to be a better match to observations, although the jet is now too strong (1.3 m s−1 as opposed to about 0.9 m s−1 in the observations).
4.3 Tuning of near-surface mixing
In GO5 a number of parameters that control vertical mixing were adjusted, based on the sensitivity studies of Calvert and Siddorn (2013). The most significant tuning was to the ad hoc parameterization of near-inertial wave breaking of Rodgers et al. (2014). The e-folding length scale nn_htau, associated with this parameterization can be varied with latitude. In GO5, nn_htau was reduced at mid- and high-latitudes, which reduced over-deep summertime mixed layer biases and cold sea surface temperature (SST) biases. However, the summertime mixed layers in the Southern Ocean were then too shallow compared to climatology (see Fig. 2 of Megann et al., 2014).
Figure 2 shows the choices for the latitudinal dependence of the nn_htau parameter at GO1, GO5 and GO6. Also plotted is the zonal-mean minimum monthly mixed layer depth based on the de Boyer Montégut et al. (2004) climatology. The climatology shows that the summertime mixed layers are on average deeper in the Southern Ocean than in northern mid-latitudes. Based on this and the GO5 results, the nn_htau parameter has been further tuned in GO6 to be deeper in the Southern Hemisphere. The results of a sensitivity experiment comparing the GO5 and GO6 vertical mixing tunings are shown in Fig. 3. The summertime mixed layer depths in the Southern Hemisphere have deepened compared to GO5 and are now a better match for the de Boyer Montégut et al. (2004) climatology. This reduces a summertime warm bias in the SST (not shown) which then has a major impact on the sea ice (see Fig. 4b), increasing the total volume of sea ice in the Southern Ocean year-round. The increase in the volume of sea ice is substantial, particularly in the austral winter, and is partly due to the suppression of open ocean polynyas in the Weddell Sea. The suppression of the polynyas then shallows the winter time mixed layer depths under the ice as is evident in Fig. 3d.
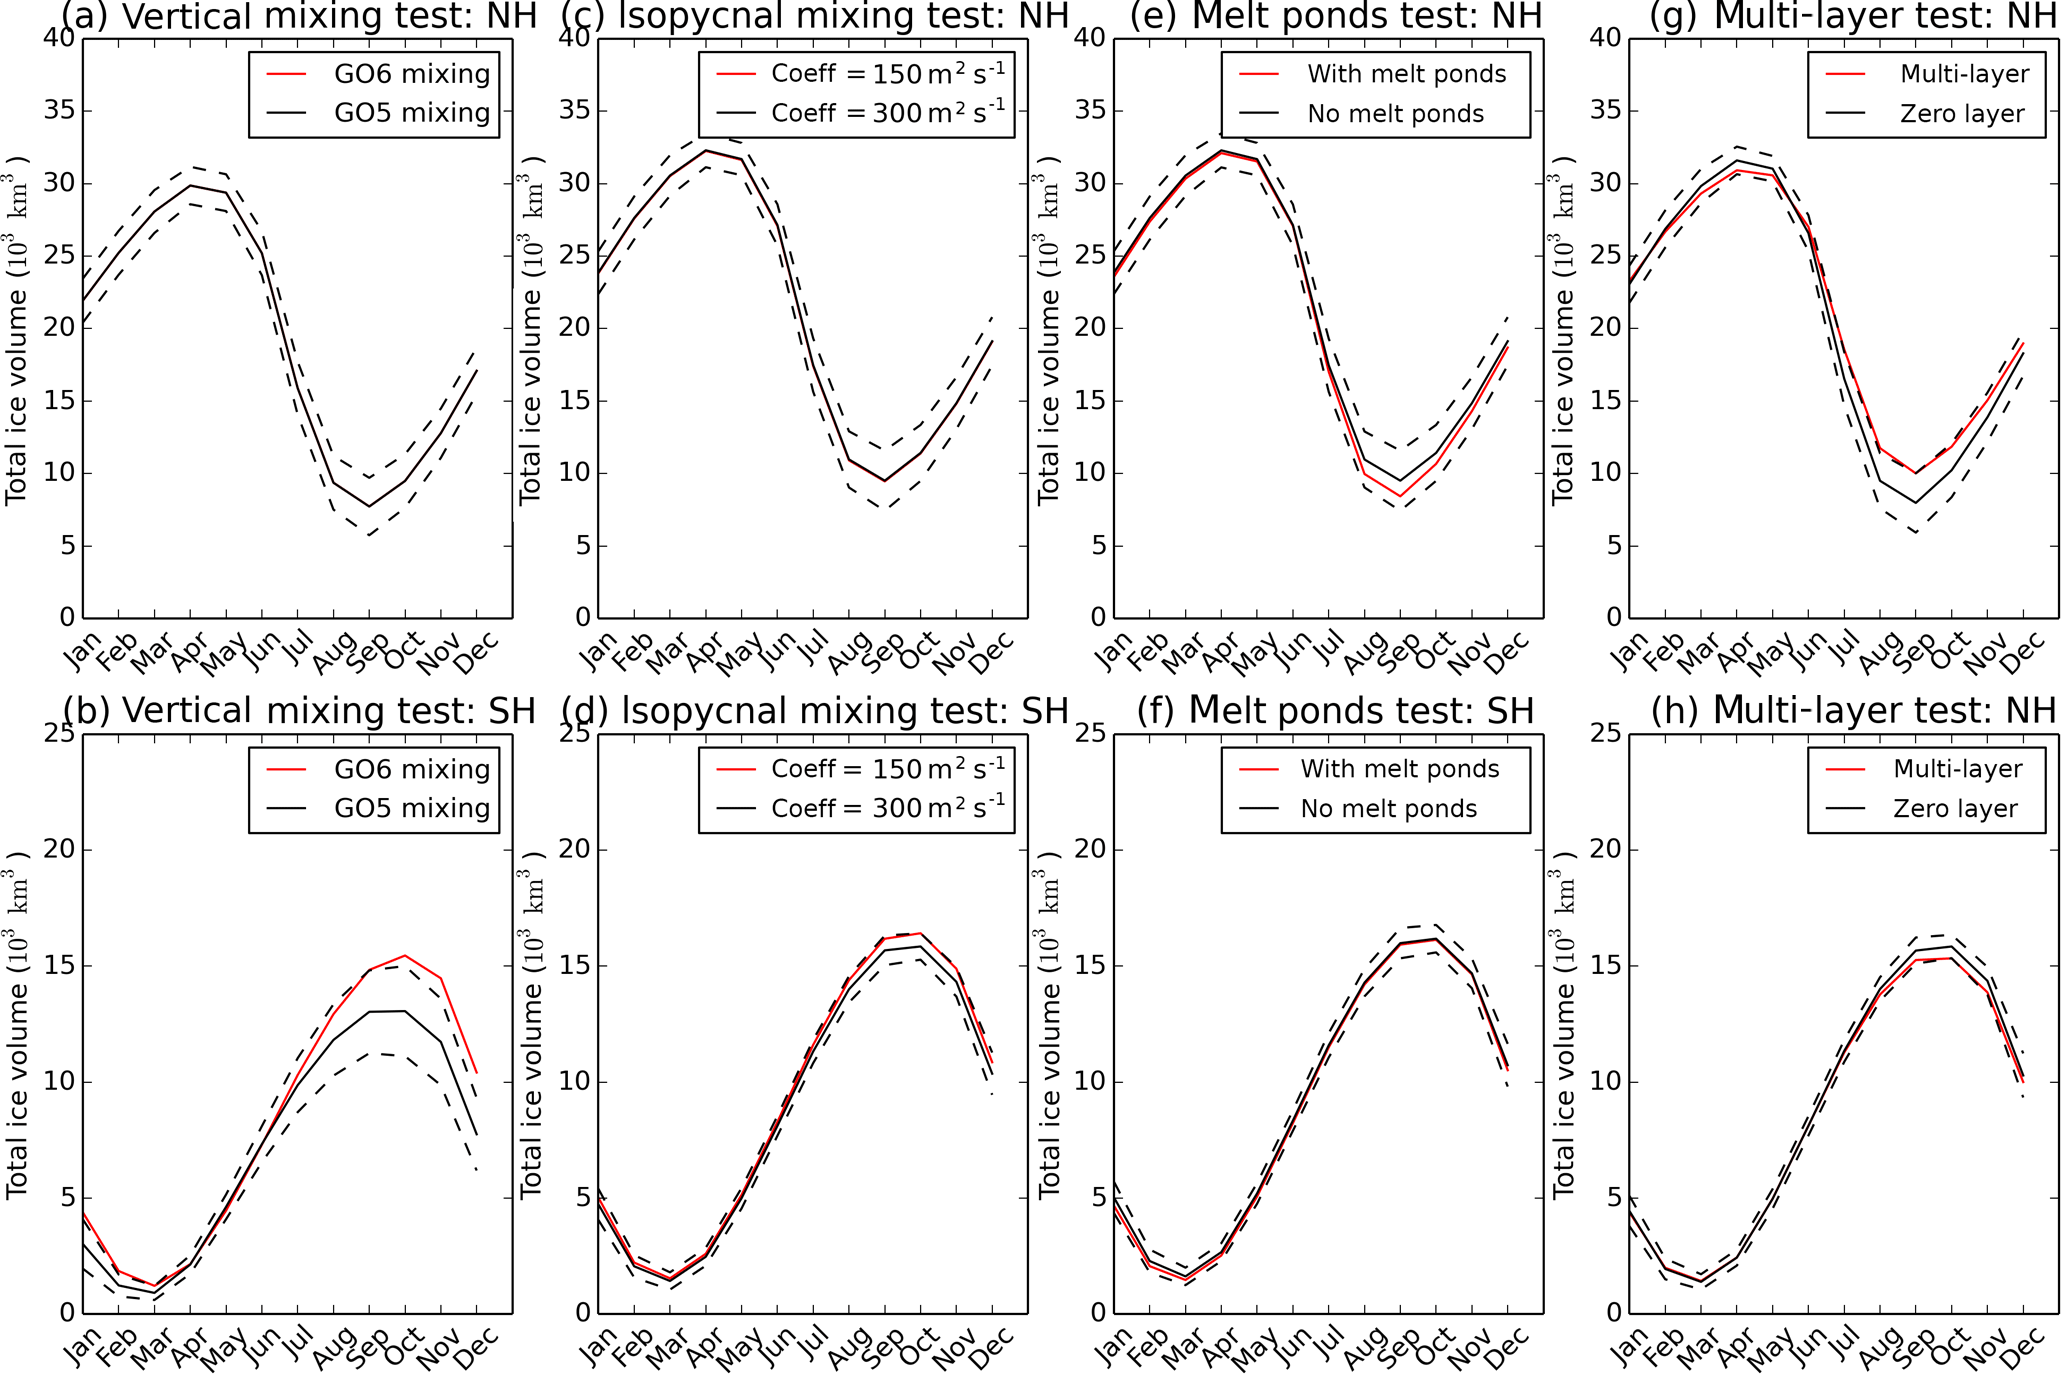
Figure 4Plots showing the mean seasonal cycle of integrated sea volume in Northern (NH) and Southern (SH) hemispheres for four sensitivity experiments: (a, b) tuning of near-surface vertical mixing; (c, d) tuning of isopycnal mixing coefficient; (e, f) introduction of explicit calculation of the impact of melt ponds on albedo versus a simple temperature-dependent albedo; (g, h) introduction of multi-layer thermodynamics versus zero-layer thermodynamics. In all cases the results with the GO6 settings are in red and with the GO5 settings in black. The dashed lines show the standard deviation of the annual mean values for the control integration in each case.
As discussed further in Sect. 8, we regard the use of the Rodgers et al. (2014) scheme as a stopgap solution to the problem of underestimated mixing processes in the model and plan to move to a more physically based parameterization of these processes in future versions of the model.
4.4 Reduced isopycnal diffusion
Met Office coupled models based on GO1 and GO5 have a long-standing warm SST bias in the Southern Ocean which has recently been substantially improved (Williams et al., 2017). This has been largely attributed to atmospheric biases, particularly in the representation of clouds. However, as part of ongoing work to reduce this bias, the isopycnal diffusion parameter in the ocean was also tuned. Isopycnal diffusion by eddies is responsible for moving heat from depth to the ocean surface (Griffies et al., 2015), especially in the Southern Ocean. So a reduction in the isopycnal diffusion parameter might be expected to cool the surface.

Figure 5SST anomalies and experiment-minus-control differences from sensitivity tests of halving the isopycnal diffusion parameter (from 300 to 150 m2 s−1) in: (a, b) the Met Office GC3 coupled configuration (Williams et al., 2017); and (c, d) the forced GO6 configuration. Anomalies are calculated against ESA CCI (Merchant et al., 2014). Model mean fields are calculated over the final 10 years of 30-year spin-up integrations. The coupled model tests used present-day climate forcing. Note the different contour scales in the coupled and forced tests.
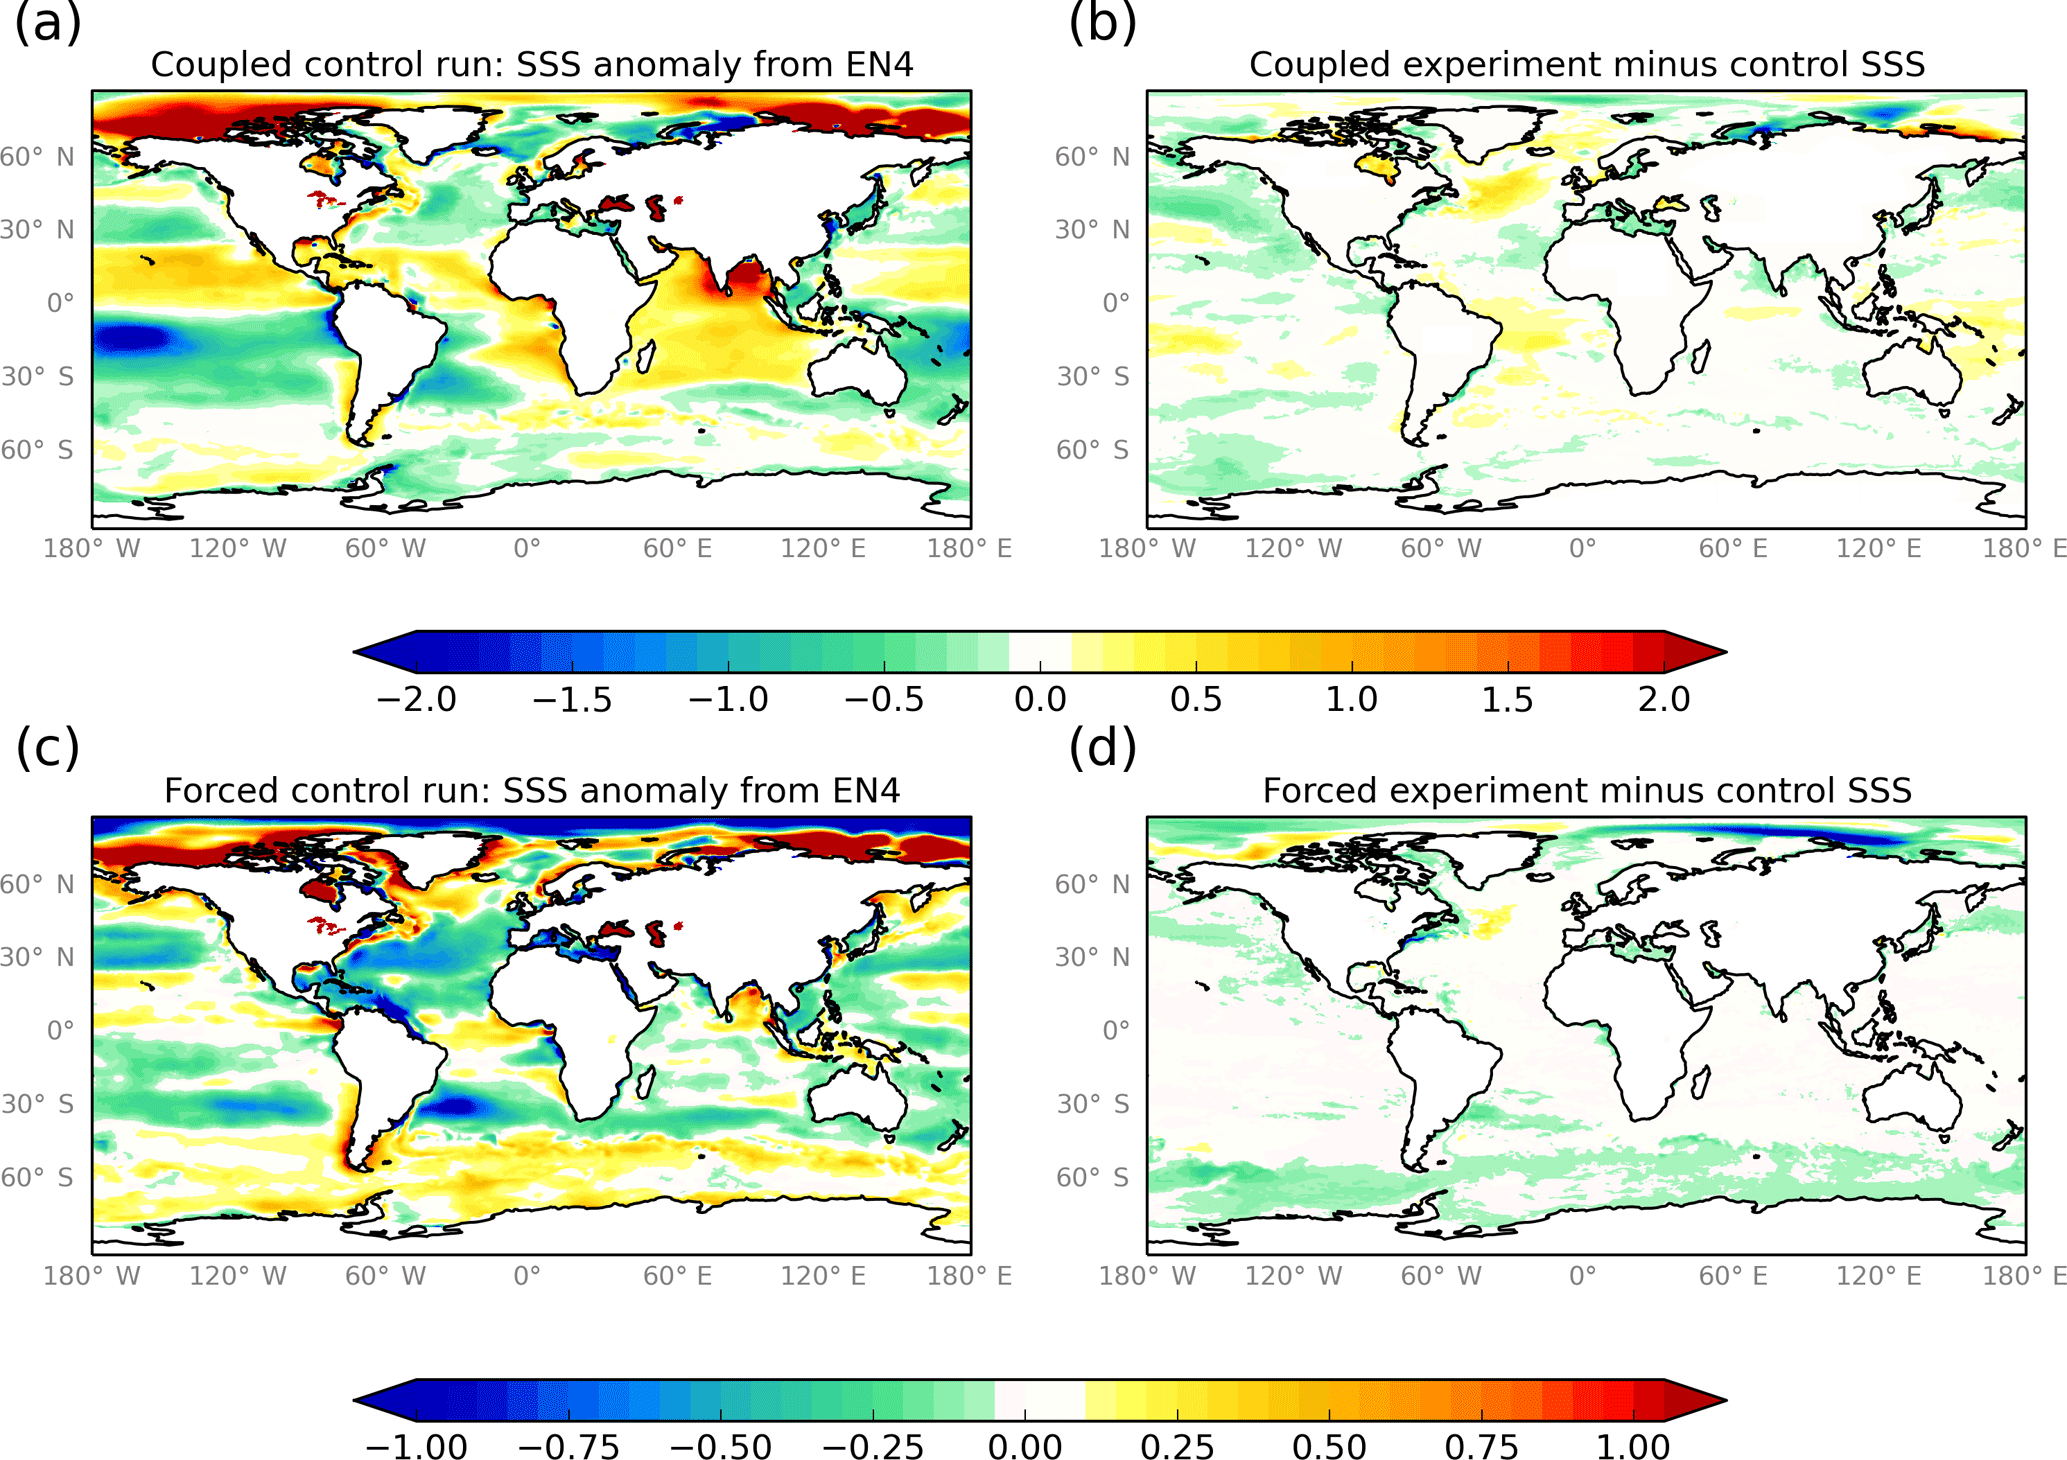
Figure 6As for Fig. 5 but for sea surface salinity (SSS, psu). Anomalies are against the EN4 analysis (Good et al., 2013). Note the different contour scales for the coupled and forced tests.
Figures 5 and 6 show the results from sensitivity tests in which the isopycnal diffusion parameter has been reduced from the GO5 value of 300 m2 s−1 to the GO6 value of 150 m2 s−1. Tests were performed with the Met Office GC3.1 coupled model (Williams et al., 2017) and the forced GO6 configuration. As discussed in Sect. 8, because of the different surface boundary condition and different atmospheric forcing errors, the biases will generally be different in the coupled and forced contexts. The reduction in the isopycnal diffusion parameter cools the SST in the Southern Ocean in the coupled experiment and largely acts to reduce the warm biases there. There is a slight warming of SSTs in the Northern Hemisphere which also acts to reduce biases. In the forced test, there is some cooling of the SST in the Southern Ocean, particularly near the Ross Sea which also reduces a warm bias there. There is a dipole signature in the North Atlantic with a warming of the southern subpolar gyre and a cooling further west, which tends to exacerbate existing biases. The impact on the SSS in the coupled model is mixed, with some freshening in the Southern Ocean near the Ross Sea. In the forced model there is a more systematic freshening of the surface in the Southern Ocean which largely acts to correct a saline bias. There is also a large-scale freshening of the surface waters in the Arctic. The hydrography changes in the forced test due to the reduction of isopycnal mixing lead to a slight increase in the total volume of wintertime sea ice in the Antarctic (Fig. 4d) but do not affect the total volume of sea ice in the Arctic (Fig. 4c).
4.5 Icebergs and ice shelves
In GO5 the fresh water input from frozen land masses was represented as surface runoff close to the coastlines of Greenland and Antarctica. For Met Office coupled models prior to GC3.0 (e.g. Williams et al., 2015), the fresh water input from Antarctica was spread over a large part of the Southern Ocean south of the Antarctic Circumpolar Current (ACC) in order to crudely represent iceberg melting. In GO6 and in GC3.1, the processes involved in the input of fresh water to the ocean from frozen land masses are modelled more realistically using a Lagrangian iceberg model and a parameterization of ice shelf basal melt. Figure 7 shows the annual mean fresh water input to the ocean from Antarctica using the three methods. In the first two cases the distribution of fresh water input is fixed, but with the interactive icebergs model it will vary depending on the winds and currents.
Marsh et al. (2015) tested the iceberg module in a CORE2-forced ORCA025 integration similar to the one described in this paper. Their control integration put fresh water input as runoff near the coastline, as was done in GO5. They found that one of the main impacts of the icebergs was to suppress sea ice formation near the coast, since less fresh water is put into the ocean there, reducing stratification and warming the surface layers. With less sea ice formation there was less sea ice overall and a widespread salinification of the surface waters in the Southern Ocean due to reduced melting offshore. We find a similar impact on the sea ice fraction (Fig. 8a) and the surface salinity (Fig. 8b). Megann et al. (2014) show that compared to a climatology of the HadISST analysis (Rayner et al., 2003), the sea ice extent in GO5 was realistic in the austral winter but too low in the austral summer. Therefore a reduction in the sea ice due to the inclusion of the icebergs scheme is likely to reduce the realism of the sea ice simulation. However, the modelling of the fresh water distribution due to the icebergs is more realistic, and as discussed in Sect. 5.2, the reduction in sea ice due to the inclusion of the icebergs scheme is more than offset by the increase in sea ice due to the vertical mixing changes.
Merino et al. (2016) tested a modified version of this iceberg model in NEMO and found a freshening of the surface layers and increased sea ice due to the input of iceberg melt, in contrast to the results described here and in Marsh et al. (2015). However, their control experiment had no representation of iceberg melt water input to the ocean, whereas in our control experiment the iceberg melt water is included near to the coast which stimulates the formation of sea ice near to the coast. The reduction in sea ice (and salinification of the surface layers) that we see is due to the removal of this near-coastal freshwater input and a more realistic distribution due to the Lagrangian icebergs.
As discussed in Sect. 2.4, GO7 has open cavities under the ice shelves, whereas in GO6 the cavities are closed and fresh water is input at the edge of the ice shelves. Mathiot et al. (2017) show that the inclusion of ice shelf basal melt in a model of the Southern Ocean produces circulations on the Antarctic shelves that are absent in simulations where all the fresh water is put in at the surface. They also show that these circulations are similar in models that have the cavities open and models that close the cavities but input the fresh water through depth as in GO6. In particular, the fact that the fresh water is input at depth produces vertical mixing and, on the West Antarctic continental shelf, draws warmer, saltier water from depth to the surface resulting in a reduction in sea ice formation. In Sect. 7 we look at the impact of opening the cavities.
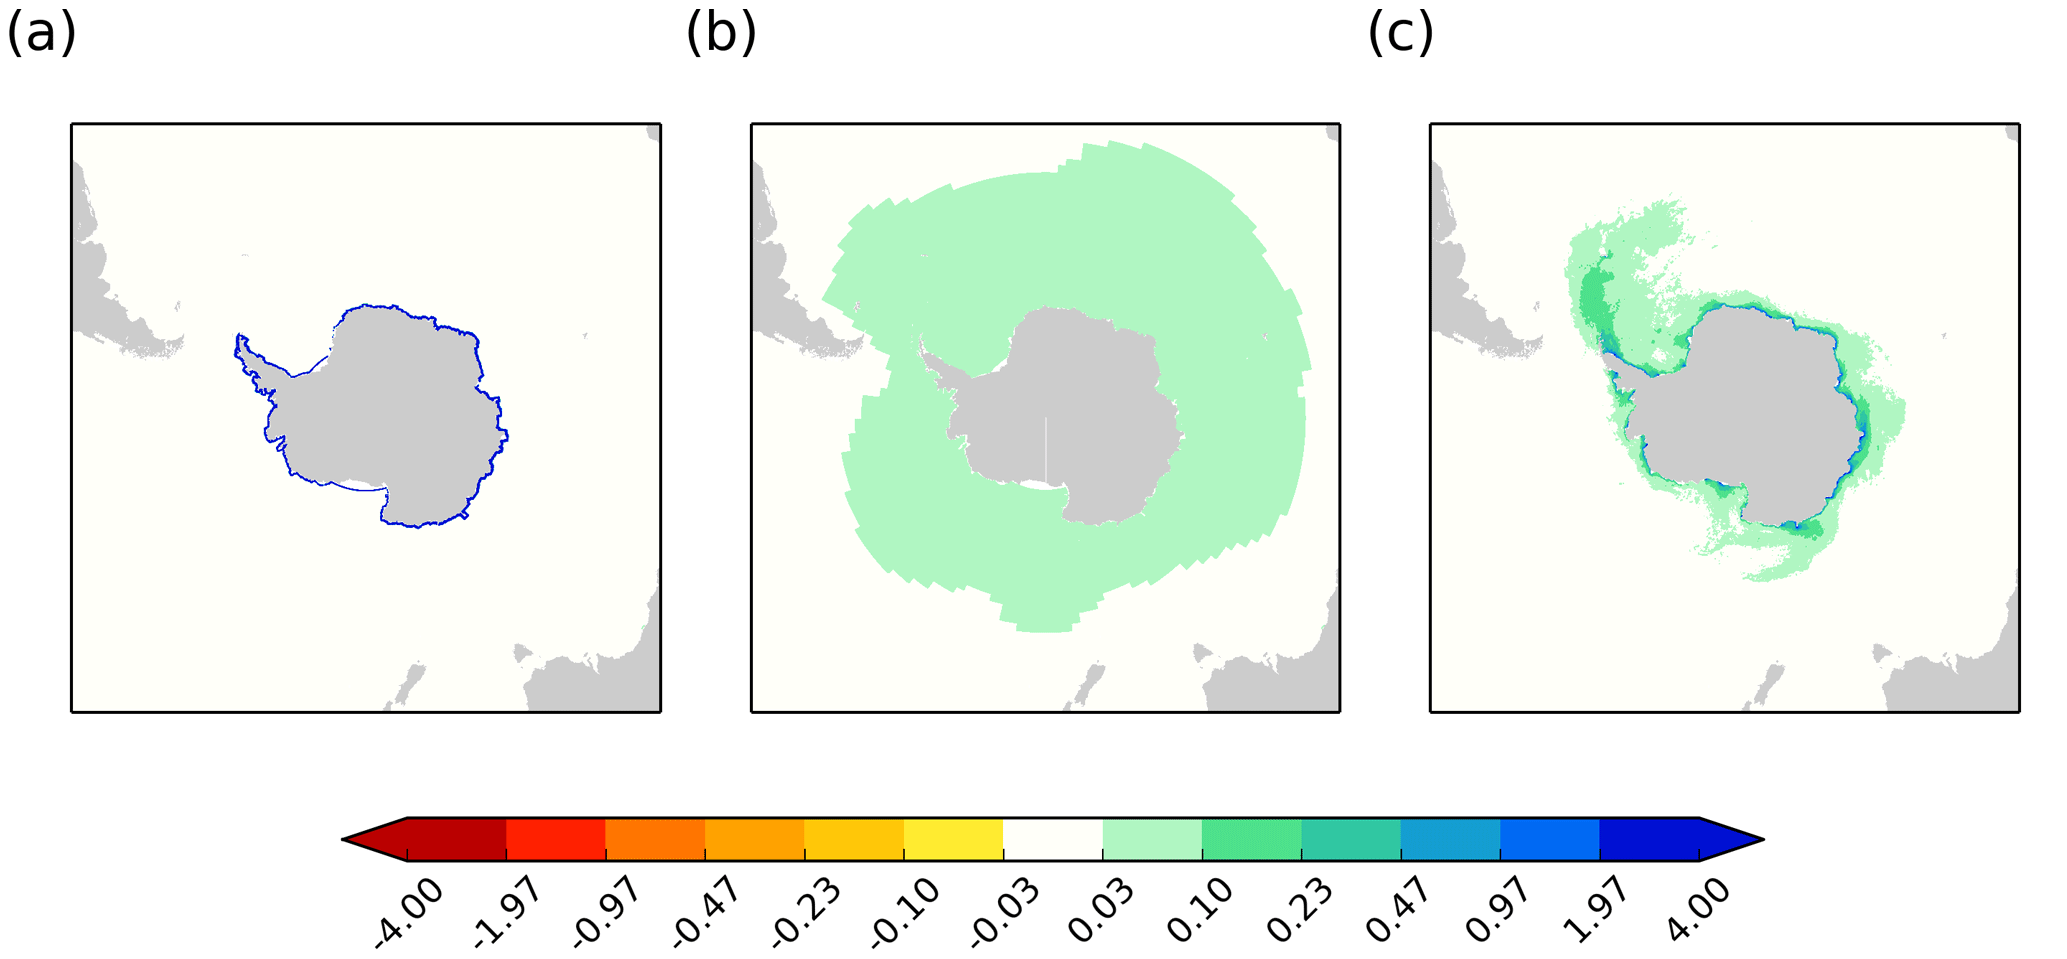
Figure 7Annual mean freshwater input (m yr−1) from Antarctic land mass to ocean: (a) Annual mean freshwater input where freshwater input from Antarctica is represented as runoff close to the coastline; (b) as for (a) but with the freshwater input from Antarctica spread over the Southern Ocean to crudely represent iceberg melt; (c) annual mean freshwater input from Antarctica using the ice shelf parameterization and interactive icebergs scheme. Note the stretched colour scale.
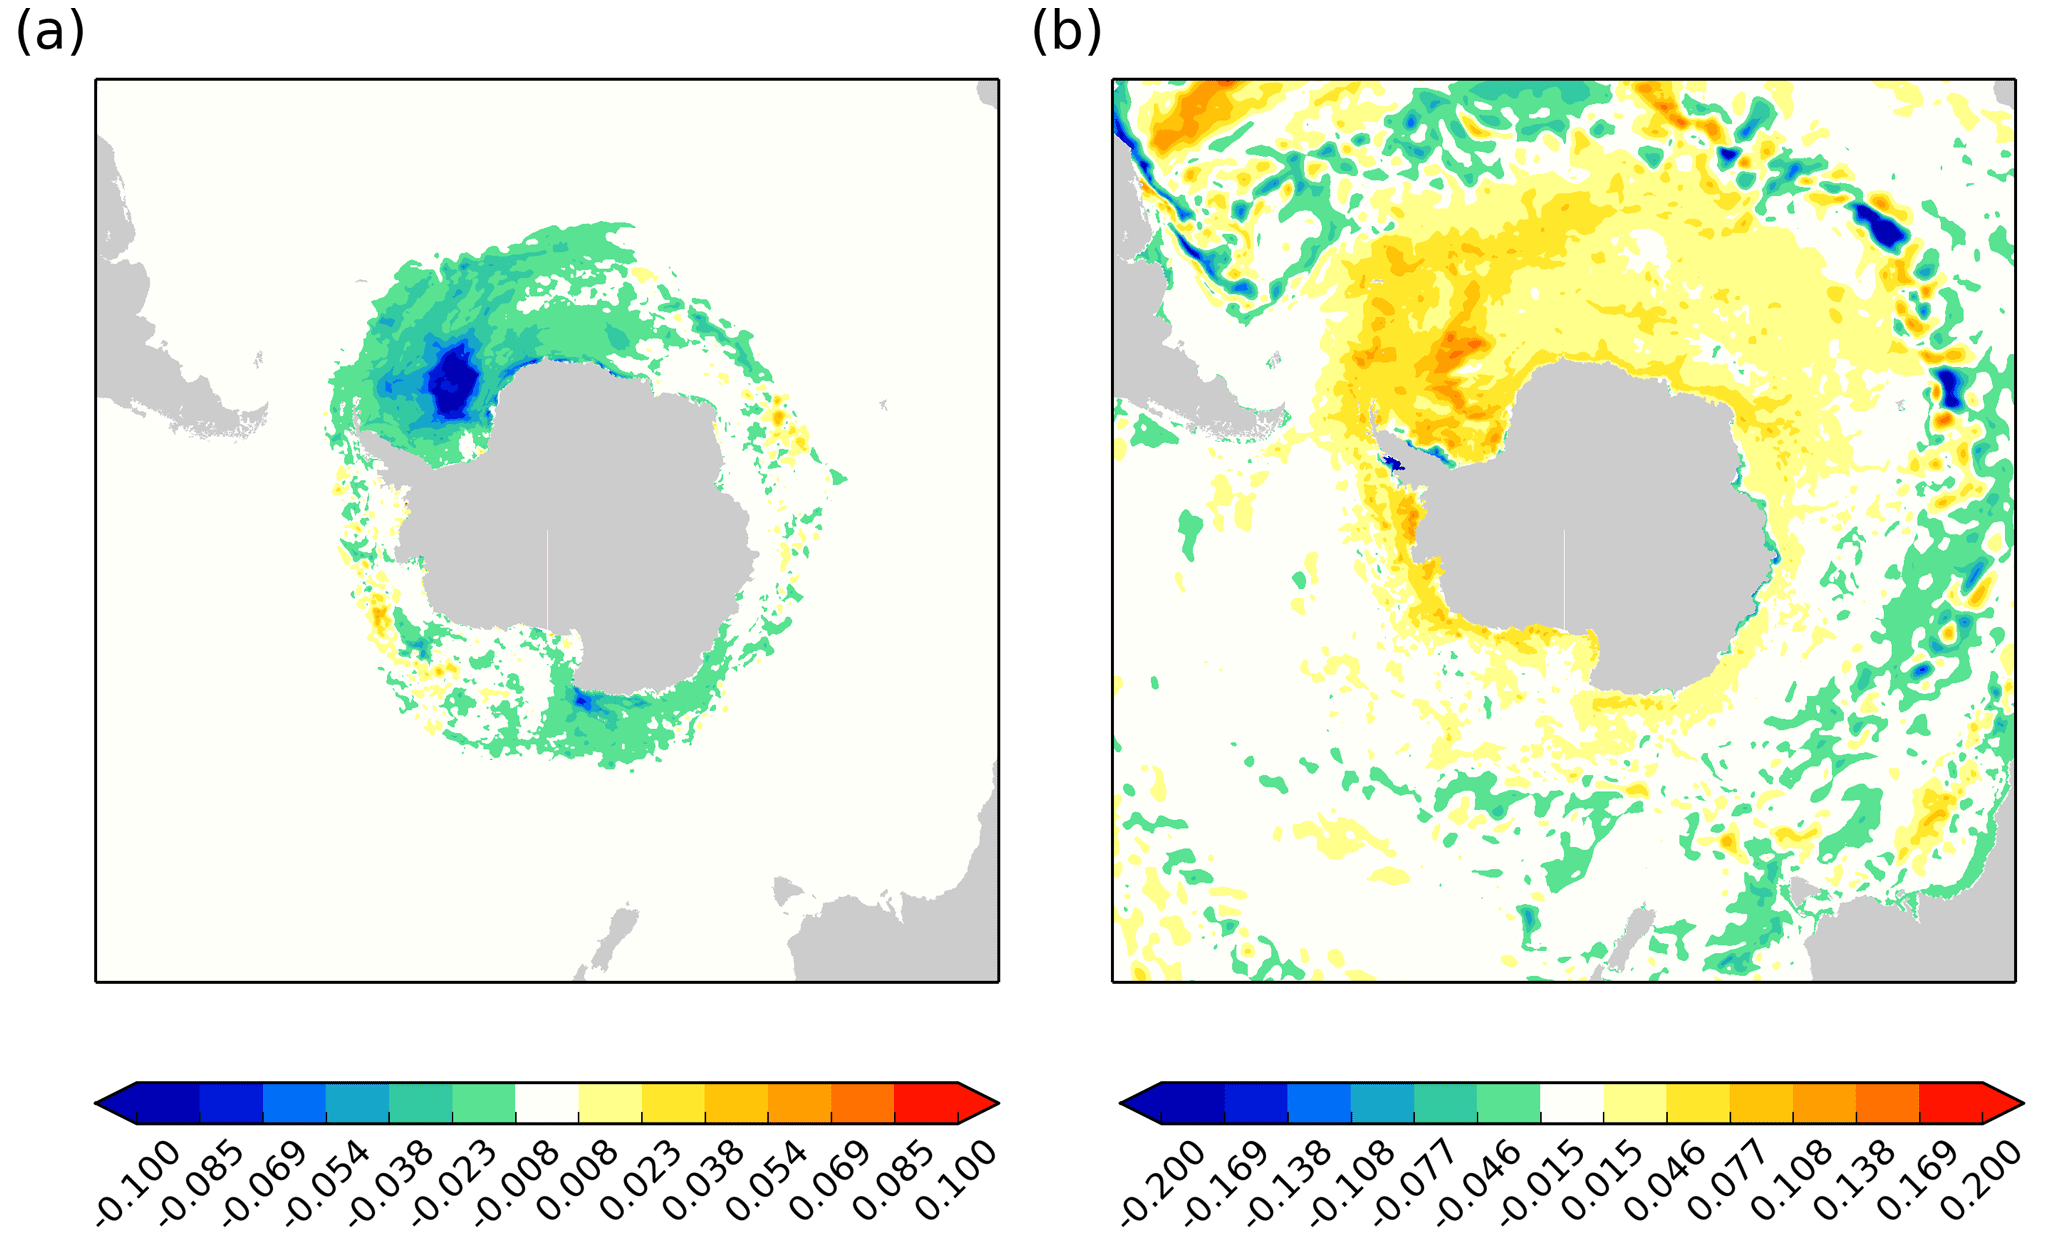
Figure 8Impact of inclusion of active icebergs scheme instead of runoff-type input used in GO5: (a) difference in sea ice fraction, icebergs minus no icebergs; (b) difference in surface salinity (psu), icebergs minus no icebergs. In both cases means are taken over the second 5 years of a 10-year spin-up.
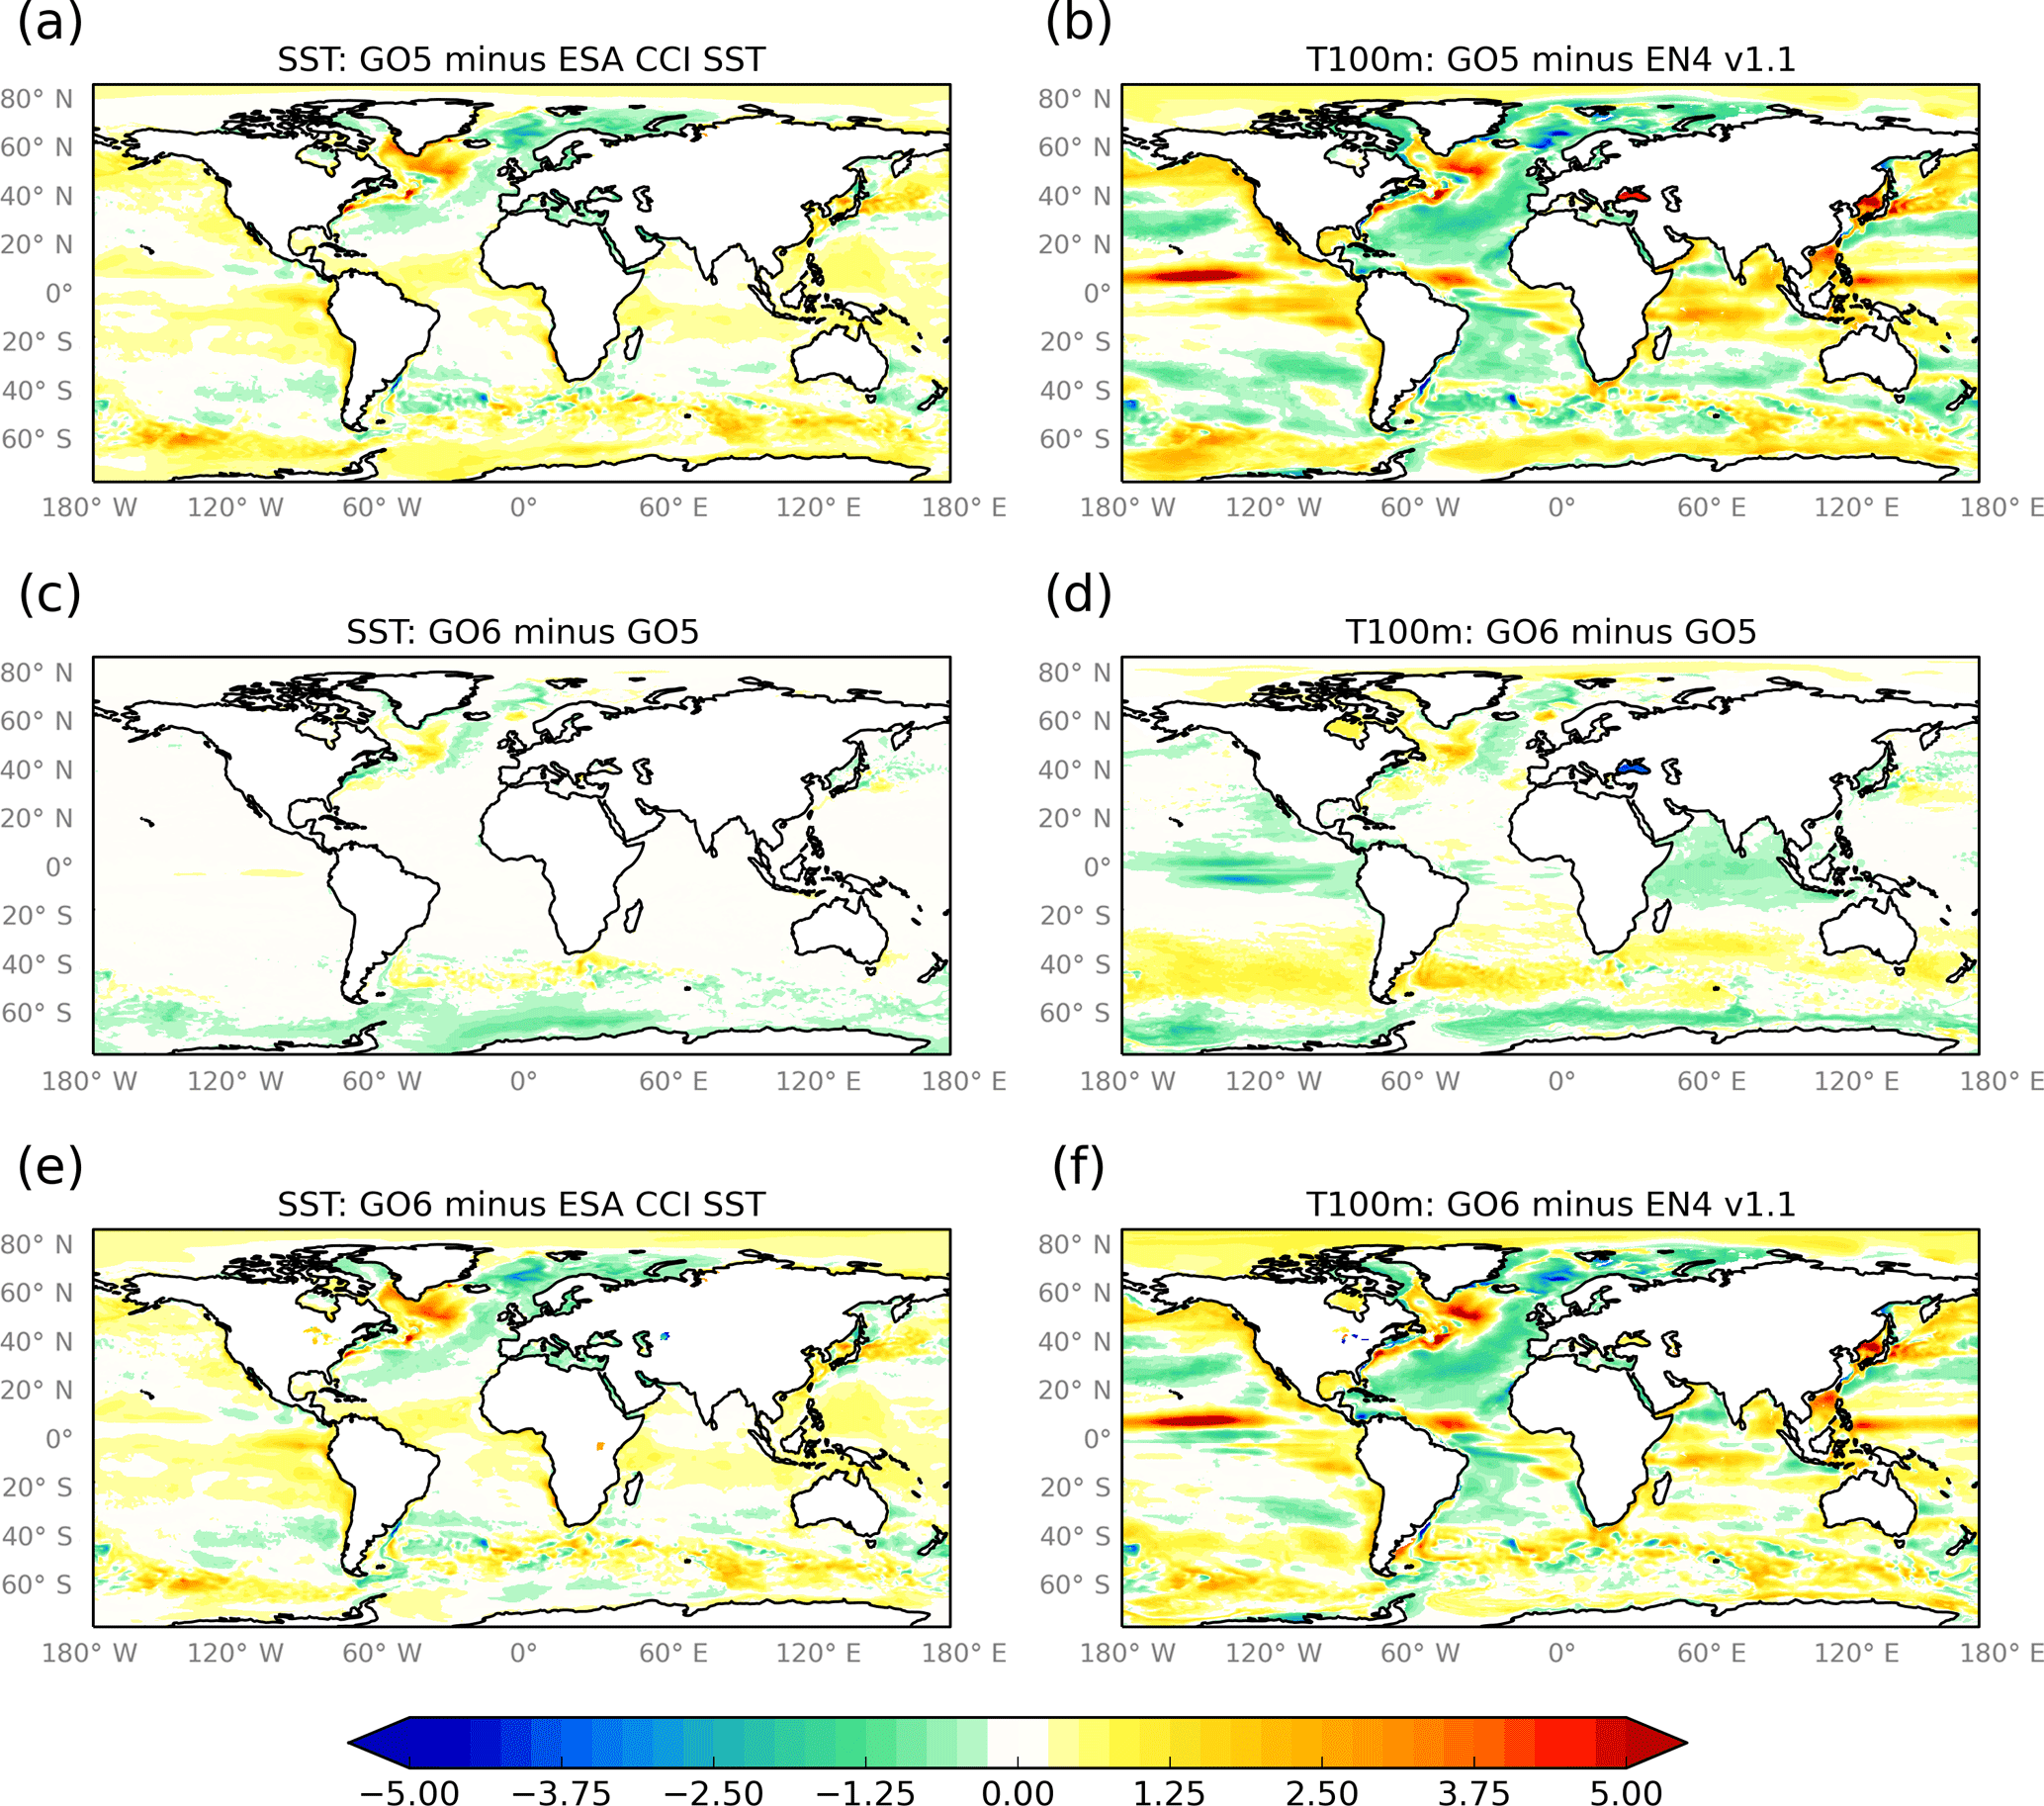
Figure 9Potential temperature (K): anomalies against climatology and GO6–GO5 differences at the surface and 100 m. SST anomalies are against ESA CCI (Merchant et al., 2014) and 100 m potential temperature anomalies are against a 20-year climatology of EN4 v1.1 (Good et al., 2013). Model fields are time-means over the third decade of the integration.
4.6 Developments to the sea ice model
In parallel to the ocean model development from GO5 to GO6, the sea ice model has been developed from the GSI5.0 (Rae et al., 20158) configuration used with GO5 to the GSI8.1 configuration described by Ridley et al. (2018). In assessing the GO6 ocean we therefore have to also take into account the impact of changes in the sea ice model. The two main developments in GSI8.1 compared to GSI5.0 are the replacement of the simple temperature-dependent albedo with an explicit calculation of the impact of surface melt ponds on albedo using the topographic melt pond scheme of Flocco et al. (2010), and a change to a multi-layer thermodynamics solver instead of zero-layer thermodynamics. In addition the ocean-ice drag coefficient has been nearly doubled from 0.00536 to 0.01 and, for the forced integrations, the albedo of bare ice in the visible waveband has been changed from 0.78 to 0.8333 to be more consistent with the coupled model. This albedo increase is numerically equivalent to the Semtner correction (Semtner, 1976) applied in the JULES scheme used in the coupled model (Ridley et al., 2018).
Sensitivity experiments show that the melt pond scheme reduces the volume of summertime sea ice in the Arctic (Fig. 4e), probably because it reduces the summertime ice albedo, increasing the melt rate for a given insolation. The multi-layer thermodynamics counteract this tendency by increasing the volume of summertime sea ice in the Arctic (Fig. 4g). The multi-layer thermodynamics also reduce the thickness and extent of wintertime ice in the Arctic and Antarctic (Fig. 4g and h) – a slight degradation. The multi-layer thermodynamics have nonzero thermal inertia in contrast to zero-layer thermodynamics, which increases the time taken for the ice to melt in the spring and increases the time taken for the ice to form in the autumn, since in both cases some of the heat exchange with the atmosphere is now used to change the temperature of the existing ice. In the Southern Hemisphere the changes in the sea ice volume due to the vertical mixing tuning (already discussed; Fig. 4a, b) are much larger than changes in the sea ice volume due to the changes to the sea ice model physics.

Figure 10Cross sections of zonal-mean potential temperature (K): anomalies against a 20-year climatology of EN4 v1.1 (Good et al., 2013) and GO6–GO5 differences. Line contours are zonal-mean potential density σ0 from the GO6 integration with a contour interval of 0.5 kg m−3. Model fields are time-means over the third decade of the integration.
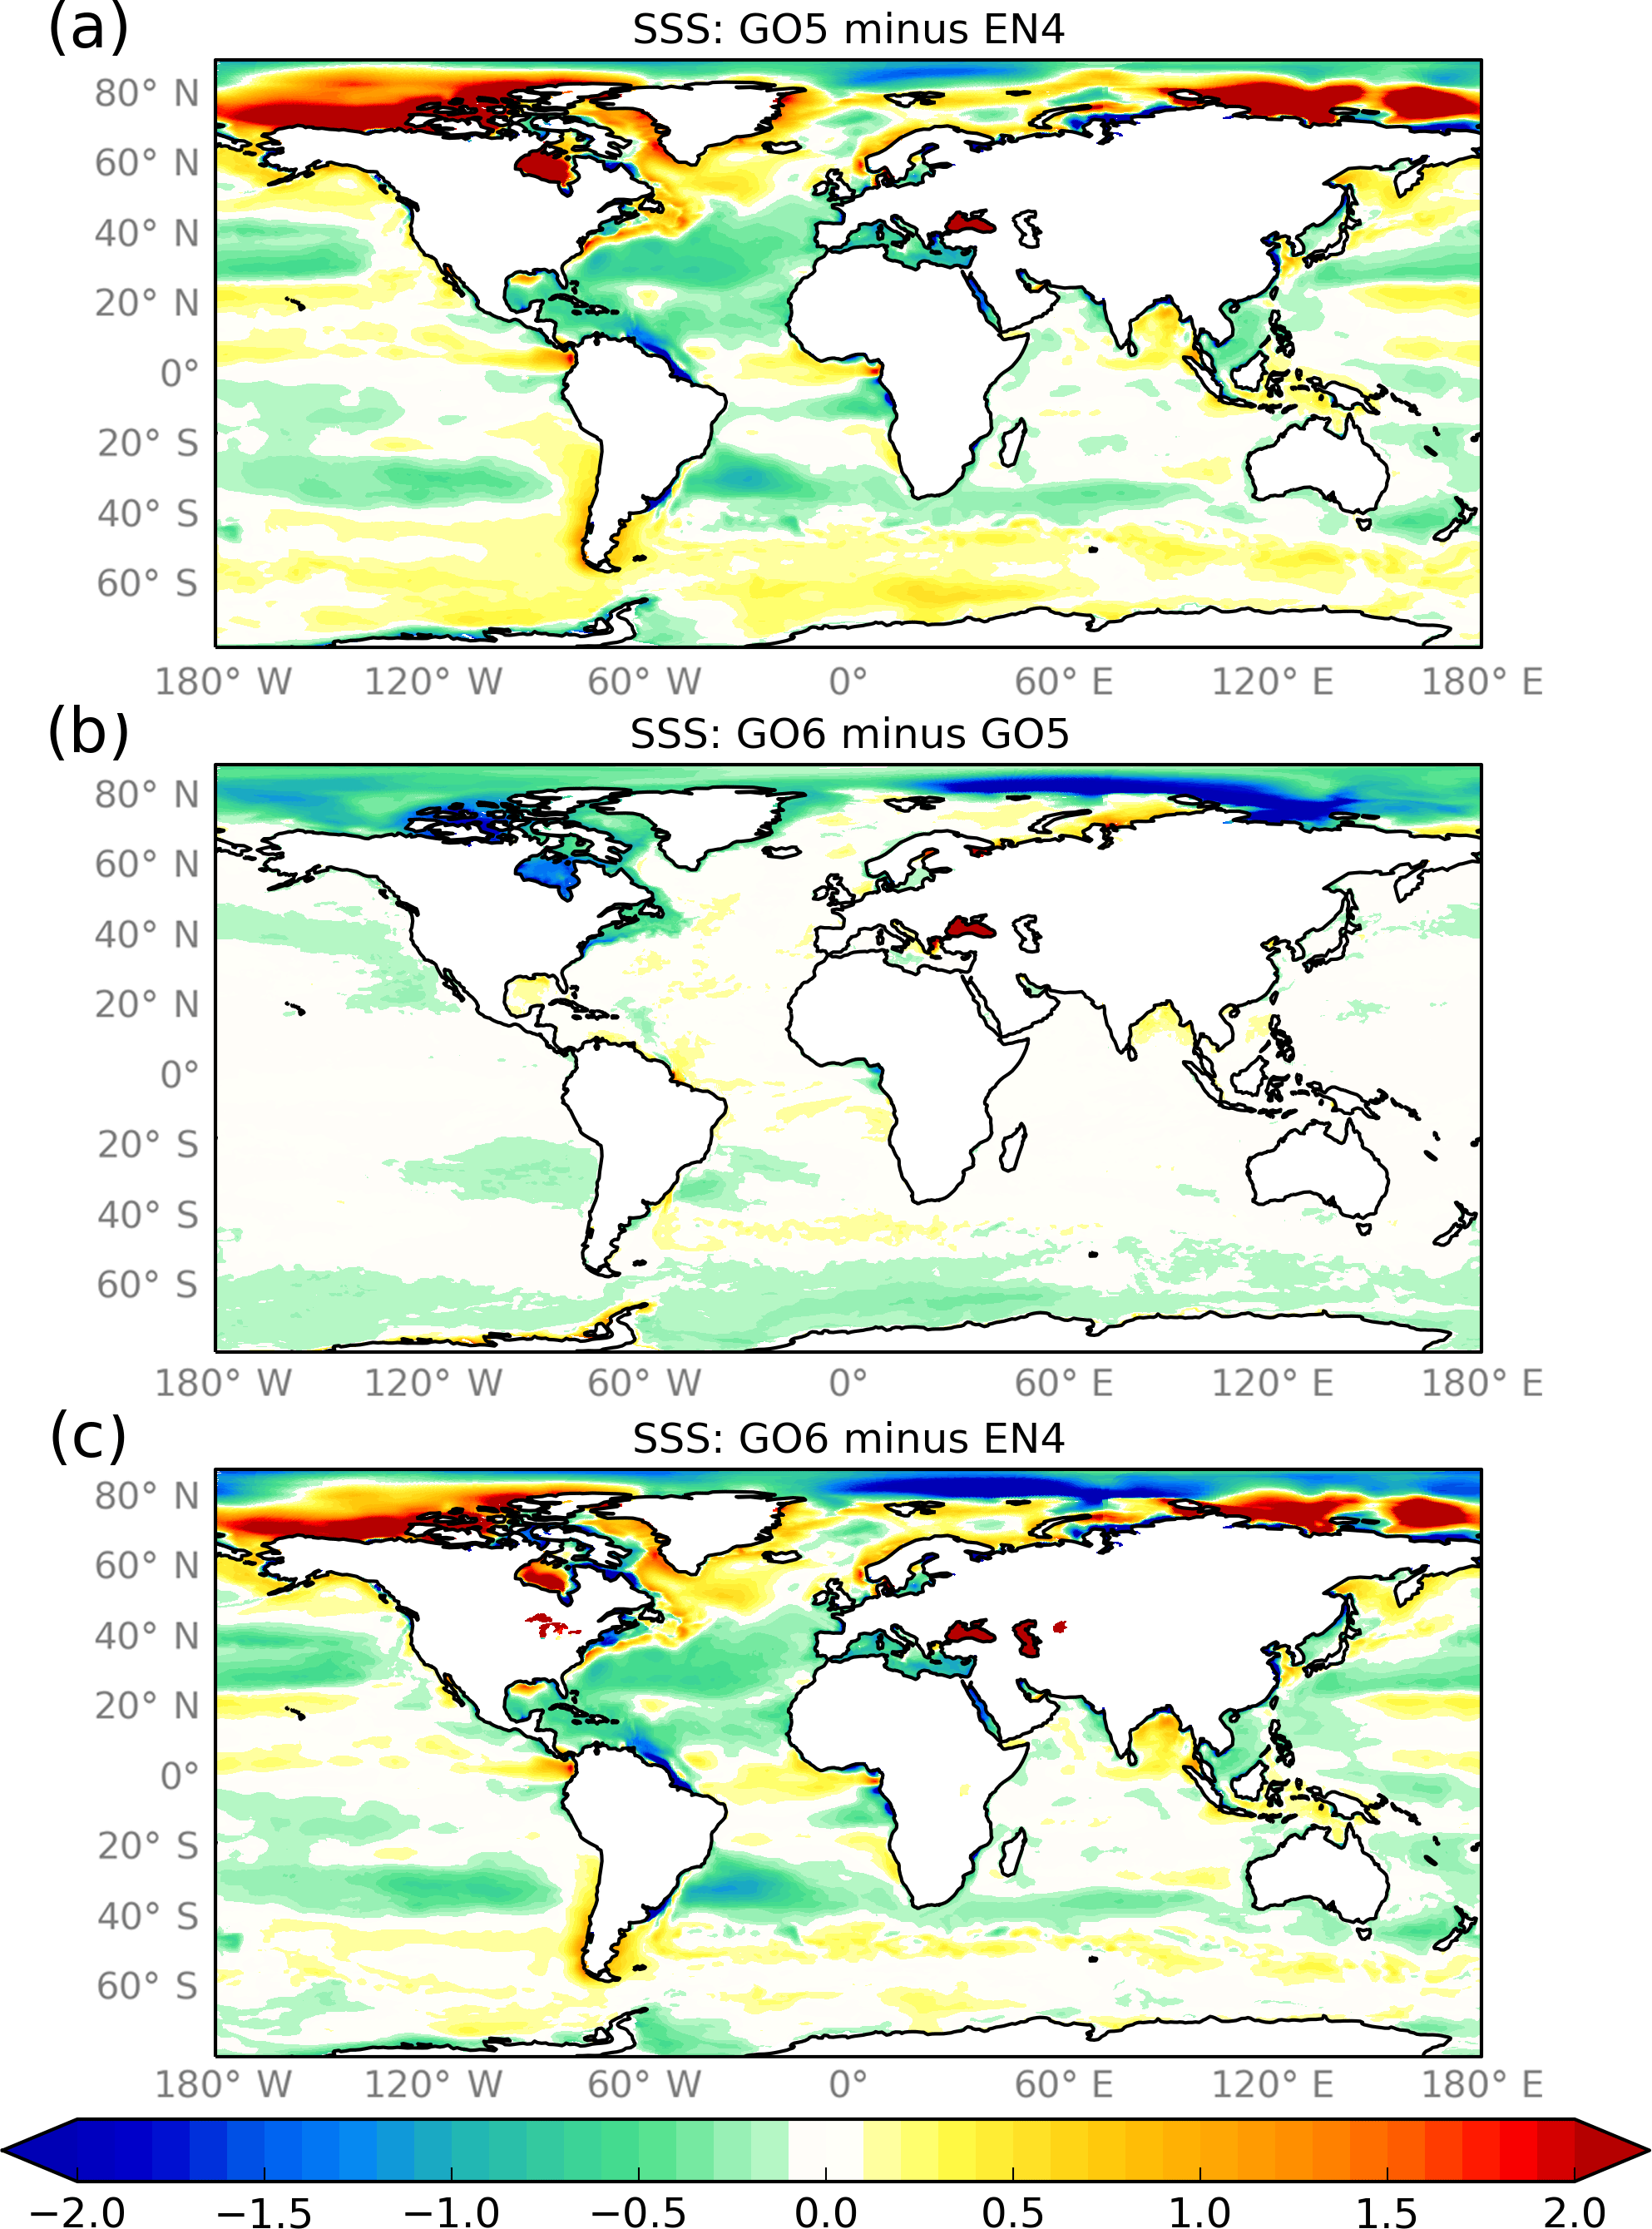
Figure 11Surface salinity (psu): anomalies against a 20-year climatology of EN4 v1.1 (Good et al., 2013) and GO6–GO5 differences. Fields are averaged over the last 10 years of the 30-year spin-up.

Figure 12Point-wise minimum and maximum monthly mixed layer depth (metres): anomalies against the de Boyer Montégut et al. (2004) climatology and GO6–GO5 differences. The point-wise minima and maxima are calculated as for Fig. 3. Hashed regions indicate the presence of sea ice at any time during the year.
5.1 Model assessment and comparison to GO5
In this section, we evaluate the GO6-GSI8.1 configuration compared to GO5-GSI5.0, based on 30-year CORE2-forced integrations from 1976 to 2005. Time averaged fields are taken from the third decade of the 30-year integrations. These integrations are shorter than the standard CORE2 protocol specification (Griffies et al., 2009) and would be insufficient to make a full assessment of the long-term behaviour of GO6. However, here we focus on the impact of the model developments between GO5 and GO6 on the upper ocean, which equilibrates on shorter timescales. Assessment of GO6 in the full CORE2 protocol and comparison with other models is planned as future work.
Looking first at the temperature, the GO5 model is generally too warm in the Southern Ocean, in the northern subpolar gyres and in the tropics, with cold biases in the subtropical gyres (Fig. 9a, b). The changes in GO6 tend to cool the Southern Ocean south of the ACC and warm the ocean north of the ACC. There is a subsurface cooling in the tropics and a dipole pattern of warming and cooling in the North Atlantic subpolar gyre (Fig. 9c, d). With the exception of the North Atlantic subpolar gyre, the differences generally improve the model (Fig. 9e, f; compare a, b). These near-surface biases are visible in the zonal-mean cross section of temperature (Fig. 10). There are also deeper cold biases in the tropics and subtropics. The GO6 changes cool the near-surface ocean south of the ACC and warm it north of the ACC, reducing corresponding cold and warm biases in the top 100 m. There is a warming of the Southern Ocean below 200 m which introduces a slight warm bias in GO6. The tropical ocean is cooled in the near-surface layers, which reduces the near-surface warm bias but to some extent also exacerbates the deeper cool bias.
Regarding surface salinity biases, the GO5 model tends to be too salty in the Southern Ocean, in the subpolar gyres and on the continental shelf in the Arctic, and too fresh in the central Arctic Ocean and in the subtropical gyres (Fig. 11). The main impact of the GO6 changes is at high latitudes. The Southern Ocean tends to freshen south of the ACC which reduces the large-scale saline bias. There is a general freshening of the surface layers in the Arctic going from GO5 to GO6 which worsens the fresh bias in the central Arctic Ocean but mitigates some of the salty biases near to Siberia and Canada.
Summertime mixed layer depths tend to be too shallow in the Southern Ocean in GO5 and this bias tends to be corrected in GO6 (Fig. 12a, c, e). The wintertime mixing in GO5 is too deep in the Atlantic subpolar gyre and the Greenland–Iceland–Norway seas and also in the Southern Ocean west of the Drake Passage and in the Weddell Sea. The very deep wintertime mixed layers in the Southern Ocean are much reduced in GO6 (Fig. 12b, d, f). The deep mixing in GO5 in the Weddell Sea is related to the presence of a large open-ocean polynya which will be discussed in Sect. 5.2.
Figure 13 shows the mean seasonal cycle of integrated sea ice extent and volume in the Northern and Southern hemispheres. In the Arctic, GO5-GSI5 and GO6-GSI8.1 both do a reasonable job of simulating the total wintertime sea ice extent compared to a climatology of the HadISST analysis (Rayner et al., 2003), but both models have a too small extent in the boreal summer. The total volume is underestimated compared to the Pan-Arctic Ice Ocean Modeling and Assimilation System (PIOMAS; Zhang and Rothrock, 2003) reanalysis year-round, but especially in the boreal summer. By this metric there is a relatively small difference between the two model versions in the Arctic, mostly to do with the timing of the seasonal cycle. There is a slightly faster springtime melting and slightly faster ice formation in the autumn in GO6-GSI8.1 compared to GO5-GSI5.0 but the minimum and maximum ice volumes are unchanged. In the Antarctic, the wintertime sea ice extent is reasonable compared to HadISST but there is a large underestimation of the summertime extent in both configurations. The wintertime total volume is greatly increased in GO6-GSI8.1, which is partly owing to the fact that the open-ocean Weddell Sea polynyas seen in the GO5-GSI5.0 simulations do not appear in the GO6-GSI8.1 simulations.
To look in more detail at the spatial differences between the GO5-GSI5.0 and GO6-GSI8.1 runs, mean seasonal sea ice concentration fields (Fig. 14) and sea ice thickness fields (Fig. 15) have been analysed. The analysis shows that GO6-GSI8.1 has improved simulations of sea ice concentration in winter in both the Arctic and the Antarctic. In the Arctic, the concentration is reduced in the Greenland and Barents seas, mitigating positive biases against HadISST. In the Antarctic, there is a general increase in sea ice concentration everywhere, most markedly in the Bellingshausen–Amundsen and Ross seas and in the central Weddell Sea. In these areas, biases against HadISST have been reduced, but the bias is increased west and north of the Antarctic Peninsula (Fig. 14a–e and f–j). In the boreal summer, sea ice concentration over most of the Arctic has slightly reduced in GO6-GSI8.1, a degradation compared to HadISST. In the Antarctic, summertime sea ice concentration tends to increase in GO6-GSI8.1 closer to the coast but reduce further offshore. For the most part, this reduces biases compared to HadISST, except for the eastern Weddell Sea and the Pacific sector of the Southern Ocean, where the bias has increased (Fig. 14p–t).
Figure 15 shows spatial sea ice thickness distribution in GO6 and difference between GO6 and GO5. There is a moderate increase in the Arctic ice thickness in the boreal winter and moderate decrease in the boreal summer in GO6 (Fig. 14b, d). Comparison with Fig. 13 shows that this is mainly due to the small change in the timing of the seasonal cycle already noted. In the Antarctic, GO6 has large thickness increases all-year round compared to GO5, with the main increase in thicknesses in the western Weddell and Ross seas (Fig. 14f, h).
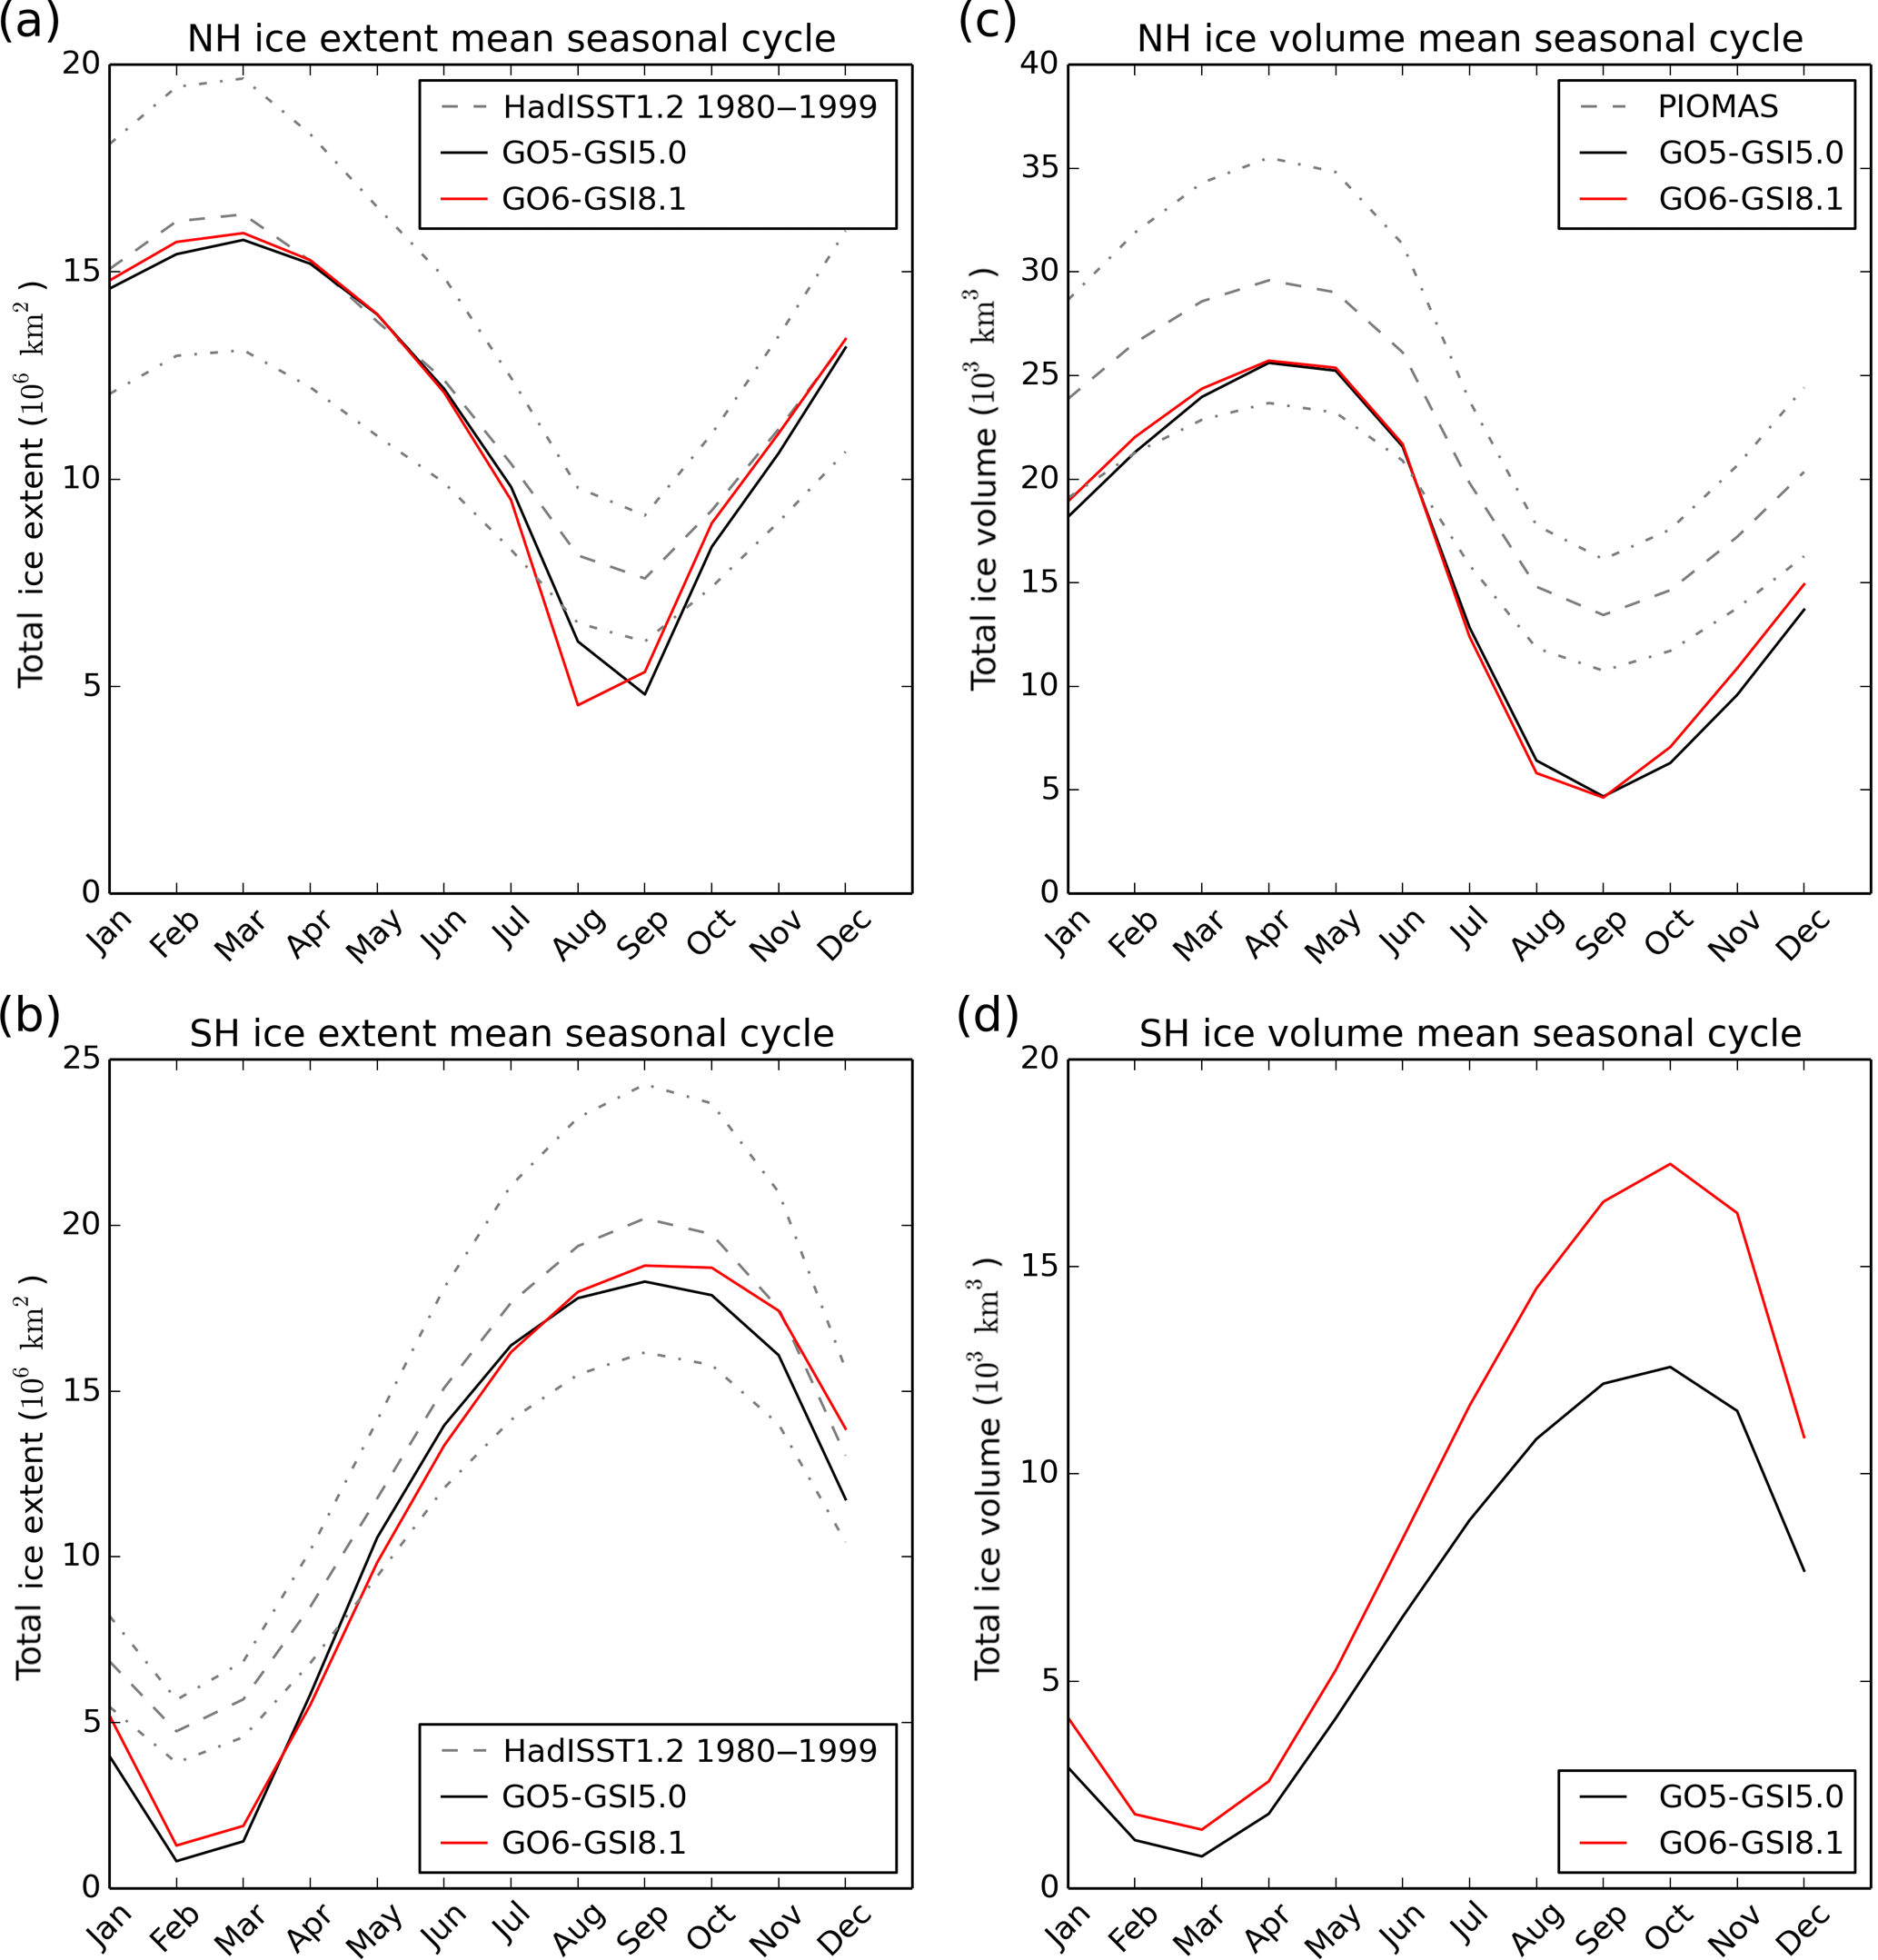
Figure 13Mean seasonal cycles for integrated sea ice extent and volume for the two hemispheres (NH and SH) for GO5-GSI5 and GO6-GSI8.1. Sea ice extent is calculated as the integral of the area of grid cells where the sea ice concentration is greater than 15 %. The meaning period is 1977–2004. Grey dashed lines in the extent plots show a climatology (mean and ±20 %) of the HadISST analysis (Rayner et al., 2003) Grey dashed lines in the Northern Hemisphere volume plot show a climatology (mean and ±20 %) of the PIOMAS (Zhang and Rothrock, 2003) reanalysis.
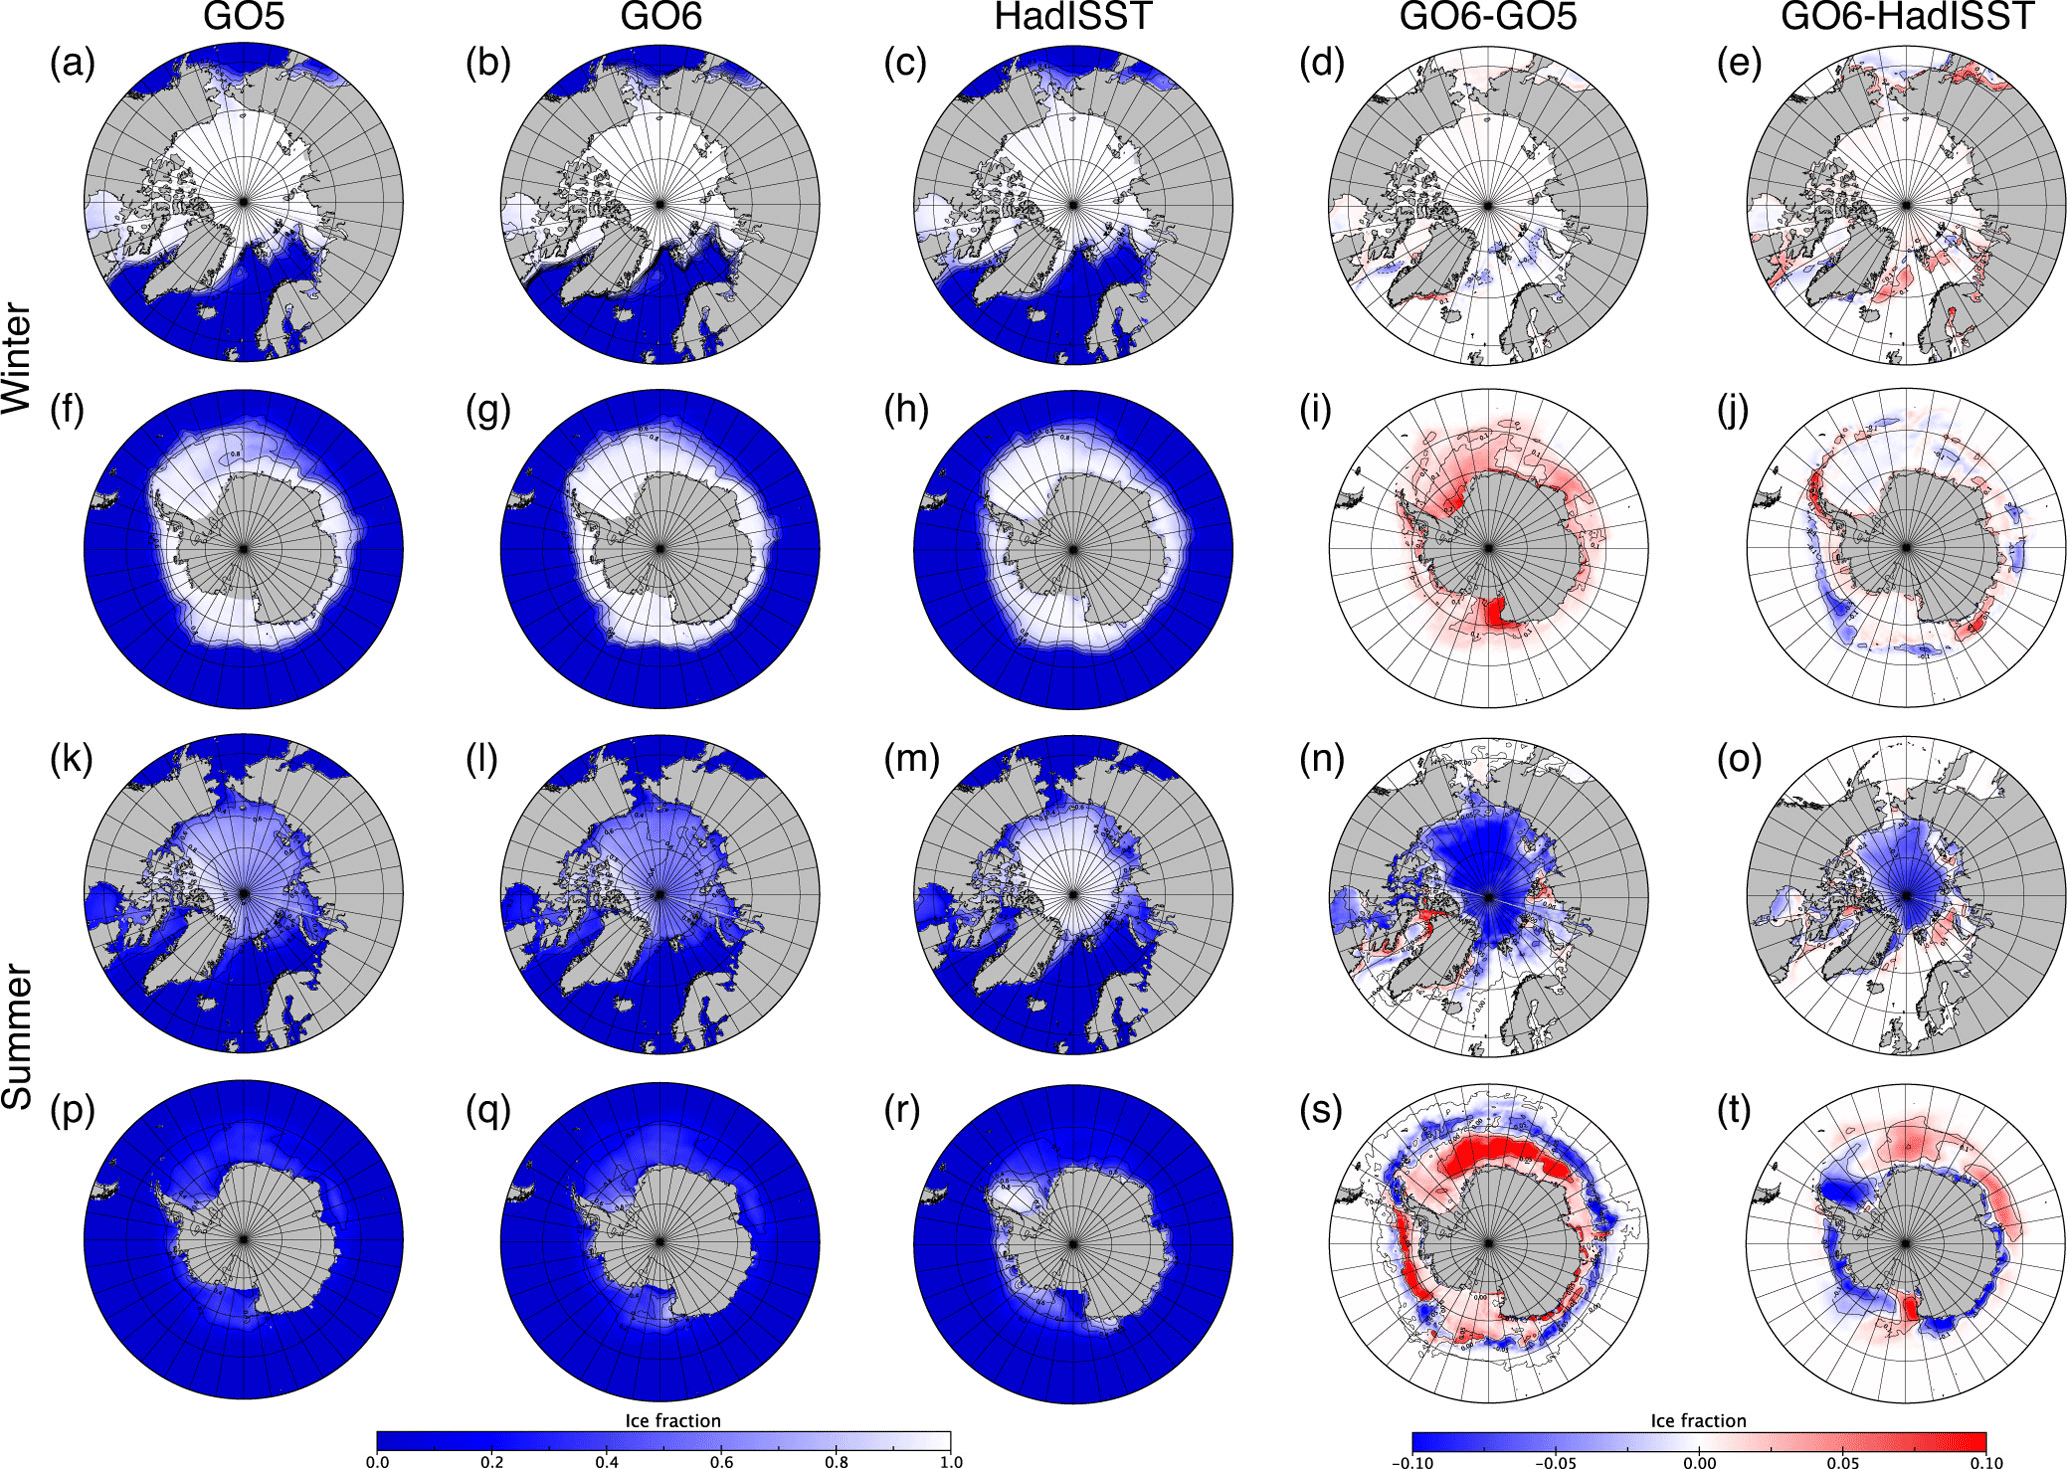
Figure 14Seasonal-mean multi-annual sea ice concentration for summer and winter, averaged for 1978–2005 in GO5-GSI5.0, GO6-GSI8.1 and the HadISST analysis (Rayner et al., 2003). Panels (a)–(e) show GO5-GSI5.0, GO6-GSI8.1 and HadISST ice concentration and the concentration difference between GO6-GSI8.1 and GO5-GSI5.0 and the bias between GO6-GSI8.1 and HadISST respectively for DJF in the Northern Hemisphere (NH); (f)–(j) are the same as above but for JJA in the Southern Hemisphere (SH); (k)–(o) are the same as (a)–(e) but for JJA in the NH; (p)–(t) are the same as (f)–(j) but for DJF in the SH.
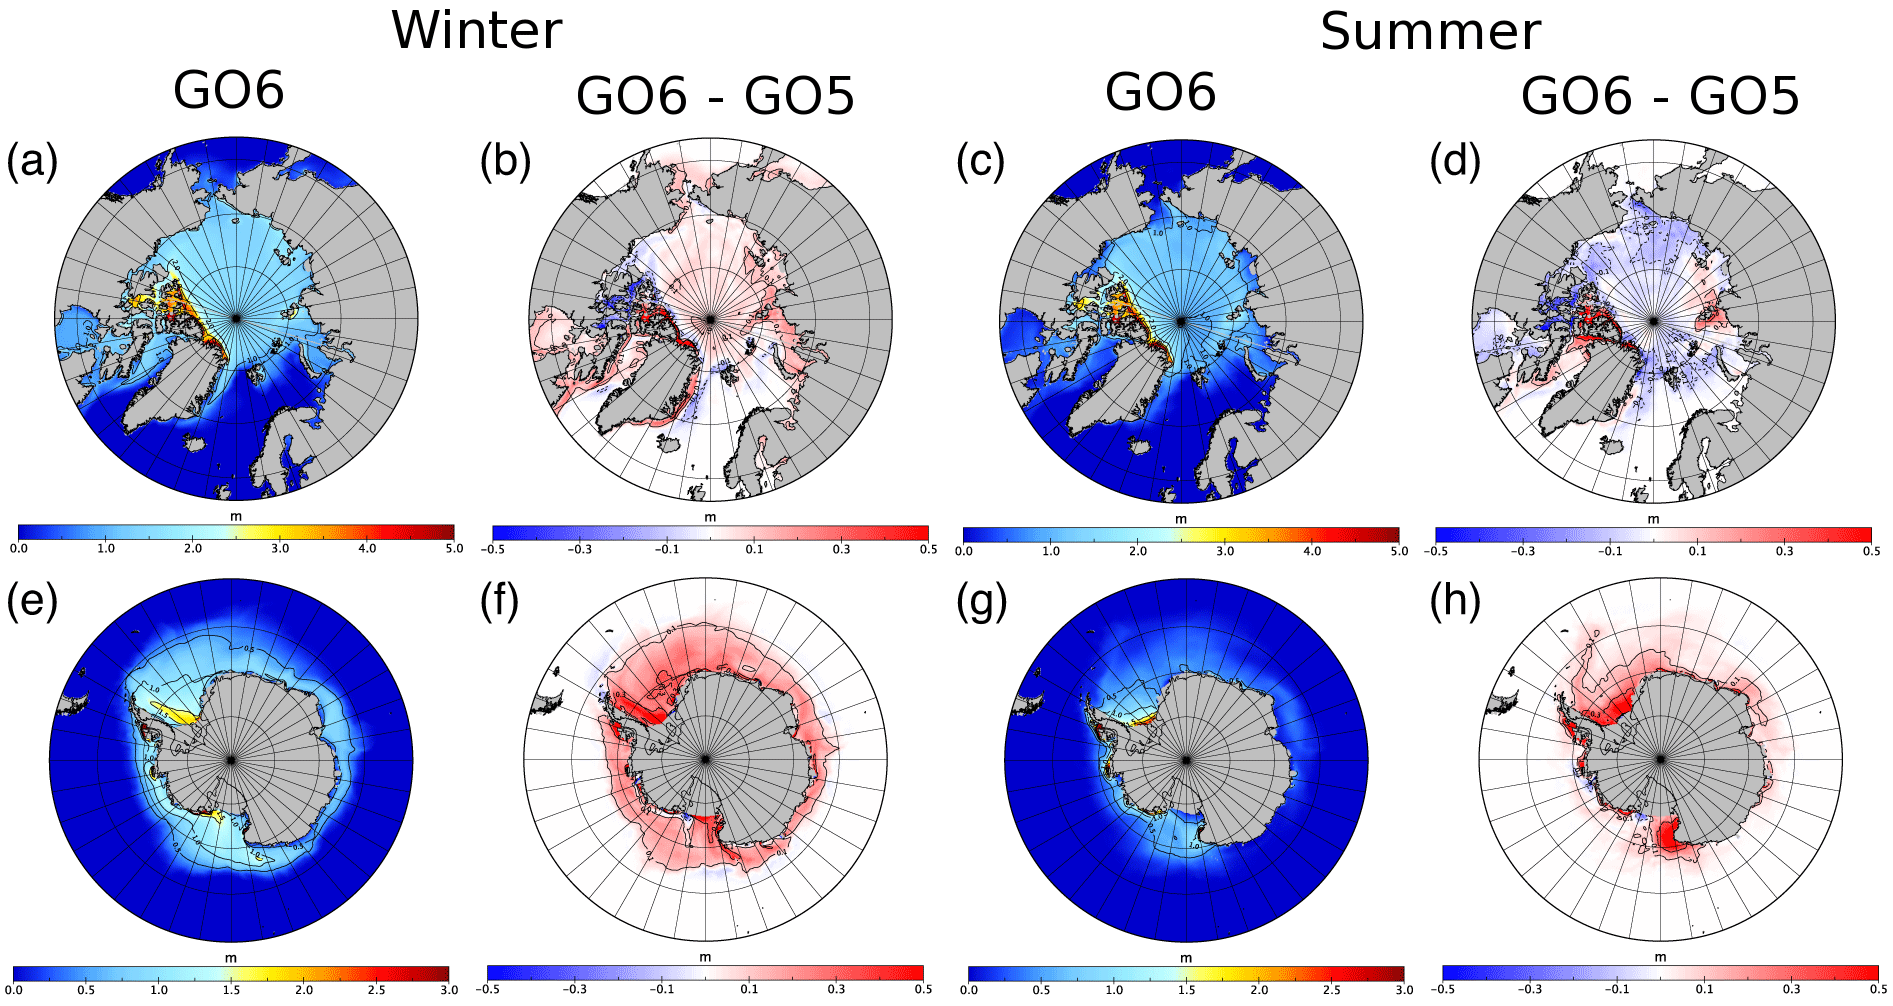
Figure 15Seasonal-mean multi-annual sea ice thickness (m) in the summer and winter, averaged for 1978–2005 in GO6-GSI8.1, GO5-GSI5.0 and the differences between the two runs. Panels (a)–(d) show sea ice thickness in GO6-GSI8.1 and the difference between GO6-GSI8.1 and GO5-GSI5.0 for DJF (a, b) and JJA (c, d) in the Northern Hemisphere (NH); (e)–(h) are the same as above but for JJA (e, f) and (DJF) (g, h) in the Southern Hemisphere (SH).
5.2 Attribution of changes in results to model changes
In this section, we summarize the sensitivities described in Sect. 4 and show which model changes are responsible for the main changes between GO5 and GO6.
The simulation of the sea ice is an important aspect of the Southern Ocean, feeding back on the ocean hydrography. As shown in Figs. 13, 14 and 15 there is substantially more sea ice in the Southern Ocean in the GO6 simulation compared to GO5. The concentration and the thickness are increased in most areas, especially in the austral winter. Part of this difference arises in the Weddell Sea where, in the GO5 simulations, large open-ocean polynyas tended to open up in the winter (Megann et al., 2014). For GO6 the polynyas tend to be suppressed. Sensitivity experiments show that the change likely to be mainly responsible for the increased sea ice is the vertical mixing change described in Sect. 4.3. This deepens the summertime mixed layers in the Southern Ocean and reduces the surface warm bias (see Figs. 12 and 9), allowing more sea ice to persist through the austral summer and maintaining the stratification which in turn is favourable for sea ice formation in the following winter. Most of the other GO6 changes tend to suppress sea ice formation in the Southern Ocean. The Lagrangian icebergs scheme moves fresh water offshore resulting in saltier and less stable near-shore water. The ice shelf melting parameterization puts fresh water into the ocean at depth, destabilizing the water column and helping to bring warmer, saltier water to the surface. Both of these changes will therefore tend to suppress sea ice formation near the coast and the ice shelf edges and have been shown to result in less sea ice in sensitivity studies (Marsh et al., 2015; Mathiot et al., 2017). The developments to the sea ice model have a small impact on the integrated sea ice area and volume in the Southern Ocean (Fig. 4); the use of multi-layer thermodynamics tends to slightly reduce the volume of Southern Ocean ice in the austral winter. It is therefore apparent that in this aspect the vertical mixing change dominates the other changes and results in an improved sea ice simulation. This result is consistent with the results presented by Heuzé et al. (2015) and Kjellsson et al. (2015) who also show that increased near-surface vertical mixing in the Southern Ocean tends to close open-ocean Weddell Sea polynyas.
The increased Southern Ocean sea ice for GO6 is driven by reduced melting in the open ocean in response to colder summertime SSTs. The reduced sea ice melt should in turn result in a salinification of the near-surface layers in the Southern Ocean due to reduced fresh water input. However, Fig. 11 shows that going from GO5 to GO6 there is a net freshening of near-surface waters in the Southern Ocean, which extends to about 150 m depth (not shown). This corrects a saline bias compared to EN4. One possible mechanism for this could be the introduction of Lagrangian icebergs which move fresh water offshore, but as discussed in Sect. 4.5 the net effect of the icebergs is actually to indirectly make the surface layers more saline by reducing the production of sea ice and hence reducing the total overall sea ice (Fig. 8a). The actual cause of the freshening at GO6 appears to be the reduction in the isopycnal diffusion coefficient (Fig. 6c, d), which reduces the amount of warm, salty water upwelled from depth in the Southern Ocean and counteracts the salinification due to reduced sea ice melting.
Figures 9 and 10 show that the main change in the tropics going from GO5 to GO6 is a subsurface cooling at around 100–200 m in the Indian and eastern Pacific oceans. This mitigates a subsurface warm bias visible at about 100 m in the GO5 results, but also in the Pacific slightly exacerbates a deeper cold bias. Sensitivity experiments (not shown) suggest that the primary change responsible for this cooling is the use of the Hollingsworth et al. (1983) formulation of the momentum advection scheme. As described in Sect. 4.2, the subsurface mixing in the central Indian Ocean and eastern Pacific Ocean is reduced when the Hollingsworth et al. formulation is used. It seems likely that this is causing less heat to be mixed down, giving a cooling of the subsurface layers, which for the most part reduces existing subsurface biases in the tropics. One might expect that if less heat were being mixed down then the SST would show a warming signal. However, in these forced experiments the SST is quite strongly constrained by the forcing and the ocean “sees” an atmosphere with effectively infinite heat capacity.
The main hydrography changes in the Northern Hemisphere between GO5 and GO6 are changes to the temperature and salinity patterns in the North Atlantic subpolar gyre and a general freshening of the near-surface waters in the Arctic (Figs. 9 and 11). Comparison of these figures with Figs. 5d and 6d shows that the reduction of the isopycnal mixing coefficient is likely to be the biggest cause of both of these changes. The sensitivity experiment shows that while the reduction of the isopycnal mixing coefficient gives a freshening of surface waters in the Arctic, this does not seem to impact significantly on the sea ice simulation. The changes in the sea ice simulation in the Arctic between GO5-GSI5.0 and GO6-GSI8.1 must therefore be a result of the changes in the sea ice model formulation between GSI5.0 and GSI8.1. As noted in Sect. 4.6 the improvement in the representation of melt ponds and the inclusion of multi-layer thermodynamics appear to have opposite effects in the Arctic with the melt ponds decreasing the summertime ice and the multi-layer thermodynamics increasing the summertime ice. As described in Sect. 5.1, the net effect appears to be to change the timing of the seasonal cycle slightly with faster melting in the spring and faster formation in the autumn but the minimum and maximum values unchanged (Fig. 13a and c).
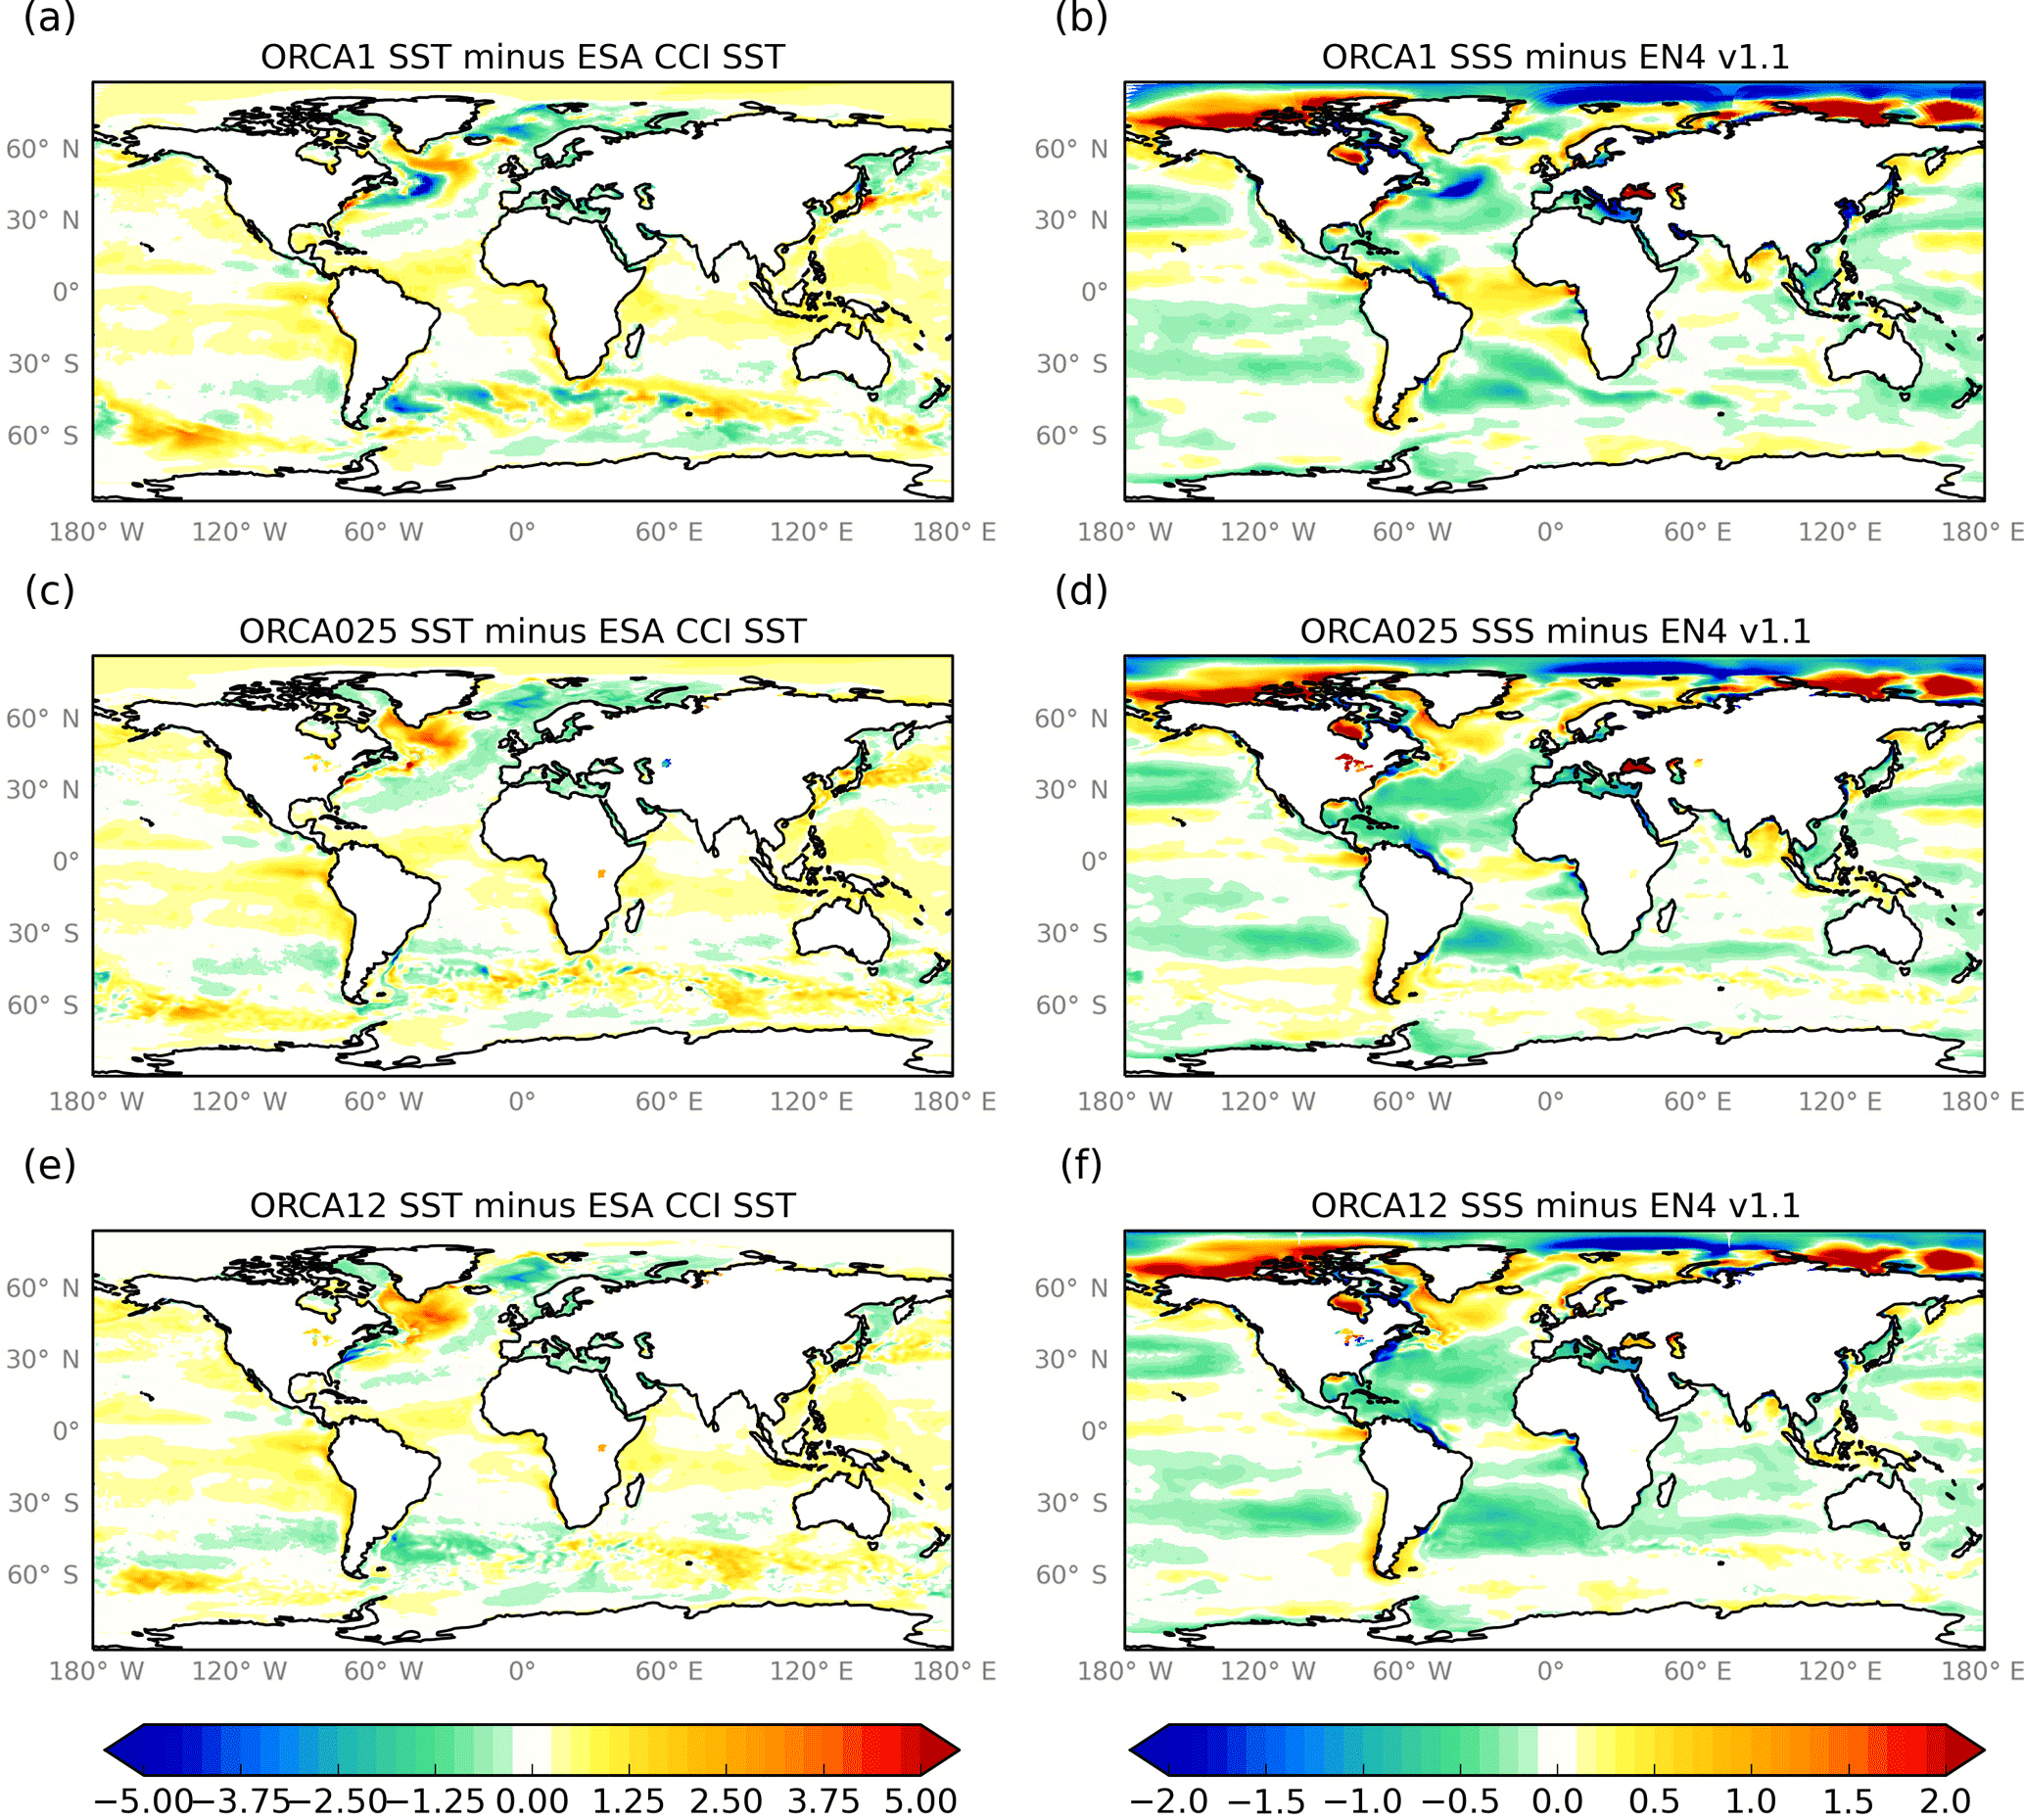
Figure 16Cross-resolution results: (a, c, e) model SST anomalies (K) against ESA CCI (Merchant et al., 2014); (b, d, f) model SSS anomalies (psu) against the EN4 v1.1 analysis (Good et al., 2013). In all cases the model fields are 10-year means for the third decade of the spin-up (1996–2005).
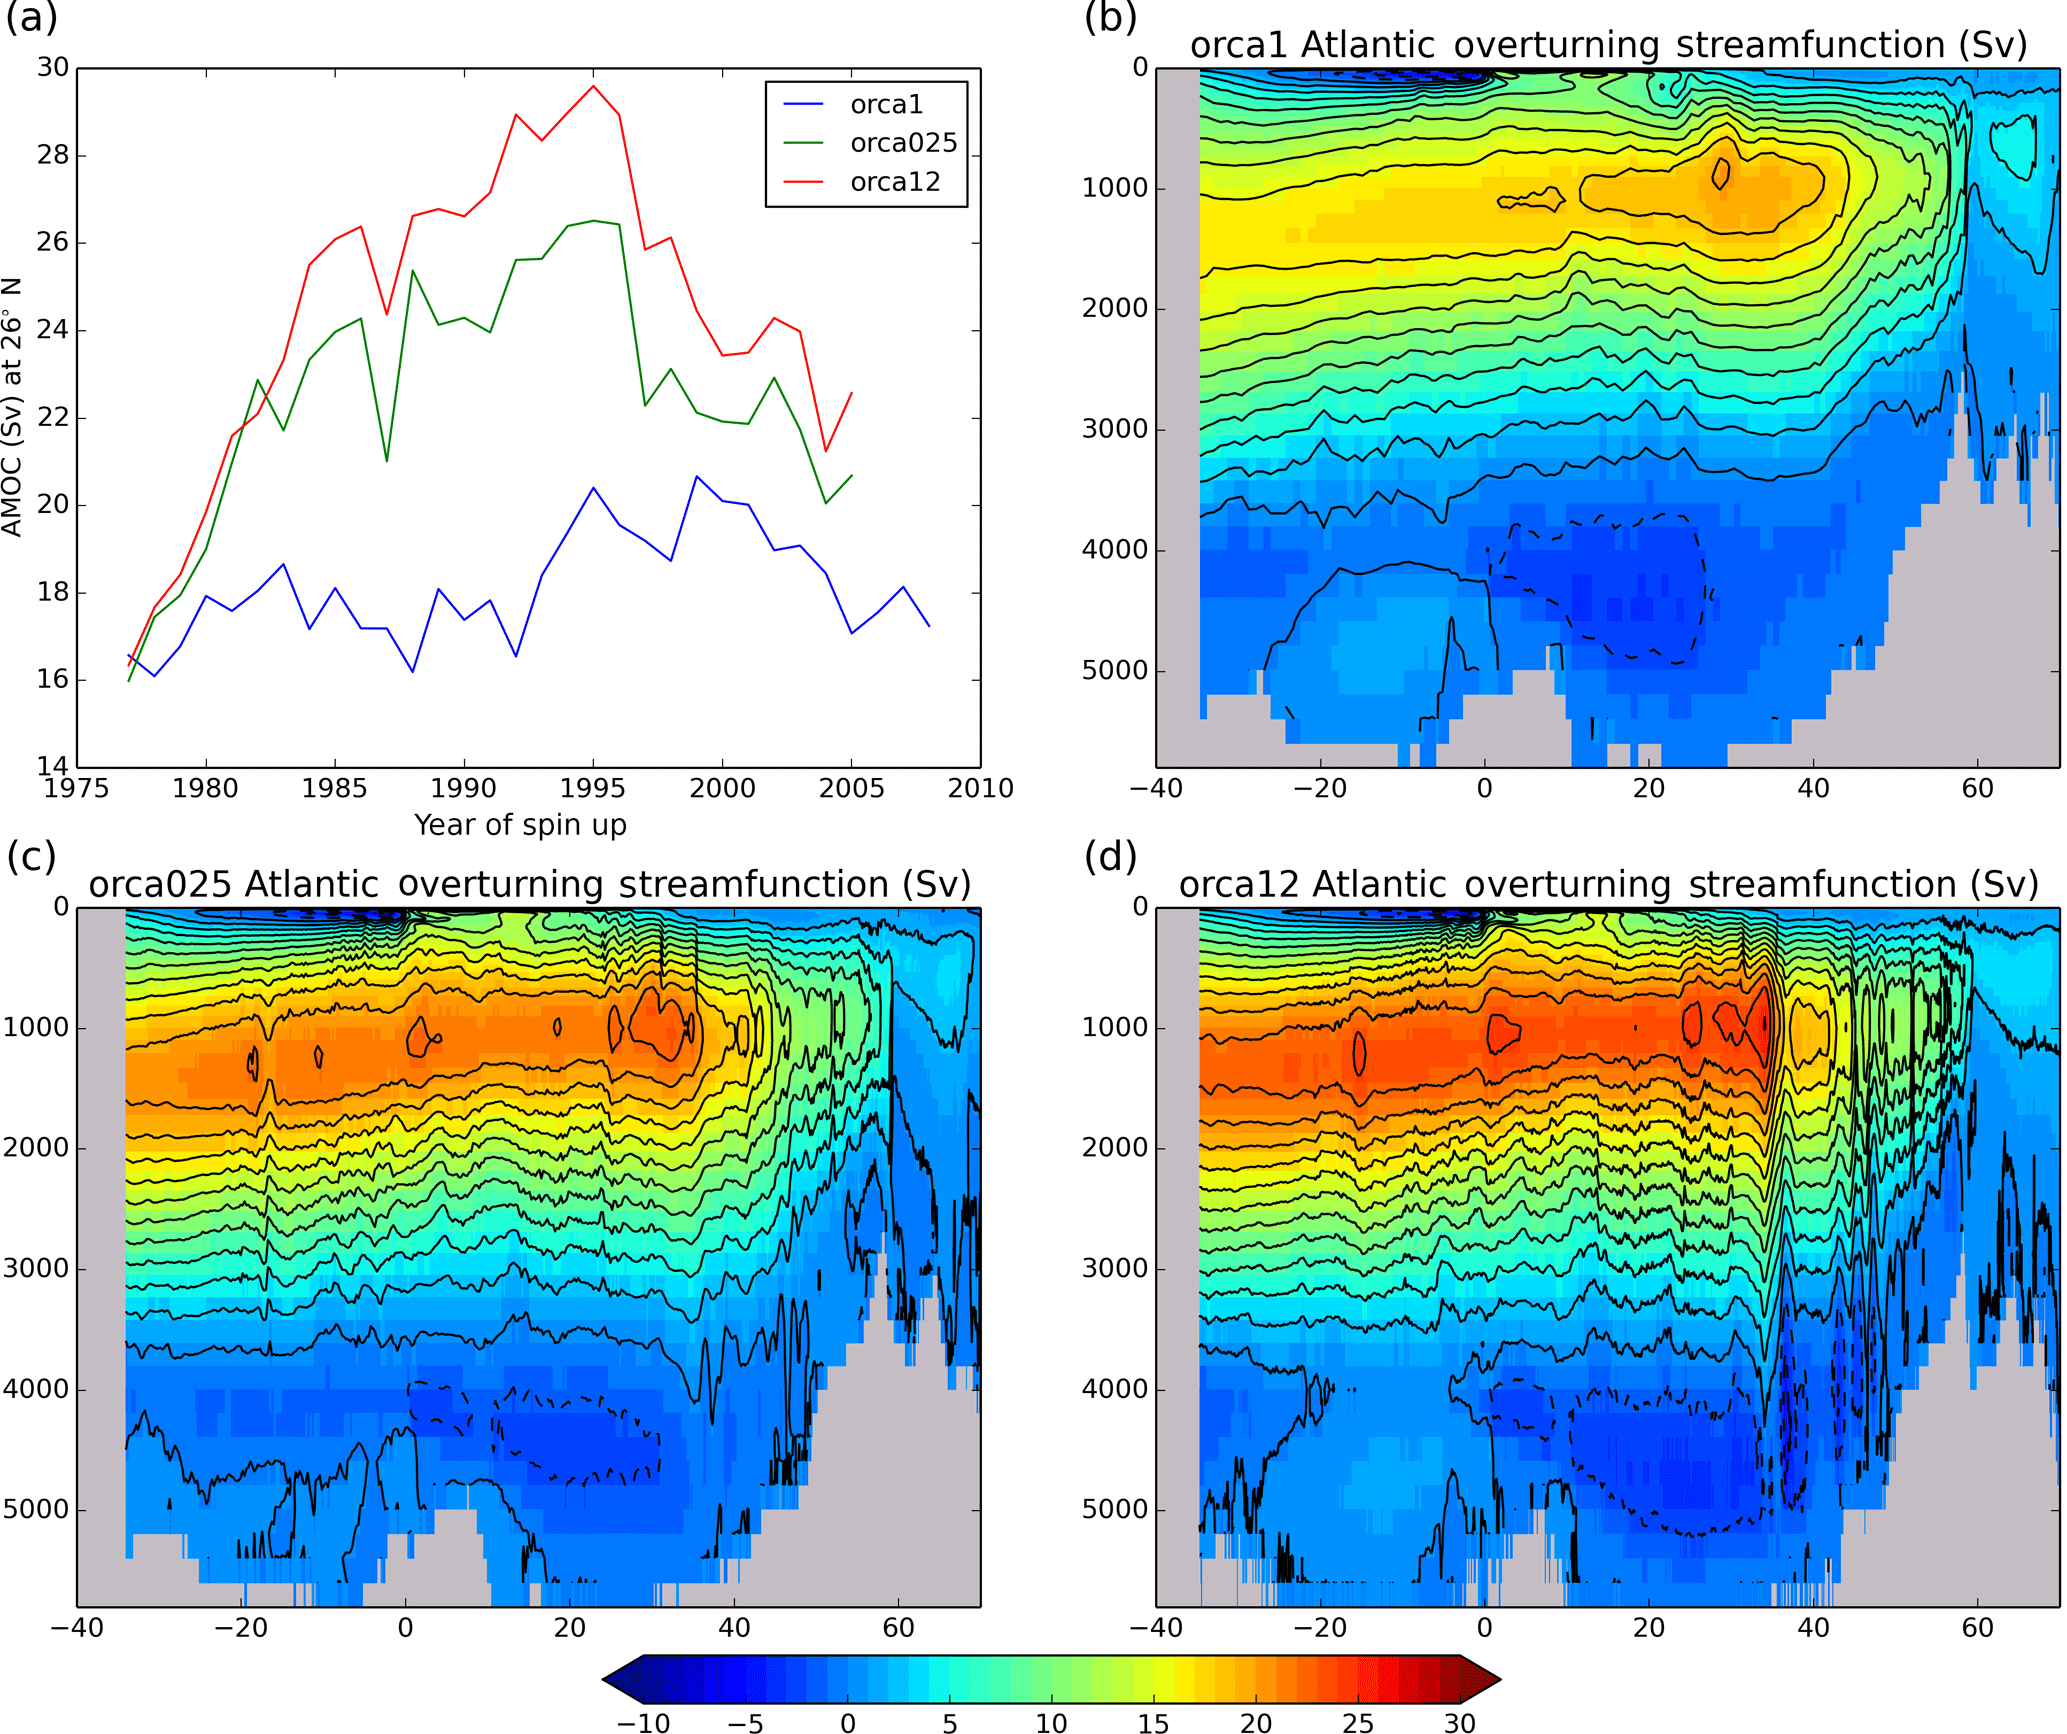
Figure 17Cross-resolution results: Atlantic overturning streamfunction. (a) Time series of annual-mean AMOC at 26∘ N for 1976–2005; (b–d) AMOC (Sv) averaged over the third decade of the spin-up (1996–2005). The line contours are plotted every 2 Sv.
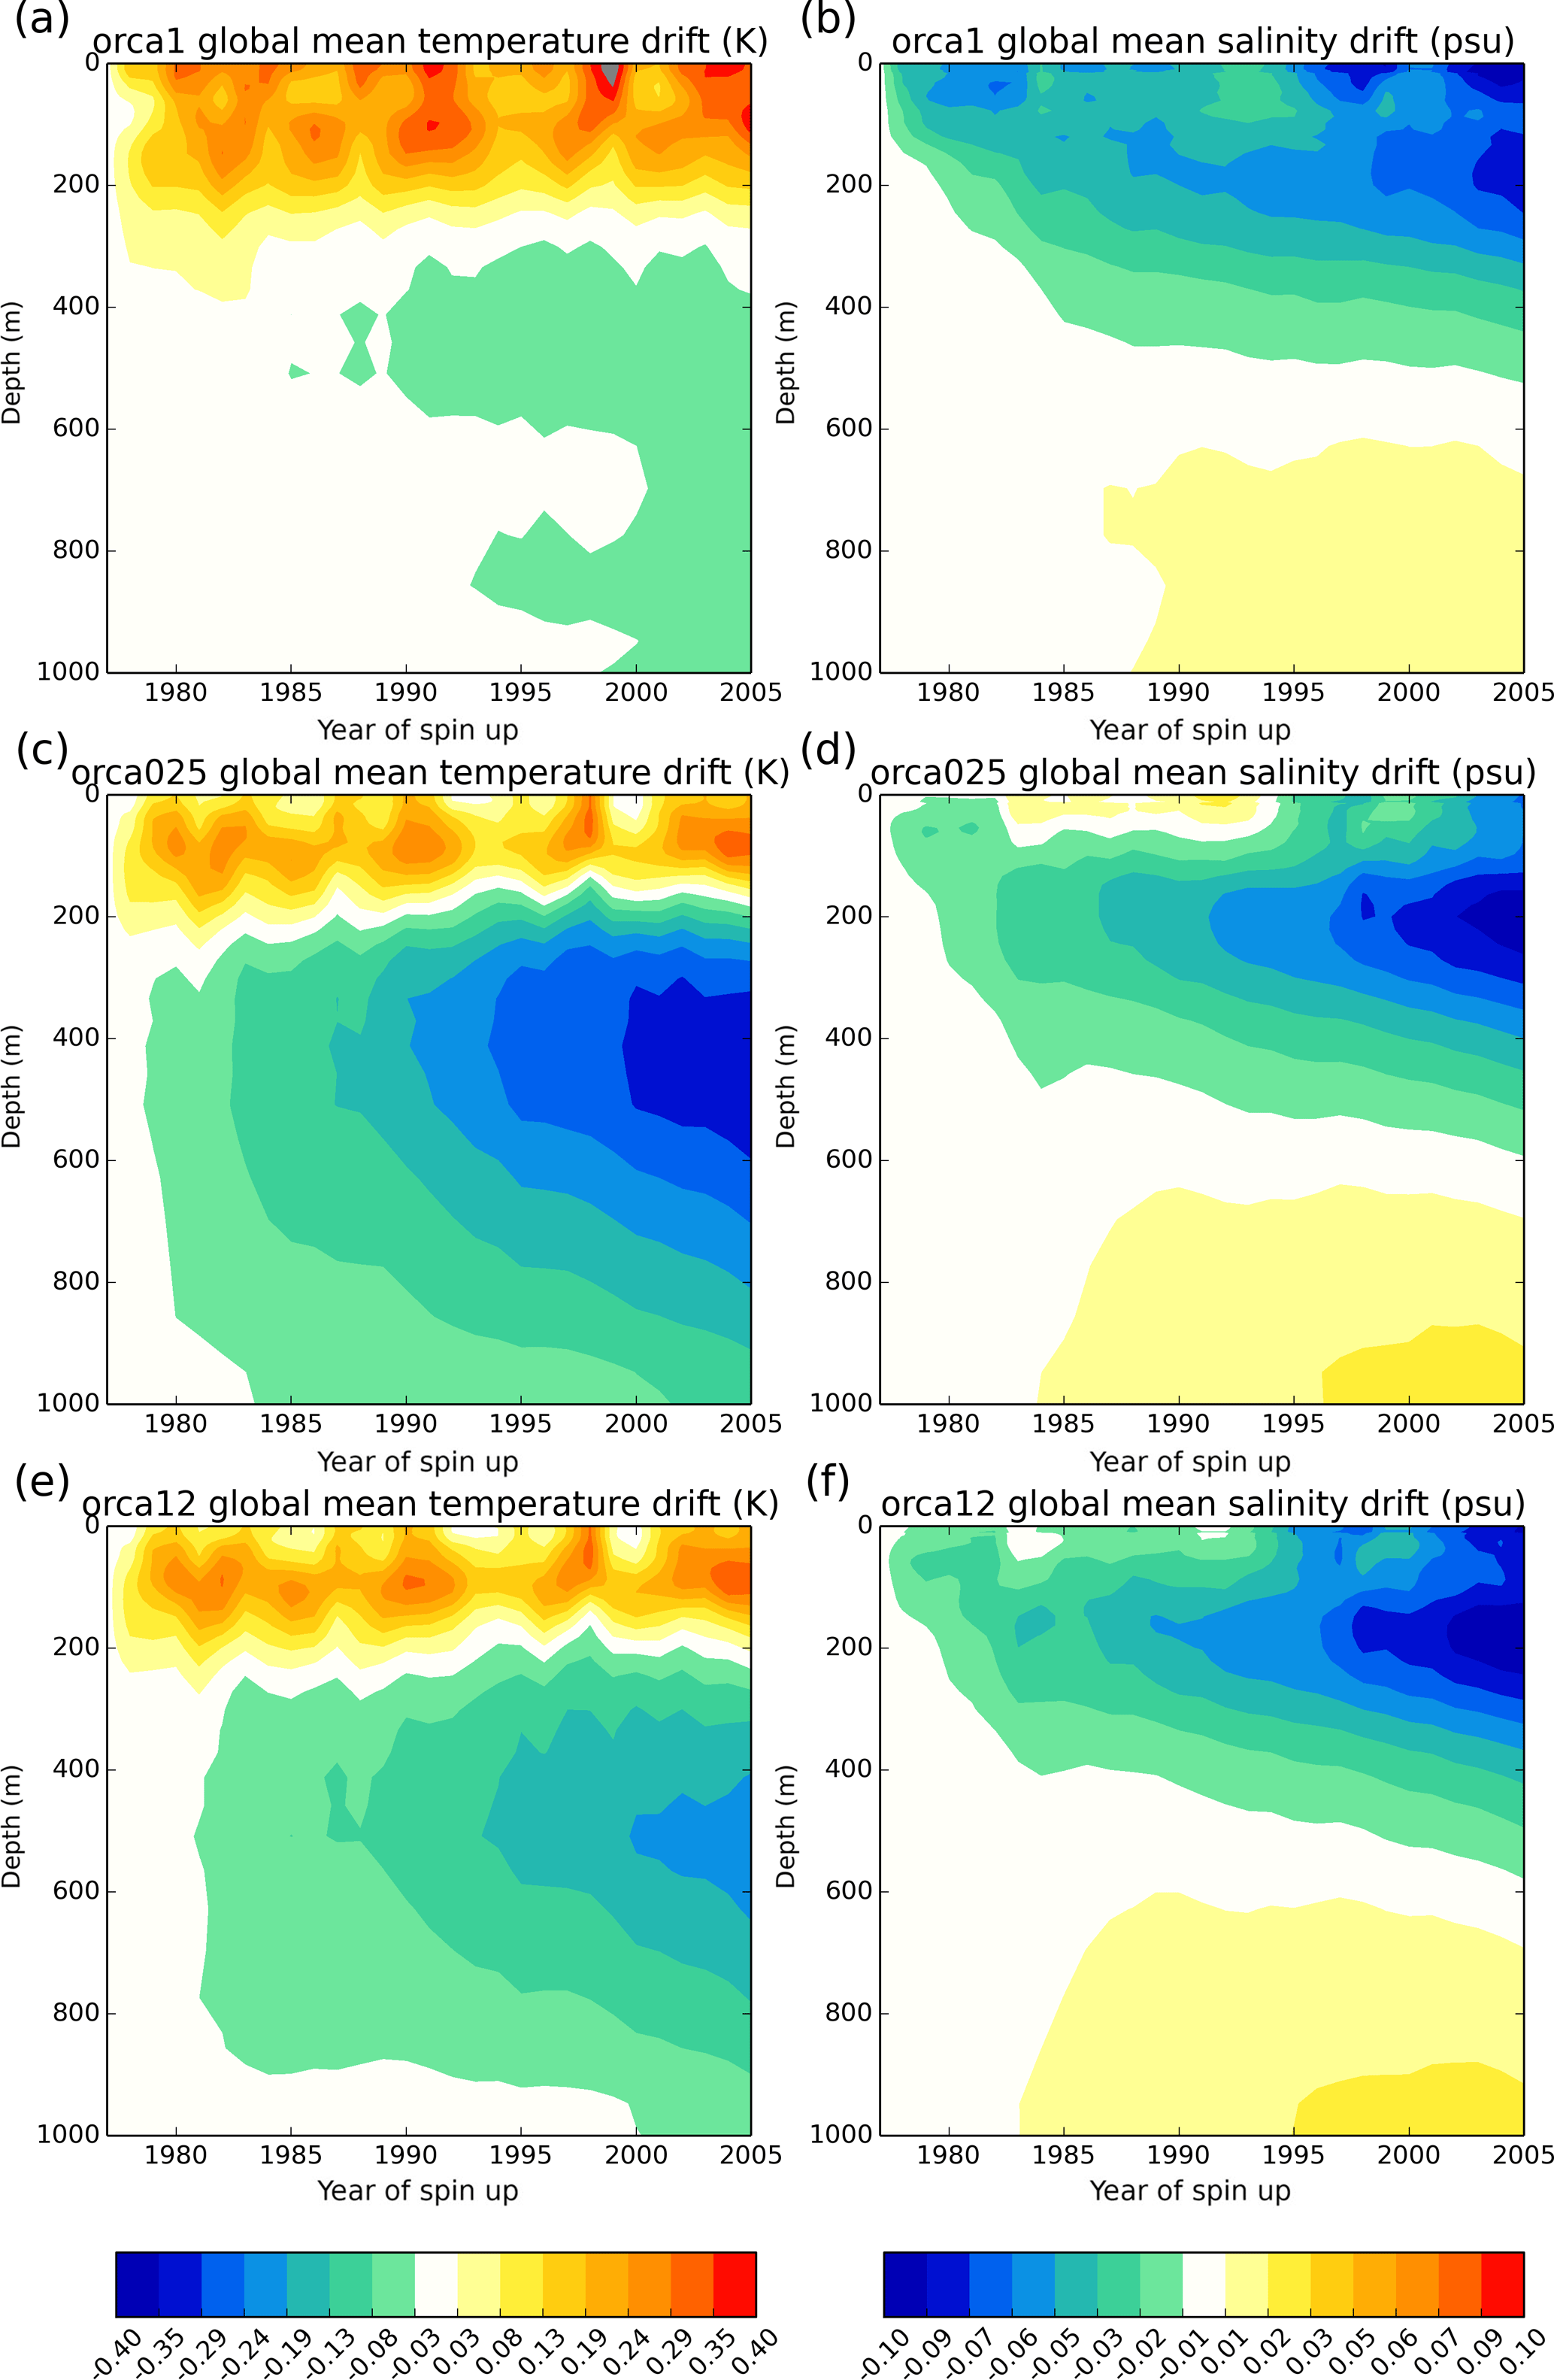
Figure 18Cross-resolution results: (a, c, e) global-mean model potential temperature drift from initial conditions (K); (b, d, f) global-mean model salinity drift from initial conditions (psu).
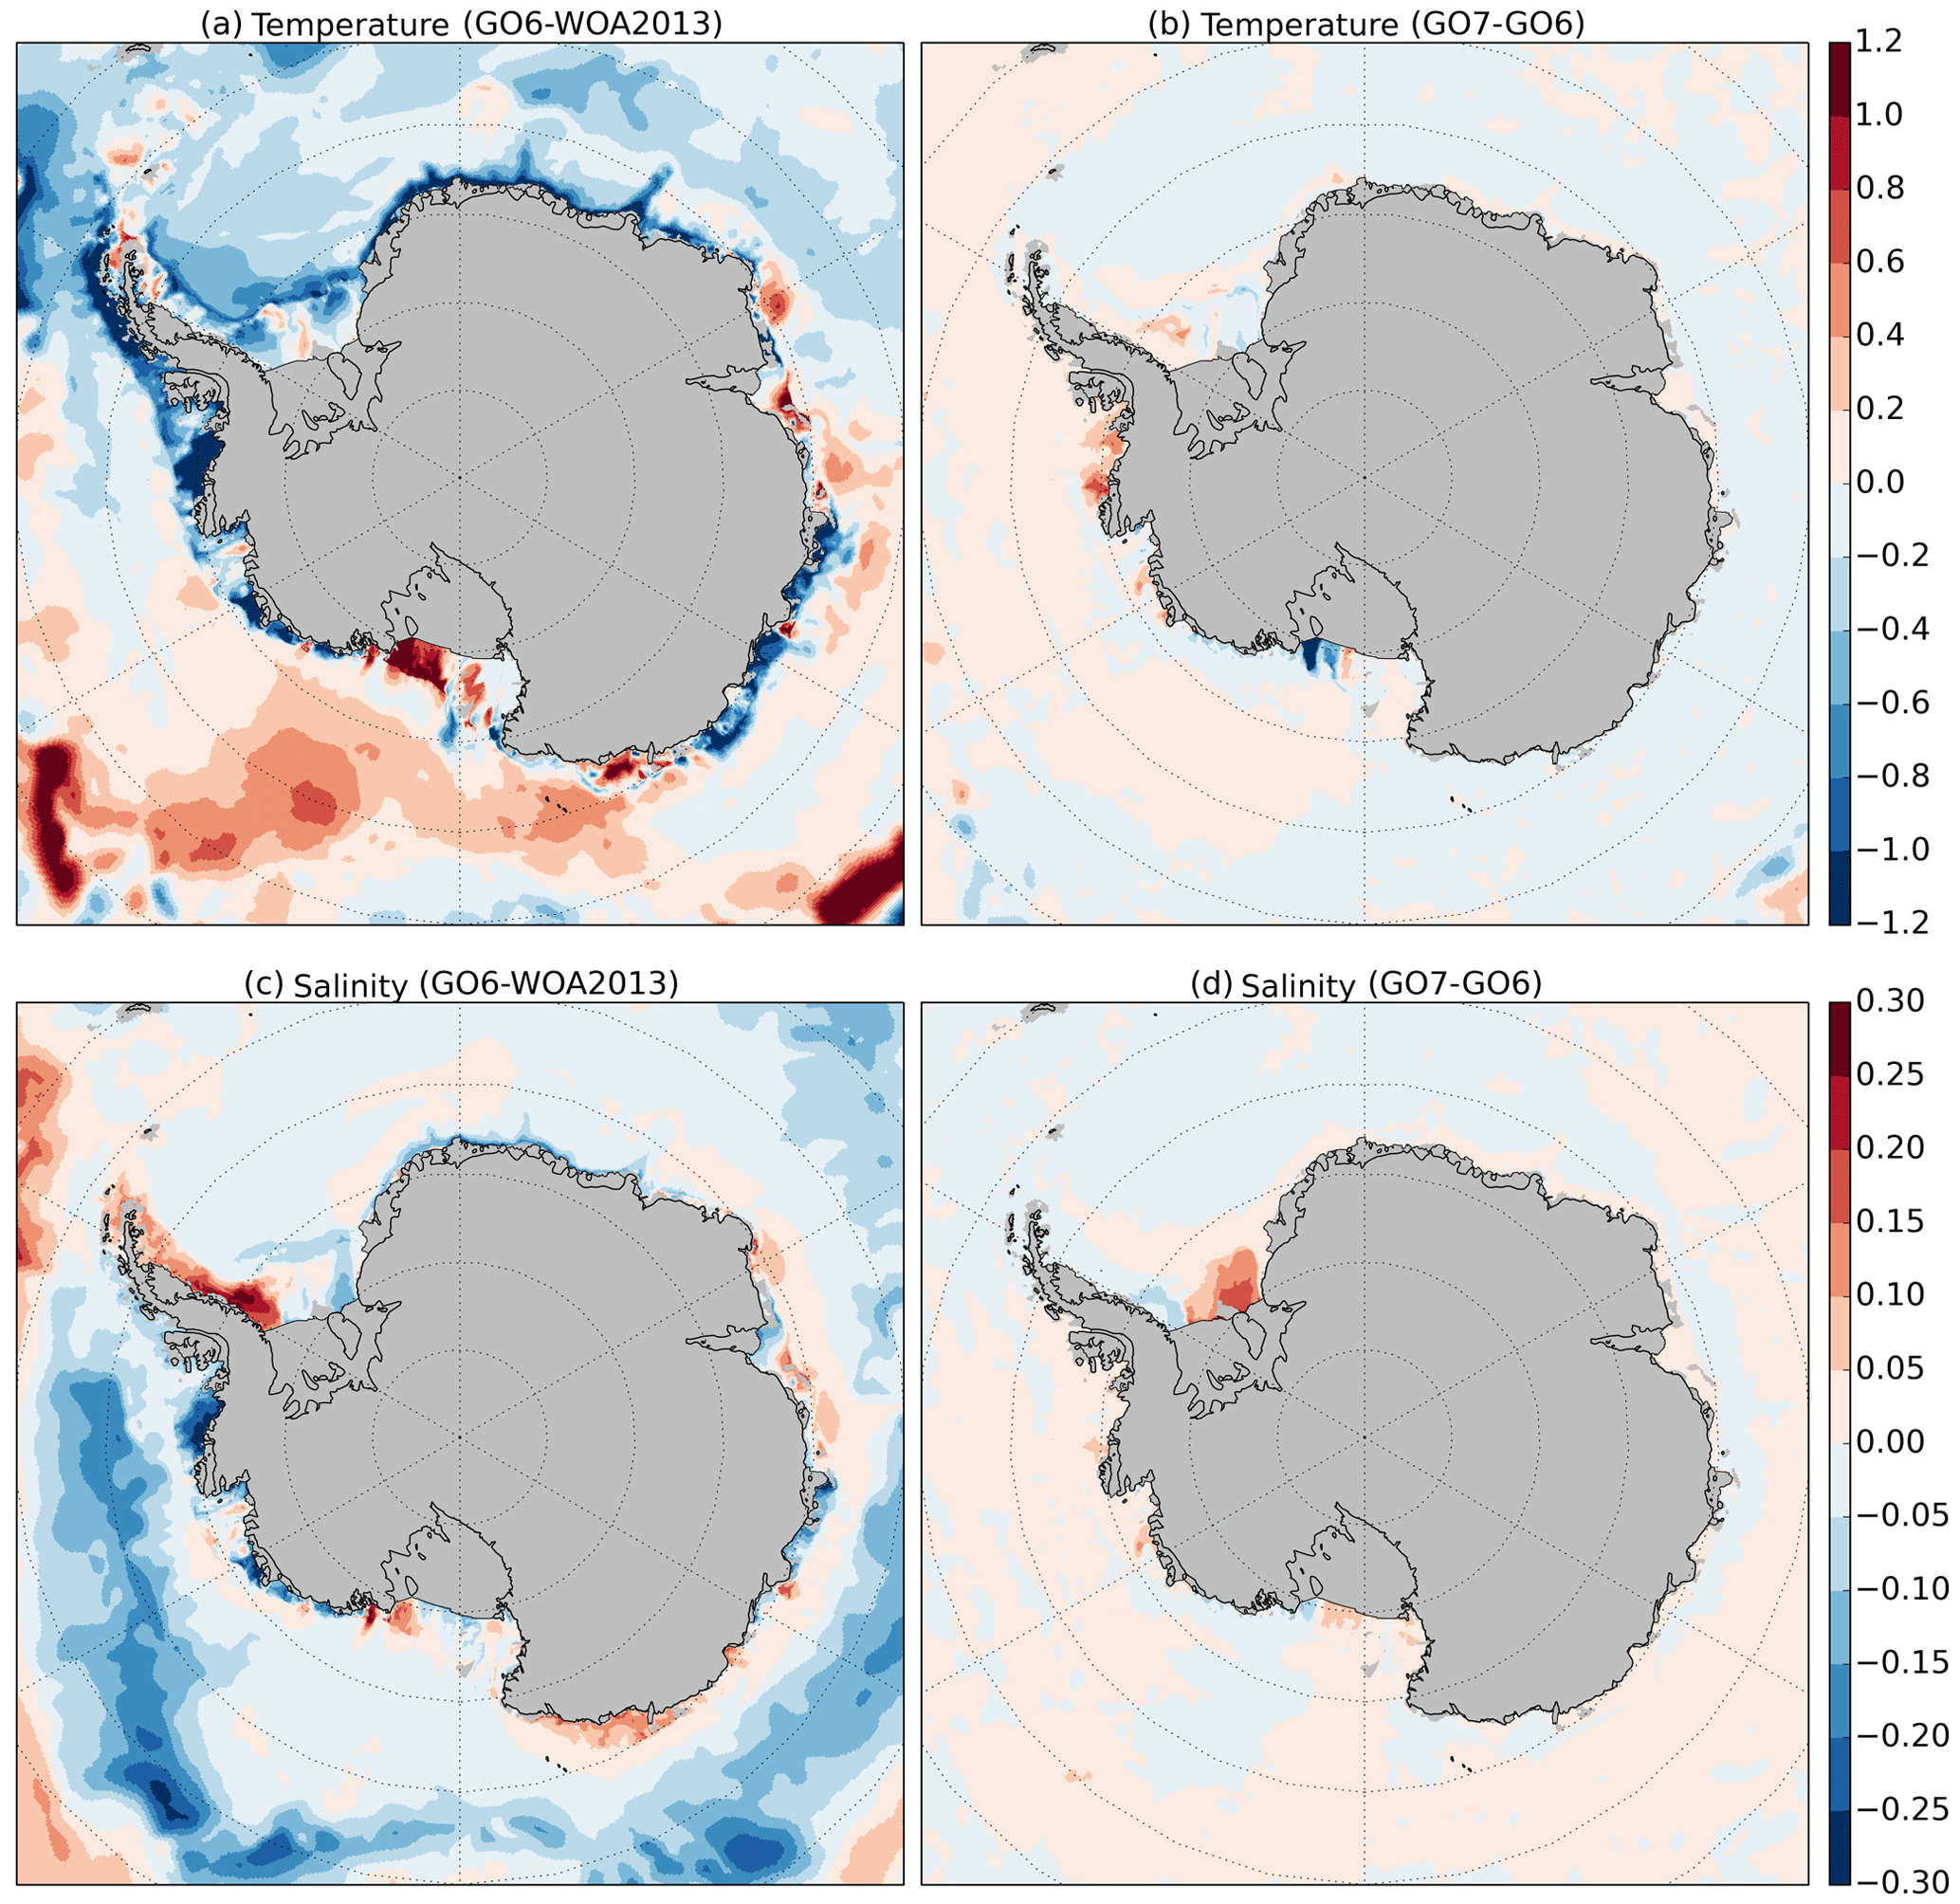
Figure 19Maps of potential temperature (K) and salinity (psu) averaged between 300 and 1000 m. (a, c) Differences between GO6 and WOA2013 (Locarnini et al., 2013; Zweng et al., 2013) data; (b, d) differences between GO7 and GO6. Grey shading represents areas covered by ice shelves or ice sheets, or with bathymetry shallower than 300 m.
In this section we present selected results from the hierarchy of GO6 models.
The large-scale SST biases and SSS biases (Fig. 16) are strikingly similar in most respects for the 1, 1∕4 and resolutions. In a forced model the near-surface fields are strongly constrained by the atmospheric forcing fields and so the similarity is perhaps unsurprising. The exceptions are in the active regions: the western boundary currents and the ACC, where there are significant differences in the ocean currents, resulting in different heat and salt distributions. The most notable example is in the region of the Gulf Stream Extension and the Grand Banks. In the ORCA1 model, the Gulf Stream Extension fails to be deflected northwards around the Grand Banks and continues in a more zonal path resulting in a strong cold and fresh bias due to the lack of advection of warm, salty water from the south. This is a well-known issue in non-eddy-permitting models (e.g. Zhang and Vallis, 2007). By contrast the steering of the Gulf Stream Extension is improved in ORCA025 and ORCA12 and these models tend to have warm, salty biases in this region. Other regions where there are significant differences include the Brazil–Falklands Confluence Zone and the Zapiola Gyre, and the Kuroshio Extension.
The spin-up of the Atlantic meridional overturning circulation (AMOC) is shown in Fig. 17, together with the mean AMOC for the third decade of the integration. In the three decades of integration there is a marked difference in the behaviour between ORCA1 and the two higher-resolution models. The AMOC at 26∘ N in ORCA1 is between 16 and 18 Sv for the first 15 years and then peaks at 20 Sv in the 1990s. In ORCA025 and ORCA12 the AMOC at 26∘ N increases rapidly over the first two decades to a peak of 26 Sv in ORCA025 and 30 Sv in ORCA12, and subsequently decreases in both models. For comparison, observation-based estimates of the AMOC during the period between April 2004 and October 2012 yield a time-mean value of 17.2 Sv with an estimated annual-mean rms uncertainty of 0.9 Sv (McCarthy et al., 2015). The ORCA025 and ORCA12 peak values are well outside the range of the RAPID observations, and are still too large at the end of the integration. This behaviour in the initial spin-up period is specific to forced integrations; the spin-up of a coupled model using a similar ORCA025 configuration and similar initial conditions does not show this large peak (Tim Graham, personal communication, 2017).
ORCA025 and ORCA12 exhibit very deep wintertime mixed layer depths and a gradual salinification of the water masses in the central Labrador Sea over this period (not shown), neither of which is present to the same degree in the ORCA1 integration. Danabasoglu et al. (2014) show that the strength of the AMOC is well correlated with the depth of the wintertime mixed layers in the Labrador Sea across a range of models forced with the CORE2 forcing set. The models in their study which have the deepest mixed layers also have a salty bias in the Labrador Sea, which may be the cause of the deep mixed layers. It seems likely that the large AMOC values in the higher resolution models in the present study are linked to the salinification and deep wintertime mixing in the Labrador Sea. Treguier et al. (2005) describe the salinification of the Labrador Sea in the early spin-up of a range of forced models and ascribe this to erroneous salt transports by the ocean currents, either in the main subpolar gyre or in the East Greenland Coastal Current.
In Fig. 18 we show globally integrated temperature and salinity drifts from initial conditions for the three models calculated from annual-mean fields. Because the models are initialized and evaluated against the same temperature and salinity climatologies, this is another way of looking at the evolution of the model biases against climatology. The temperature drifts across the three models all show a warming in the top 200 m and a cooling in deeper waters centred at about 400 m. The near-surface warming appears to equilibrate quickly but the subsurface cooling in ORCA025 and ORCA12 is still drifting after 30 years of integration. The cooling is much smaller in ORCA1 and it is not clear if it is showing an ongoing drift. For the salinity all three models show a freshening centred at about 200 m which is not equilibrated after 30 years of integration. There is also a deeper salinification trend centred at about 1000 m.
The subsurface cooling and freshening trends in the global mean are dominated by cooling and freshening trends in the tropical and subtropical Atlantic and Pacific (not shown). All three models show a similar cooling and freshening centred at about 200 m in the tropical Pacific. The deep salinification at 1000 m is due to increasing salinity of the Mediterranean Outflow Water in the North Atlantic. The differences in the global mean between the three models are largely due to different behaviour in the tropical and subtropical Atlantic, where the ORCA1 model shows a moderate cooling centred at 500 m, but the ORCA025 and ORCA12 show a substantial cooling and freshening of the top 1000 m, which is more marked in ORCA025. It is possible that this is linked to the different AMOC behaviour between the models in this period, with a much more intense AMOC in ORCA025 and ORCA12 resulting in colder and fresher water being advected from the south. The shortness of the integrations means we cannot draw conclusions about long-term drifts. Nevertheless the substantial differences in the drifts in this initial spin-up period at different resolutions demonstrate the potential of differing ocean model responses to the same flux forcing to result in very different heat and salt distributions.
The single difference between GO6 and GO7 is how the ice shelf melting is distributed. In GO6, the ice shelf melting is spread in depth along the ice shelf front (similar to simulation R_PAR in Mathiot et al., 2017). In GO7, the ice shelf cavities are opened and the ice shelf melting is prescribed at the ice shelf–ocean interface (similar to simulation R_ISF in Mathiot et al., 2017). The total fresh water from ice shelf melt is the same in GO6 and GO7 for each ice shelf. The melt pattern used in GO7 is the one described in Mathiot et al. (2017). The bathymetry and the ice shelf draught beneath the ice shelf comes from BEDMAP2 (Fretwell et al., 2013) as in Mathiot et al. (2017). As for the GO6 results, the results discussed here are based on the climatology of the last 10 years of the integrations (1996–2005).
In the open ocean as well as on most of the East Antarctic and West Antarctic continental shelves, the temperature and salinity properties are similar in both GO6 and GO7 simulations (Fig. 19b, d). On the Filchner and Ronne continental shelf, the ocean circulation over the shelf is very different in GO7 to the one simulated in GO6 because of the new pathway beneath the ice shelves. The circulation of High Salinity Shelf Water beneath the ice shelf leads to a different salinity distribution over the Filchner shelf. The salinity gradient between the east and west side is decreased and improved. The shelf waters are saltier on the east side due to the outflow of Ice Shelf Water from the Ronne Ice Shelf cavity, but are fresher on the west side. However, overall the Filchner shelf is still too salty.
The opening of ice shelf cavities also leads to some modification in the intrusion of Circumpolar Deep Water (CDW) over the Ross and Bellingshausen shelves. Over the Ross continental shelf, the intrusion of CDW onto the east side of the Ross continental shelf is weaker in GO7 and the shelf is colder. The intrusion of CDW is not realistic (Fig. 19a). In the Bellingshausen Sea, the opening of the ice shelf cavities leads to a slight warming of the continental shelf (Fig. 19b, d). However, the West Antarctic shelf is still too cold and too fresh compared to the observations (Fig. 19a).
GO6 and GO7 are the latest versions of the UK Global Ocean configuration, developed as a collaboration between the Met Office, the National Oceanography Centre and the British Antarctic Survey. They will be used in a variety of applications, notably in coupled mode in the UK contributions to CMIP6, and in associated OMIP simulations. GO6 and GO7 are developments of the GO5 configuration described by Megann et al. (2014), with updates to the core dynamics, some tuning of mixing coefficients and an improved representation of the cryosphere, with the capability of representing circulation and melting under ice shelves and the introduction of interactive icebergs. Whereas GO5 was defined for just one horizontal grid at a nominal resolution, GO6 is a largely traceable hierarchy of three horizontal resolutions at nominal 1, 1∕4 and resolutions. GO7 currently only exists at resolution.
We have presented results from 30-year integrations forced with the CORE2 data set. Comparing the GO6 and GO5 configurations at resolution, GO6 has deeper summertime mixed layers in the Southern Ocean and cooler and fresher surface waters south of the ACC. These changes reduce mixed layer depth biases against the de Boyer Montégut et al. (2004) data set and reduce near-surface temperature and salinity biases measured against the ESA CCI and EN4 data sets. The simulation of sea ice in the Southern Ocean is also improved with greater extent of summertime sea ice (which is nevertheless still too small compared to observations), and year-round thicker sea ice. The improvements in the mixed layer depth, the sea ice and the temperature fields in the Southern Ocean are mainly driven by the tuning of the near-surface vertical mixing, with the improvement to the near-surface salinity field attributable to the reduction of the coefficient of isopycnal mixing.
There is a subsurface cooling in the tropics between 100 and 200 m going from GO5 to GO6, which has mixed impact on the temperature biases. This is attributable to the change to the Hollingsworth et al. (1983) formulation for the momentum advection term. In the Northern Hemisphere, the reduction of the isopycnal mixing coefficient exacerbates warm and cold biases in the western and eastern subpolar gyre and freshens the near-surface waters in the Arctic, which worsens fresh biases in the Beaufort Gyre but mitigates salty biases near the Siberian and Canadian coasts. The timing of the seasonal cycle of the sea ice in the Arctic is changed slightly with faster melting in the spring and faster ice formation in the autumn, but similar minimum and maximum ice volumes. The changes to the sea ice simulation appear to be driven by changes to the sea ice model formulation rather than by changes in the ocean model simulation.
Selected results from forced integrations with the hierarchy of resolutions of GO6 have been presented. The different resolutions span the transition from non-eddy-resolving to (partially) eddy-resolving models and show quite different near-surface horizontal circulations, resulting in large differences in the temperature and salinity fields in active regions such as the western boundary currents. There are large differences in the initial adjustment of the AMOC which are possibly linked to differences in the deep drifts in the Atlantic.
The opening of the ice shelf cavities in GO7 leads to localized impacts on the temperature and salinity fields. There is a better distribution of the High Salinity Shelf Water over the Filchner continental shelf and the opening of the cavities tends to decrease the extension of the Circumpolar Deep Water over Ross Sea and tends to increase it over Bellingshausen Sea.
This paper has described results from integrations forced with the CORE2 atmospheric forcing data set (Large and Yeager, 2009). As described in Griffies et al. (2009), two major sources of error in forced integrations are errors in the atmospheric forcing fields and errors associated with the use of mixed boundary conditions, whereby the sea surface temperature field is constrained more strongly than the sea surface salinity field. Because of the different atmospheric forcing errors, the same ocean model configuration will generally exhibit different biases in the context of a coupled model than in the context of a forced integration (as seen for example in Sect. 4.4). The forced configuration described here is used for initial development and exploration of sensitivities since it is less resource-intensive than the coupled model. The resulting prototype configuration is then incorporated in the coupled model where further tuning of ocean parameters may take place. The choice of the isopycnal diffusion coefficient discussed in Sect. 4.4 is an example of a parameter tuning driven by the coupled model results. Since GO6/GO7 is intended for use in both coupled and forced configurations, any tuning is a necessary compromise, but we have generally prioritized the coupled model and accepted that the tunings may be less than optimal for the forced model. The results presented in this paper are from the final configuration as used in the coupled model. An example of where this is slightly non-optimal in the forced context is the thickness of the Arctic sea ice which compares well with observations in the coupled GC3.1 model (Ridley et al., 2018), but is too thin in the forced model, especially in the boreal summer (Fig. 13).
The next round of development (GO8) will focus on near-surface vertical mixing, overflows in the North Atlantic and spurious numerical mixing.
The vertical mixing closure in NEMO under-represents several processes, including Langmuir turbulence (Grant and Belcher, 2009; Belcher et al., 2012) and mixing due to shear spiking at the mixed layer base (Large and Crawford, 1995; Grant and Belcher, 2011). These two processes in particular are thought to be important for near-surface mixing globally (Belcher et al., 2012) and so the NEMO vertical mixing closure is underestimating important sources of mixing. This manifests in particular as too shallow summertime mixed layers in the Southern Ocean. The Rodgers et al. (2014) scheme is an ad hoc attempt to compensate for this missing mixing. The UK OSMOSIS project has attempted to characterize near-surface oceanic mixing more accurately through an observational campaign and a new mixing scheme based on the results of large eddy simulations, which includes the effect of Langmuir turbulence. We plan to incorporate this more physically based scheme in GO8.
The poor representation of dense overflow currents is a long-standing issue in z-coordinate models, in which the stepwise bathymetry causes density currents to mix too much with the ambient water masses. The bottom boundary layer scheme does not appear to substantially improve the overflows, possibly because, as noted by Beckmann and Döscher (1997), it does not work well with a stretched vertical grid. The representation of overflows is known to improve as the horizontal and vertical resolutions increase. Winton et al. (1998) suggest that to adequately resolve the Denmark Strait overflow a horizontal resolution of 3–5 km and a vertical resolution of 30–50 m are required. These are significantly higher resolutions than the global models described in this paper. In developing GO8 we intend to experiment with embedding two-way nests covering the important overflows as well as to explore alternative vertical coordinates, such as the s coordinate which better represents the density currents.
There are more general issues with spurious numerical mixing in z-coordinate models, which tend to undermine the models' ability to preserve water masses over time (Griffies et al., 2000; Ilıcak et al., 2012; Megann, 2018). Another focus of the development in GO8 is to explore ways of reducing this mixing, with one option being the formulation of vertical levels due to Leclair and Madec (2011).
The user manuals for the NEMO and CICE modelling codes are available online at
-
https://www.nemo-ocean.eu/bibliography/documentation (last access: 6 August 2018)
-
https://github.com/CICE-Consortium/CICE-svn-trunk/blob/master/cicedoc/cicedoc.pdf (last access: 6 August 2018)
Namelist settings for the GO6 and GSI8.1 configurations are included in the Supplement.
The ocean model code is available from the NEMO website (http://forge.ipsl.jussieu.fr/nemo/wiki/Users, last access: 6 August 2018) under the CeCILL free software license (http://www.cecill.info/, last access: 6 August 2018). On registering, individuals can access the Fortran code using the open-source Subversion software (http://subversion.apache.org/, last access: 6 August 2018). The base code used for the integrations presented in this paper is in revision 7750 of the following branch:
-
branches/UKMO/dev_r5518_GO6_package
This consists of the NEMO v3.6 release with the addition of GO6-specific changes. In addition the following branch at revision 6568 is required for the ORCA12 configuration:
-
branches/UKMO/dev_5518_shlat2d
The sea ice model code is freely available from the Met Office Science Repository (https://code.metoffice.gov.uk/trac/cice, last access: 6 August 2018) under the CICE copyright agreement (https://code.metoffice.gov.uk/trac/cice/wiki/licence, last access: 6 August 2018). As for the NEMO repository, registration is required and then the Fortran code is available using subversion. The code used for the integrations presented in this paper consisted of a number of branches of the CICE code. These branches have subsequently been merged into a single package branch at revision 235:
-
branches/pkg/Config/vn5.2.1_GSI8.1_package_branch
Preprocessing keys required for building GO6-GSI8.1 are listed in the Supplement.
Input data files required to run the simulations described in this paper, and results from the simulations, are archived at the Met Office and available for research use through the Centre for Environmental Data Analysis JASMIN platform (http://www.jasmin.ac.uk/, last access: 6 August 2018); please contact the authors for details.
The supplement related to this article is available online at: https://doi.org/10.5194/gmd-11-3187-2018-supplement.
DS prepared the manuscript with contributions from co-authors. DS, AB, PM and AM performed and analysed the main assessment integrations. YA, EB, DC, TG, HH, PH, TK, JR and BS were involved in the development of the GO6 and GSI8.1 configurations, performed sensitivity experiments and assisted with the evaluation of the main integrations.
Met Office authors acknowledge support by the Joint DECC/Defra Met Office
Hadley Centre Climate Programme (GA01101), the Ministry of Defence, the
Public Weather Service and from the Copernicus Marine Environment Monitoring
Service. NOC authors would like to acknowledge the support of NERC national
capability funding. We acknowledge use of the MONSooN system, a collaborative
facility supplied under the Joint Weather and Climate Research Programme, a
strategic partnership between the Met Office and the Natural Environment
Research Council.
Edited by: Didier
Roche
Reviewed by: two anonymous referees
Adcroft, A. and Campin, J.-M.: Rescaled height coordinates for accurate representation of free-surface flows in ocean circulation models, Ocean Model., 7, 269–284, https://doi.org/10.1016/j.ocemod.2003.09.003, 2004. a, b
Adcroft, A., Hill, C., and Marshall, J.: Representation of Topography by Shaved Cells in a Height Coordinate Ocean Model, Mon. Weather Rev., 125, 2293–2315, https://doi.org/10.1175/1520-0493(1997)125<2293:ROTBSC>2.0.CO;2, 1997. a
Amante, C. and Eakins, B. W.: ETOPO1 1 Arc-Minute Global Relief Model: Procedures, Data Sources and Analysis, NOAA Technical Memorandum NESDIS NGDC-24, 19 pp., 2009. a
Arakawa, A.: Computational design of long-term numerical integration of the equations of fluid motion, J. Comput. Phys., 1, 119–143, 1966. a
Arakawa, A. and Lamb, V. R.: A Potential Enstrophy and Energy Conserving Scheme for the Shallow Water Equations, Mon. Weather Rev., 109, 18–36, https://doi.org/10.1175/1520-0493(1981)109<0018:APEAEC>2.0.CO;2, 1981. a, b
Arndt, J. E., Schenke, H. W., Jakobsson, M., Nitsche, F. O., Buys, G., Goleby, B., Rebesco, M., Bohoyo, F., Hong, J., Black, J., Greku, R., Udintsev, G., Barrios, F., Reynoso-Peralta, W., Taisei, M., and Wigley, R.: The International Bathymetric Chart of the Southern Ocean (IBCSO) Version 1.0 – A new bathymetric compilation covering circum-Antarctic waters, Geophys. Res. Lett., 40, 3111–3117, https://doi.org/10.1002/grl.50413, 2013. a, b
Axell, L. B.: Wind-driven internal waves and Langmuir circulations in a numerical ocean model of the southern Baltic Sea, J. Geophys. Res.-Oceans, 107, 3204, https://doi.org/10.1029/2001JC000922, 2002. a
Barnier, B., Madec, G., Penduff, T., Molines, J.-M., Treguier, A.-M., Le Sommer, J., Beckmann, A., Biastoch, A., Böning, C., Dengg, J., Derval, C., Durand, E., Gulev, S., Remy, E., Talandier, C., Theetten, S., Maltrud, M., McClean, J., and De Cuevas, B.: Impact of partial steps and momentum advection schemes in a global ocean circulation model at eddy-permitting resolution, Ocean Dynam., 56, 543–567, https://doi.org/10.1007/s10236-006-0082-1, 2006. a, b
Beckmann, A. and Döscher, R.: A Method for Improved Representation of Dense Water Spreading over Topography in Geopotential-Coordinate Models, J. Phys. Oceanogr., 27, 581–591, https://doi.org/10.1175/1520-0485(1997)027<0581:AMFIRO>2.0.CO;2, 1997. a, b
Belcher, S. E., Grant, A. L. M., Hanley, K. E., Fox-Kemper, B., Van Roekel, L., Sullivan, P. P., Large, W. G., Brown, A., Hines, A., Calvert, D., Rutgersson, A., Pettersson, H., Bidlot, J.-R., Janssen, P. A. E. M., and Polton, J. A.: A global perspective on Langmuir turbulence in the ocean surface boundary layer, Geophys. Res. Lett., 39, L18605, https://doi.org/10.1029/2012GL052932, 2012. a, b
Bigg, G. R., Wadley, M. R., Stevens, D. P., and Johnson, J. A.: Modelling dynamics and thermodynamics of icebergs, Cold Reg. Sci. Technol., 26, 113–135, 1997. a
Bitz, C. M. and Lipscomb, W. H.: An energy-conserving thermodynamic model of sea ice, J. Geophys. Res.-Oceans, 104, 15669–15677, https://doi.org/10.1029/1999JC900100, 1999. a
Bitz, C. M., Holland, M. M., Weaver, A. J., and Eby, M.: Simulating the ice-thickness distribution in a coupled climate model, J. Geophys. Res.-Oceans, 106, 2441–2463, https://doi.org/10.1029/1999JC000113, 2001. a
Blockley, E. W., Martin, M. J., McLaren, A. J., Ryan, A. G., Waters, J., Lea, D. J., Mirouze, I., Peterson, K. A., Sellar, A., and Storkey, D.: Recent development of the Met Office operational ocean forecasting system: an overview and assessment of the new Global FOAM forecasts, Geosci. Model Dev., 7, 2613–2638, https://doi.org/10.5194/gmd-7-2613-2014, 2014. a
Bourdalle-Badie, R. and Treguier, A.-M.: A climatology of runoff for the global ocean-ice model ORCA025, Tech. Rep. MOO-RP-425-365-MER, Mercator-Ocean, 2006. a
Brown, A., Milton, S., Cullen, M., Golding, B., Mitchell, J., and Shelly, A.: Unified Modeling and Prediction of Weather and Climate: A 25-Year Journey, B. Am. Meteorol. Soc., 93, 1865–1877, https://doi.org/10.1175/BAMS-D-12-00018.1, 2012. a
Calvert, D. and Siddorn, J.: Revised vertical mixing parameters for the UK community standard configuration of the global NEMO ocean model, Technical Note 95, Met Office Hadley Centre, available at: https://www.metoffice.gov.uk/learning/library/publications/science/climate-science-technical-notes (last access: 6 August 2018), 2013. a
Craig, P. D. and Banner, M. L.: Modeling Wave-Enhanced Turbulence in the Ocean Surface Layer, Journal of Physical Oceanography, 24, 2546–2559, https://doi.org/10.1175/1520-0485(1994)024<2546:MWETIT>2.0.CO;2, 1994. a
Culverwell, I.: personal communication, 2009. a
Dai, A. and Trenberth, K. E.: Estimates of Freshwater Discharge from Continents: Latitudinal and Seasonal Variations, J. Hydrometeorol., 3, 660–687, https://doi.org/10.1175/1525-7541(2002)003<0660:EOFDFC>2.0.CO;2, 2002. a
Danabasoglu, G., Yeager, S. G., Bailey, D., Behrens, E., Bentsen, M., Bi, D., Biastoch, A., Böning, C., Bozec, A., Canuto, V. M., Cassou, C., Chassignet, E., Coward, A. C., Danilov, S., Diansky, N., Drange, H., Farneti, R., Fernandez, E., Fogli, P. G., Forget, G., Fujii, Y., Griffies, S. M., Gusev, A., Heimbach, P., Howard, A., Jung, T., Kelley, M., Large, W. G., Leboissetier, A., Lu, J., Madec, G., Marsland, S. J., Masina, S., Navarra, A., Nurser, A. G., Pirani, A., y Mélia, D. S., Samuels, B. L., Scheinert, M., Sidorenko, D., Treguier, A.-M., Tsujino, H., Uotila, P., Valcke, S., Voldoire, A., and Wang, Q.: North Atlantic simulations in Coordinated Ocean-ice Reference Experiments phase II (CORE-II), Part I: Mean states, Ocean Model., 73, 76–107, https://doi.org/10.1016/j.ocemod.2013.10.005, 2014. a
de Boyer Montégut, C., Madec, G., Fischer, A. S., Lazar, A., and Iudicone, D.: Mixed layer depth over the global ocean: An examination of profile data and a profile-based climatology, J. Geophys. Res.-Oceans, 109, C12003, https://doi.org/10.1029/2004JC002378, 2004. a, b, c, d, e, f
Drakkar: Drakkar Ocean, available at: https://www.drakkar-ocean.eu/, 2017. a
Ducousso, N., Sommer, J. L., Molines, J.-M., and Bell, M.: Impact of the “Symmetric Instability of the Computational Kind” at mesoscale- and submesoscale-permitting resolutions, Ocean Model., 120, 18–26, https://doi.org/10.1016/j.ocemod.2017.10.006, 2017. a, b
Dunstone, N., Smith, D., Scaife, A., Hermanson, L., Eade, R., Robinson, N., Andrews, M., and Knight, J.: Skilful predictions of the winter North Atlantic Oscillation one year ahead, Nat. Geosci., 9, 809–814, 2016. a
Eyring, V., Bony, S., Meehl, G. A., Senior, C. A., Stevens, B., Stouffer, R. J., and Taylor, K. E.: Overview of the Coupled Model Intercomparison Project Phase 6 (CMIP6) experimental design and organization, Geosci. Model Dev., 9, 1937–1958, https://doi.org/10.5194/gmd-9-1937-2016, 2016. a, b, c
Flocco, D., Feltham, D. L., and Turner, A. K.: Incorporation of a physically based melt pond scheme into the sea ice component of a climate model, J. Geophys. Res.-Oceans, 115, C08012, https://doi.org/10.1029/2009JC005568, 2010. a, b
Fretwell, P., Pritchard, H. D., Vaughan, D. G., Bamber, J. L., Barrand, N. E., Bell, R., Bianchi, C., Bingham, R. G., Blankenship, D. D., Casassa, G., Catania, G., Callens, D., Conway, H., Cook, A. J., Corr, H. F. J., Damaske, D., Damm, V., Ferraccioli, F., Forsberg, R., Fujita, S., Gim, Y., Gogineni, P., Griggs, J. A., Hindmarsh, R. C. A., Holmlund, P., Holt, J. W., Jacobel, R. W., Jenkins, A., Jokat, W., Jordan, T., King, E. C., Kohler, J., Krabill, W., Riger-Kusk, M., Langley, K. A., Leitchenkov, G., Leuschen, C., Luyendyk, B. P., Matsuoka, K., Mouginot, J., Nitsche, F. O., Nogi, Y., Nost, O. A., Popov, S. V., Rignot, E., Rippin, D. M., Rivera, A., Roberts, J., Ross, N., Siegert, M. J., Smith, A. M., Steinhage, D., Studinger, M., Sun, B., Tinto, B. K., Welch, B. C., Wilson, D., Young, D. A., Xiangbin, C., and Zirizzotti, A.: Bedmap2: improved ice bed, surface and thickness datasets for Antarctica, The Cryosphere, 7, 375–393, https://doi.org/10.5194/tc-7-375-2013, 2013. a
Gaspar, P., Gregoris, Y., and Lefevre, J.-M.: A simple eddy kinetic energy model for simulations of the oceanic vertical mixing: Tests at station Papa and long-term upper ocean study site, J. Geophys. Res.-Oceans, 95, 16179–16193, https://doi.org/10.1029/JC095iC09p16179, 1990. a
Gent, P. R. and Mcwilliams, J. C.: Isopycnal Mixing in Ocean Circulation Models, J. Phys. Oceanogr., 20, 150–155, https://doi.org/10.1175/1520-0485(1990)020<0150:IMIOCM>2.0.CO;2, 1990. a
Good, S. A., Martin, M. J., and Rayner, N. A.: EN4: quality controlled ocean temperature and salinity profiles and monthly objective analyses with uncertainty estimates, J. Geophys. Res.-Oceans, 118, 6704–6716, https://doi.org/10.1002/2013JC009067, 2013. a, b, c, d, e, f
Grant, A. L. M. and Belcher, S. E.: Characteristics of Langmuir Turbulence in the Ocean Mixed Layer, J. Phys. Oceanogr., 39, 1871–1887, https://doi.org/10.1175/2009JPO4119.1, 2009. a
Grant, A. L. M. and Belcher, S. E.: Wind-Driven Mixing below the Oceanic Mixed Layer, J. Phys. Oceanogr., 41, 1556–1575, https://doi.org/10.1175/JPO-D-10-05020.1, 2011. a
Gregg, M. C., Sanford, T. B., and Winkel, D. P.: Reduced mixing from the breaking of internal waves in equatorial waters, Nature, 422, 513–515, 2003. a
Griffies, S. M., Pacanowski, R. C., and Hallberg, R. W.: Spurious Diapycnal Mixing Associated with Advection in a z-Coordinate Ocean Model, Mon. Weather Rev., 128, 538–564, https://doi.org/10.1175/1520-0493(2000)128<0538:SDMAWA>2.0.CO;2, 2000. a
Griffies, S. M., Biastoch, A., Böning, C., Bryan, F., Danabasoglu, G., Chassignet, E. P., England, M. H., Gerdes, R., Haak, H., Hallberg, R. W., Hazeleger, W., Jungclaus, J., Large, W. G., Madec, G., Pirani, A., Samuels, B. L., Scheinert, M., Gupta, A. S., Severijns, C. A., Simmons, H. L., Treguier, A. M., Winton, M., Yeager, S., and Yin, J.: Coordinated Ocean-ice Reference Experiments (COREs), Ocean Model., 26, 1–46, https://doi.org/10.1016/j.ocemod.2008.08.007, 2009. a, b, c
Griffies, S. M., Winton, M., Anderson, W. G., Benson, R., Delworth, T. L., Dufour, C. O., Dunne, J. P., Goddard, P., Morrison, A. K., Rosati, A., Wittenberg, A. T., Yin, J., and Zhang, R.: Impacts on Ocean Heat from Transient Mesoscale Eddies in a Hierarchy of Climate Models, J. Climate, 28, 952–977, https://doi.org/10.1175/JCLI-D-14-00353.1, 2015. a
Griffies, S. M., Danabasoglu, G., Durack, P. J., Adcroft, A. J., Balaji, V., Böning, C. W., Chassignet, E. P., Curchitser, E., Deshayes, J., Drange, H., Fox-Kemper, B., Gleckler, P. J., Gregory, J. M., Haak, H., Hallberg, R. W., Heimbach, P., Hewitt, H. T., Holland, D. M., Ilyina, T., Jungclaus, J. H., Komuro, Y., Krasting, J. P., Large, W. G., Marsland, S. J., Masina, S., McDougall, T. J., Nurser, A. J. G., Orr, J. C., Pirani, A., Qiao, F., Stouffer, R. J., Taylor, K. E., Treguier, A. M., Tsujino, H., Uotila, P., Valdivieso, M., Wang, Q., Winton, M., and Yeager, S. G.: OMIP contribution to CMIP6: experimental and diagnostic protocol for the physical component of the Ocean Model Intercomparison Project, Geosci. Model Dev., 9, 3231–3296, https://doi.org/10.5194/gmd-9-3231-2016, 2016. a
Held, I. M. and Larichev, V. D.: A Scaling Theory for Horizontally Homogeneous, Baroclinically Unstable Flow on a Beta Plane, J. Atmos. Sci., 53, 946–952, https://doi.org/10.1175/1520-0469(1996)053<0946:ASTFHH>2.0.CO;2, 1996. a
Heuzé, C., Ridley, J. K., Calvert, D., Stevens, D. P., and Heywood, K. J.: Increasing vertical mixing to reduce Southern Ocean deep convection in NEMO3.4, Geosci. Model Dev., 8, 3119–3130, https://doi.org/10.5194/gmd-8-3119-2015, 2015. a
Hewitt, H. T., Roberts, M. J., Hyder, P., Graham, T., Rae, J., Belcher, S. E., Bourdallé-Badie, R., Copsey, D., Coward, A., Guiavarch, C., Harris, C., Hill, R., Hirschi, J. J.-M., Madec, G., Mizielinski, M. S., Neininger, E., New, A. L., Rioual, J.-C., Sinha, B., Storkey, D., Shelly, A., Thorpe, L., and Wood, R. A.: The impact of resolving the Rossby radius at mid-latitudes in the ocean: results from a high-resolution version of the Met Office GC2 coupled model, Geosci. Model Dev., 9, 3655–3670, https://doi.org/10.5194/gmd-9-3655-2016, 2016. a
Hollingsworth, A., Kållberg, P., Renner, V., and Burridge, D. M.: An internal symmetric computational instability, Q. J. Roy. Meteor. Soc., 109, 417–428, https://doi.org/10.1002/qj.49710946012, 1983. a, b, c, d, e, f, g
Hunke, E. C. and Dukowicz, J. K.: An Elastic–Viscous–Plastic Model for Sea Ice Dynamics, J. Phys. Oceanogr., 27, 1849–1867, https://doi.org/10.1175/1520-0485(1997)027<1849:AEVPMF>2.0.CO;2, 1997. a
Ilıcak, M., Adcroft, A. J., Griffies, S. M., and Hallberg, R. W.: Spurious dianeutral mixing and the role of momentum closure, Ocean Model., 45, 37–58, https://doi.org/10.1016/j.ocemod.2011.10.003, 2012. a
Ingleby, B. and Huddleston, M.: Quality control of ocean temperature and salinity profiles – historical and real-time data, J. Marine Syst., 65, 158–175, 2007. a
IOC, IHO and BODC: Centenary Edition of the GEBCO Digital Atlas, published on CD-ROM on behalf of the Intergovernmental Oceanographic Commission and the International Hydrographic Organization as part of the General Bathymetric Chart of the Oceans, British Oceanographic Data Centre, Liverpool, UK, 2003. a
Kjellsson, J., Holland, P. R., Marshall, G. J., Mathiot, P., Aksenov, Y., Coward, A. C., Bacon, S., Megann, A. P., and Ridley, J.: Model sensitivity of the Weddell and Ross seas, Antarctica, to vertical mixing and freshwater forcing, Ocean Model., 94, 141–152, https://doi.org/10.1016/j.ocemod.2015.08.003, 2015. a
Koch-Larrouy, A., Madec, G., Blanke, B., and Molcard, R.: Water mass transformation along the Indonesian throughflow in an OGCM, Ocean Dynam., 58, 289–309, 2008. a
Kuhlbrodt, T., Jones, C. G., Sellar, A., Hill, R., Stringer, M., Hewitt, H., Stirkey, D., Calvert, D., Blockley, E., Ridley, J., Copsey, D., Blaker, A., and Ineson, S.: The low-resolution version of HadGEM3 GC3.1: development and evaluation for global climate, J. Adv. Model. Earth Sy., in review, 2018. a
Large, W. and Yeager, S.: The global climatology of an interannually varying air–sea flux data set, Climate Dynam., 33, 341–364, https://doi.org/10.1007/s00382-008-0441-3, 2009. a, b, c, d
Large, W. G. and Crawford, G. B.: Observations and simulations of upper-ocean response to wind events during the Ocean Storms experiment, J. Phys. Oceanogr., 25, 2831–2852, https://doi.org/10.1175/1520-0485(1995)025<2831:OASOUO>2.0.CO;2, 1995. a
Leclair, M. and Madec, G.: z-Coordinate, an Arbitrary Lagrangian–Eulerian coordinate separating high and low frequency motions, Ocean Model., 37, 139–152, https://doi.org/10.1016/j.ocemod.2011.02.001, 2011. a
Locarnini, R. A., Mishonov, A. V., Antonov, J. I., Boyer, T. P., Garcia, H. E., Baranova, O. K., Zweng, M. M., Paver, C. R., Reagan, J. R., Johnson, D. R., Hamilton, M., and Seidov, D.: World Ocean Atlas 2013, Vol. 1: temperature, Tech. rep., edited by: Levitus, S. and Mishonov, A., NOAA Atlas NESDIS 74, 40 pp., available at: https://data.nodc.noaa.gov/woa/WOA13/DOC/woa13_vol1.pdf (last access: 6 August 2018), 2013. a
MacLachlan, C., Arribas, A., Peterson, K. A., Maidens, A., Fereday, D., Scaife, A. A., Gordon, M., Vellinga, M., Williams, A., Comer, R. E., Camp, J., Xavier, P., and Madec, G.: Global Seasonal forecast system version 5 (GloSea5): a high-resolution seasonal forecast system, Q. J. Roy. Meteor. Soc., 141, 1072–1084, https://doi.org/10.1002/qj.2396, 2015. a
Madec, G.: NEMO Ocean Engine, Tech. Rep. 27, Pole de modelisation de l'Institut Pierre-Simon Laplace, available at: https://www.nemo-ocean.eu/bibliography/documentation (last access: 6 August 2018), 2016. a, b, c, d, e, f
Marsh, R., Ivchenko, V. O., Skliris, N., Alderson, S., Bigg, G. R., Madec, G., Blaker, A. T., Aksenov, Y., Sinha, B., Coward, A. C., Le Sommer, J., Merino, N., and Zalesny, V. B.: NEMO–ICB (v1.0): interactive icebergs in the NEMO ocean model globally configured at eddy-permitting resolution, Geosci. Model Dev., 8, 1547–1562, https://doi.org/10.5194/gmd-8-1547-2015, 2015. a, b, c, d, e
Martin, T. and Adcroft, A.: Parameterizing the fresh-water flux from land ice to ocean with interactive icebergs in a coupled climate model, Ocean Model., 34, 111–124, https://doi.org/10.1016/j.ocemod.2010.05.001, 2010. a
Mathiot, P., Jenkins, A., Harris, C., and Madec, G.: Explicit representation and parametrised impacts of under ice shelf seas in the z* coordinate ocean model NEMO 3.6, Geosci. Model Dev., 10, 2849–2874, https://doi.org/10.5194/gmd-10-2849-2017, 2017. a, b, c, d, e, f, g, h, i
McCarthy, G., Smeed, D., Johns, W., Frajka-Williams, E., Moat, B., Rayner, D., Baringer, M., Meinen, C., Collins, J., and Bryden, H.: Measuring the Atlantic Meridional Overturning Circulation at 26∘ N, Prog. Oceanogr., 130, 91–111, https://doi.org/10.1016/j.pocean.2014.10.006, 2015. a
Megann, A.: Estimating the numerical diapycnal mixing in an eddy-permitting ocean model, Ocean Model., 121, 19–33, https://doi.org/10.1016/j.ocemod.2017.11.001, 2018. a
Megann, A., Storkey, D., Aksenov, Y., Alderson, S., Calvert, D., Graham, T., Hyder, P., Siddorn, J., and Sinha, B.: GO5.0: the joint NERC–Met Office NEMO global ocean model for use in coupled and forced applications, Geosci. Model Dev., 7, 1069–1092, https://doi.org/10.5194/gmd-7-1069-2014, 2014. a, b, c, d, e, f, g
Merchant, C., Embury, O., Roberts-Jones, J., Fiedler, E., Bulgin, C., Corlett, G., Good, S., McLaren, A., Rayner, N., and Donlon, C.: ESA Sea Surface Temperature Climate Change Initiative (ESA SST CCI): Analysis long term product version 1.0, NERC Earth Observation Data Centre, https://doi.org/10.5285/878bef44-d32a-40cd-a02d-49b6286f0ea4, 2014. a, b, c
Merino, N., Sommer, J. L., Durand, G., Jourdain, N. C., Madec, G., Mathiot, P., and Tournadre, J.: Antarctic icebergs melt over the Southern Ocean: Climatology and impact on sea ice, Ocean Model., 104, 99–110, https://doi.org/10.1016/j.ocemod.2016.05.001, 2016. a
Merryfield, W. J., Holloway, G., and Gargett, A. E.: A Global Ocean Model with Double-Diffusive Mixing, J. Phys. Oceanogr., 29, 1124–1142, https://doi.org/10.1175/1520-0485(1999)029<1124:AGOMWD>2.0.CO;2, 1999. a
NOAA: available at: https://www.ngdc.noaa.gov/mgg/global/etopo2.html (last access: 6 August 2018), 2006. a
Rae, J. G. L., Hewitt, H. T., Keen, A. B., Ridley, J. K., West, A. E., Harris, C. M., Hunke, E. C., and Walters, D. N.: Development of the Global Sea Ice 6.0 CICE configuration for the Met Office Global Coupled model, Geosci. Model Dev., 8, 2221–2230, https://doi.org/10.5194/gmd-8-2221-2015, 2015. a
Rayner, N. A., Parker, D. E., Horton, E. B., Folland, C. K., Alexander, L. V., Rowell, D. P., Kent, E. C., and Kaplan, A.: Global analyses of sea surface temperature, sea ice, and night marine air temperature since the late nineteenth century, J. Geophys. Res.-Atmos., 108, 4407, https://doi.org/10.1029/2002JD002670, 2003. a, b, c, d
Ridley, J. K., Blockley, E. W., Keen, A. B., Rae, J. G. L., West, A. E., and Schroeder, D.: The sea ice model component of HadGEM3-GC3.1, Geosci. Model Dev., 11, 713–723, https://doi.org/10.5194/gmd-11-713-2018, 2018. a, b, c, d, e, f, g
Rignot, E., Jacobs, S., Mouginot, J., and Scheuchl, B.: Ice-Shelf Melting Around Antarctica, Science, 341, 266–270, https://doi.org/10.1126/science.1235798, 2013. a
Rodgers, K. B., Aumont, O., Mikaloff Fletcher, S. E., Plancherel, Y., Bopp, L., de Boyer Montégut, C., Iudicone, D., Keeling, R. F., Madec, G., and Wanninkhof, R.: Strong sensitivity of Southern Ocean carbon uptake and nutrient cycling to wind stirring, Biogeosciences, 11, 4077–4098, https://doi.org/10.5194/bg-11-4077-2014, 2014. a, b, c, d, e
Roullet, G. and Madec, G.: Salt conservation, free surface, and varying levels: A new formulation for ocean general circulation models, J. Geophys. Res.-Oceans, 105, 23927–23942, https://doi.org/10.1029/2000JC900089, 2000. a, b
Semtner, A. J.: A model for the thermodynamic growth of sea ice in numerical investigations of climate, J. Phys. Oceanogr., 6, 379–389, https://doi.org/10.1175/1520- 0485(1976)006<0379:AMFTTG>2.0.CO;2, 1976. a
Simmons, H. L., Jayne, S. R., Laurent, L. C., and Weaver, A. J.: Tidally driven mixing in a numerical model of the ocean general circulation, Ocean Model., 6, 245–263, https://doi.org/10.1016/S1463-5003(03)00011-8, 2004. a
Stein, C. A. and Stein, S.: A model for the global variation in oceanic depth and heat flow with lithospheric age, Nature, 359, 123–129, 1992. a
Stewart, K., Hogg, A., Griffies, S., Heerdegen, A., Ward, M., Spence, P., and England, M.: Vertical resolution of baroclinic modes in global ocean models, Ocean Model., 113, 50–65, https://doi.org/10.1016/j.ocemod.2017.03.012, 2017. a
Treguier, A. M., Theetten, S., Chassignet, E. P., Penduff, T., Smith, R., Talley, L., Beismann, J. O., and Böning, C.: The North Atlantic Subpolar Gyre in Four High-Resolution Models, J. Phys. Oceanogr., 35, 757–774, https://doi.org/10.1175/JPO2720.1, 2005. a
Wang, C.: Subthermocline tropical cells and equatorial subsurface countercurrents, Deep Sea-Res. Pt. I, 52, 123–135, https://doi.org/10.1016/j.dsr.2004.08.009, 2005. a
Weatherall, P., Marks, K. M., Jakobsson, M., Schmitt, T., Tani, S., Arndt, J. E., Rovere, M., Chayes, D., Ferrini, V., and Wigley, R.: A new digital bathymetric model of the world's oceans, Earth Space Sci., 2, 331–345, https://doi.org/10.1002/2015EA000107, 2015. a
West, A. E., McLaren, A. J., Hewitt, H. T., and Best, M. J.: The location of the thermodynamic atmosphere–ice interface in fully coupled models – a case study using JULES and CICE, Geosci. Model Dev., 9, 1125–1141, https://doi.org/10.5194/gmd-9-1125-2016, 2016. a
Williams, K. D., Harris, C. M., Bodas-Salcedo, A., Camp, J., Comer, R. E., Copsey, D., Fereday, D., Graham, T., Hill, R., Hinton, T., Hyder, P., Ineson, S., Masato, G., Milton, S. F., Roberts, M. J., Rowell, D. P., Sanchez, C., Shelly, A., Sinha, B., Walters, D. N., West, A., Woollings, T., and Xavier, P. K.: The Met Office Global Coupled model 2.0 (GC2) configuration, Geosci. Model Dev., 8, 1509–1524, https://doi.org/10.5194/gmd-8-1509-2015, 2015. a, b
Williams, K. D., Copsey, D., Blockley, E. W., Bodas-Salcedo, A., Calvert, D., Comer, R., Davis, P., Graham, T., Hewitt, H. T., Hill, R., Hyder, P., Ineson, S., Johns, T. C., Keen, A. B., Lee, R. W., Megann, A., Milton, S. F., Rae, J. G. L., Roberts, M. J., Scaife, A. A., Schiemann, R., Storkey, D., Thorpe, L., Watterson, I. G., Walters, D. N., West, A., Wood, R. A., Woollings, T., and Xavier, P. K.: The Met Office Global Coupled Model 3.0 and 3.1 (GC3.0 and GC3.1) Configurations, J. Adv. Model. Earth Sy., 10, 357–380, https://doi.org/10.1002/2017MS001115, 2017. a, b, c, d, e
Winton, M., Hallberg, R., and Gnanadesikan, A.: Simulation of Density-Driven Frictional Downslope Flow in Z-Coordinate Ocean Models, J. Phys. Oceanogr., 28, 2163–2174, https://doi.org/10.1175/1520-0485(1998)028<2163:SODDFD>2.0.CO;2, 1998. a
Zalesak, S. T.: Fully multidimensional flux-corrected transport algorithms for fluids, J. Comput. Phys., 31, 335–362, https://doi.org/10.1016/0021-9991(79)90051-2, 1979. a
Zhang, J. and Rothrock, D. A.: Modeling Global Sea Ice with a Thickness and Enthalpy Distribution Model in Generalized Curvilinear Coordinates, Mon. Weather Rev., 131, 845–861, https://doi.org/10.1175/1520-0493(2003)131h0845:MGSIWAi2.0.CO;2, 2003. a, b
Zhang, R. and Vallis, G. K.: The Role of Bottom Vortex Stretching on the Path of the North Atlantic Western Boundary Current and on the Northern Recirculation Gyre, J. Phys. Oceanogr., 37, 2053–2080, https://doi.org/10.1175/JPO3102.1, 2007. a
Zweng, M., Reagan, J., Antonov, J., Locarnini, R., Mishonov, A., Boyer, T., Garcia, H., Baranova, O., Johnson, D., Seidov, D., and Biddle, M.: World Ocean Atlas 2013, Vol. 2: Salinity, Tech. rep., edited by: Levitus, S. and Mishonov, A., NOAA Atlas NESDIS 74, 39 pp., available at: https://data.nodc.noaa.gov/woa/WOA13/DOC/woa13_vol2.pdf (last access: 6 August 2018), 2013. a
Coupled Model Intercomparison Project Phase 6 (Eyring et al., 2016)
Coordinated Ocean-ice Reference Experiments Phase 2 (Large and Yeager, 2009)
Ocean Model Intercomparison Project
Forecasting Ocean Assimilation Model
GLObal SEAsonal forecasting system
DEcadal PREdiction SYStem
The extended versions are sometimes referred to as eORCA1, eORCA025 and eORCA12.
Rae et al. describe the GSI6.0 configuration which only differs from GSI5.0 in the choice of the value of the snow albedo.
- Abstract
- Introduction
- Model description
- Forcing data sets and initial conditions
- Developments since GO5 and sensitivities
- Evaluation of GO6 at resolution
- Cross-resolution evaluation
- GO7: opening the ice shelf cavities
- Summary and future plans
- User manuals
- Code availability
- Data availability
- Author contributions
- Acknowledgements
- References
- Supplement