the Creative Commons Attribution 4.0 License.
the Creative Commons Attribution 4.0 License.
 | 05 Oct 2018
Implementation of a comprehensive ice crystal formation parameterization for cirrus and mixed-phase clouds in the EMAC model (based on MESSy 2.53)
Sylvia C. Sullivan
Vlassis A. Karydis
Donifan Barahona
Martina Krämer
Athanasios Nenes
Holger Tost
Alexandra P. Tsimpidi
Jos Lelieveld
Andrea Pozzer
A comprehensive ice nucleation parameterization has been implemented in the global chemistry-climate model EMAC to improve the representation of ice crystal number concentrations (ICNCs). The parameterization of Barahona and Nenes (2009, hereafter BN09) allows for the treatment of ice nucleation taking into account the competition for water vapour between homogeneous and heterogeneous nucleation in cirrus clouds. Furthermore, the influence of chemically heterogeneous, polydisperse aerosols is considered by applying one of the multiple ice nucleating particle parameterizations which are included in BN09 to compute the heterogeneously formed ice crystals. BN09 has been modified in order to consider the pre-existing ice crystal effect and implemented to operate both in the cirrus and in the mixed-phase regimes. Compared to the standard EMAC parameterizations, BN09 produces fewer ice crystals in the upper troposphere but higher ICNCs in the middle troposphere, especially in the Northern Hemisphere where ice nucleating mineral dust particles are relatively abundant. Overall, ICNCs agree well with the observations, especially in cold cirrus clouds (at temperatures below 205 K), although they are underestimated between 200 and 220 K. As BN09 takes into account processes which were previously neglected by the standard version of the model, it is recommended for future EMAC simulations.
- Article
(6420 KB) -
Supplement
(23633 KB) - BibTeX
- EndNote


Clouds play an important role in the Earth system by affecting the global radiative energy budget, the hydrologic cycle, the scavenging of gaseous and particulate substances, and by providing a medium for aqueous-phase chemical reactions. Nevertheless, clouds remain one of the less understood components of the atmospheric system, and their representation in models (including processes like cloud droplet formation, ice nucleation, cloud phase transitions, secondary ice production, and aerosol–cloud interactions) is one of the major challenges in climate studies (IPCC, 2013; Seinfeld et al., 2016). Compared to the liquid droplet activation process, the ice crystal formation (in mixed-phase and cirrus clouds) is affected by large uncertainties because of poor understanding of the chemical and physical principles underlying ice nucleation, and the complexity of ice nucleation mechanisms and aerosol–ice interactions (Cantrell and Heymsfield, 2005; Gultepe and Heymsfield, 2016; Heymsfield et al., 2017; Korolev et al., 2017).
Cirrus clouds form at high altitudes and very low temperatures (below 238 K), and consist purely of ice crystals. They strongly impact the transport of water vapour entering the stratosphere (Jensen et al., 2013) and play an important role as modulator of radiation fluxes in the global radiative budget: they scatter solar radiation back into space (albedo effect) and absorb and re-emit longwave terrestrial radiation (greenhouse effect). Differing from other types of clouds, cirrus clouds produce a net warming at the top of the atmosphere (TOA; e.g. Chen et al., 2000; Hong et al., 2016; Matus and L'Ecuyer, 2017). In addition, mixed-phase clouds consist of both supercooled liquid cloud droplets and ice crystals, and appear at subfreezing temperatures above 238 K. Mixed-phase clouds generate a net cooling at the TOA, although the estimates of their radiative effects are complicated by the coexistence of both ice and liquid cloud phases (Matus and L'Ecuyer, 2017). Due to the difference between vapour pressure over water and over ice, ice crystals grow at the expense of water droplets (Wegener–Bergeron–Findeisen process); thus, mixed-phase clouds are thermodynamically unstable and can convert into ice-only clouds (e.g. Korolev, 2007; Korolev et al., 2017). As ice crystals can grow quickly to precipitation-sized particles, precipitation is mainly formed in mixed-phase clouds, while precipitation from cirrus clouds does not usually reach the surface (Lohmann, 2017). The mixed phase is also important for cloud electrification and intracloud lightning, which occur through the in-cloud charge separation via a transition from supercooled raindrops to graupel over the mixed-phase temperature range (Korolev et al., 2017). The fraction of cloud ice has a profound impact on the cloud forcing in global climate models, one of the reasons why cloud radiative forcing is so diverse and uncertain (McCoy et al., 2016; Tan et al., 2016; Vergara-Temprado et al., 2018).
Ice crystal formation takes place via homogeneous and heterogeneous nucleation, depending on environmental conditions (e.g. temperature, supersaturation, vertical velocity) and aerosol populations (i.e. aerosol number concentrations and physicochemical characteristics) (Pruppacher and Klett, 1997; Kanji et al., 2017; Heymsfield et al., 2017; Korolev et al., 2017). Homogeneous nucleation occurs through the freezing of supercooled liquid droplets at low temperatures (T<238 K) and high supersaturation over ice (140 %–160 %) (Koop et al., 2000). Heterogeneous nucleation refers to the formation of ice on an aerosol surface, which reduces the energy barrier for ice nucleation and lets ice crystals form at lower supersaturations and/or at higher (subfreezing) temperatures than homogeneous nucleation. The aerosols that lead to the generation of ice crystals are called ice nucleating particles (INPs) and are mostly insoluble, like mineral dust, soot, organics, and biological particles (Pruppacher and Klett, 1997). Heterogeneous nucleation occurs via different mechanisms called “nucleation modes” (deposition, condensation, immersion, and contact nucleation). In several modelling studies, homogeneous nucleation has been considered the dominant process for cirrus formation (e.g. Haag et al., 2003; Hendricks et al., 2011; Gettelman et al., 2012; Barahona et al., 2014) because the concentration of liquid droplets is higher than that of INPs in the upper troposphere. However, some field measurements found a predominance of heterogeneous nucleation and lower ice crystal number concentrations (ICNCs) than produced by homogeneous nucleation (e.g. Cziczo et al., 2013; Jensen et al., 2013). What process is dominant is still under debate, although recent studies suggested the overestimation of the vertical velocity as a possible cause of the discrepancy between modelled results and observations (e.g. Barahona and Nenes, 2011; Zhou et al., 2016; Barahona et al., 2017).
Overall, two different regimes for ice crystal formation are distinguished: the cirrus regime at low temperatures (T<238 K), where ice crystals originate via heterogeneous and homogeneous nucleation to form cirrus clouds and the mixed-phase regime at subfreezing temperatures between 238 and 273 K, where ice crystals exclusively form via heterogeneous nucleation and alter the phase composition of the mixed-phase clouds. In the latter regime, besides primary nucleation, another mechanism which controls ICNCs is the secondary ice production, i.e. the production of new ice crystals via the multiplication of pre-existing ice particles without the action of INPs.
As heterogeneous nucleation takes place at lower supersaturation than homogeneous nucleation, the available water vapour and the degree of supersaturation decrease, reducing or inhibiting the formation of ice crystals from homogeneous nucleation. This competition between homogeneous and heterogeneous nucleation for water vapour drastically affects the ICNC in the cirrus regime, even at low INP concentrations (Kärcher and Lohmann, 2003; Spichtinger and Cziczo, 2010). On the other hand, both in the cirrus regime and in the mixed-phase regime, water vapour can also be reduced by depositional growth onto pre-existing ice crystals and ice crystals carried into the cloud via convective detrainment and advective transport, thus inhibiting ice nucleation. The impact of pre-existing ice crystals (PREICE) can be especially important in cirrus clouds, when ice crystals are of small size and have low sedimentation rates at low temperatures (Barahona and Nenes, 2011), leading to optically thinner cirrus clouds characterized by fewer ice crystals with a diverse age distribution and high supersaturation levels, especially in the case of tropical upper troposphere and lower stratosphere (UTLS) cirrus clouds (Barahona and Nenes, 2011; Hendricks et al., 2011; Kuebbeler et al., 2014).
Cloud schemes in atmospheric and climate models have evolved from using only macrophysical properties, like cloud cover, to representing the microphysics explicitly, e.g. formation, evolution, and removal of cloud droplets and ice crystals (Kärcher et al., 2006; Lohmann et al., 2008; Gettelman et al., 2010; Barahona et al., 2014). Including sophisticated schemes in general circulation models (GCMs) allows for a more realistic description of the variability in cloud properties and cloud radiative effects, improving the model climate predictions (Lohmann and Feichter, 2005; Barahona et al., 2014). Recently, sophisticated parameterizations have been developed, taking into account the aerosol influence on ice formation and different modes of heterogeneous nucleation. Liu and Penner (2005) presented an ice nucleation scheme based on numerical parcel model simulations which considers the competition between homogeneous and heterogeneous nucleation following the classical nucleation theory (CNT). Kärcher et al. (2006) developed a physically based parameterization scheme of ice initiation and ice crystal initial growth in cirrus clouds, considering the PREICE effect and allowing for competition between heterogeneous and homogeneous nucleation. Barahona and Nenes (2009) introduced an ice cloud formation parameterization, based on the analytical solution of the cloud parcel model equations, which calculates the competition for water vapour between homogeneous and heterogeneous nucleation and takes into account the variability (in size and chemical composition) of different aerosol species through a variety of INP parameterizations. Since then, these parameterizations have been included in GCMs in order to better predict cloud phase partitioning. Hendricks et al. (2011) and Kuebbeler et al. (2014) have implemented the parameterization of Kärcher et al. (2006) into the ECHAM4 and ECHAM5-HAM models, respectively. Liu et al. (2007) and Liu et al. (2012) have implemented the parameterization of Liu and Penner (2005) into the CAM3 and CAM5 models, respectively. Also, Liu et al. (2012) and Barahona et al. (2014) have implemented the scheme of Barahona and Nenes (2009) in CAM5 and GEOS-5, respectively.
In this study the parameterization of Barahona and Nenes (2009, hereafter BN09) has been implemented into the ECHAM/MESSy Atmospheric Chemistry (EMAC) global model to improve the representation of ice nucleation. The BN09 algorithm has been modified in order to include the PREICE effect and has been used to compute the new ice crystals formed both in the cirrus regime and/or in the mixed-phase regime. Its performance has been compared with the results generated via the standard model configuration, and the model evaluation has been carried out paying particular attention to the ice-related results. The paper is organized as follows: the description of the operational model and the BN09 scheme are in Sect. 2, as well as the information about the implementation work and the simulations run for this study, Sect. 3 describes the modelled ice-related products, Sect. 4 contains the evaluation of the model, and Sect. 5 presents our conclusions.
2.1 EMAC model
The EMAC model is a numerical chemistry-climate model which describes tropospheric and middle-atmosphere processes and their interactions with ocean, land, and human influences. Such interactions are simulated via dedicated submodels in the MESSy framework (Modular Earth Submodel System; Jöckel et al., 2010), while the 5th generation European Centre Hamburg GCM (ECHAM5; Roeckner et al., 2006) is used as core of the atmospheric dynamics. For the present study we have used ECHAM5 version 5.3.02 and MESSy version 2.53.
The EMAC model has been extensively described and evaluated against in situ observations and satellite data, e.g. aerosol optical depth, acid deposition, and meteorological parameters (e.g. Pozzer et al., 2012, 2015; Karydis et al., 2016; Tsimpidi et al., 2016; Klingmüller et al., 2018). It computes gas-phase species on-line through the MECCA (Module Efficiently Calculating the Chemistry of the Atmosphere) submodel (Sander et al., 2011) and provides a comprehensive treatment of chemical processes and dynamical feedbacks through radiation (Dietmüller et al., 2016). Aerosol microphysics and gas/aerosol partitioning are calculated by the GMXe (Global Modal-aerosol eXtension) submodel (Pringle et al., 2010), a two-moment aerosol module which predicts the number concentration and the mass mixing ratio of the aerosol modes, along with the mixing state. The aerosol size distribution is described by seven lognormal modes (defined by total number concentration, number mean radius, and geometric standard deviation): four hydrophilic modes, which cover the aerosol size spectrum of nucleation, Aitken, accumulation, and coarse modes; and three hydrophobic modes, which have the same size range except for the nucleation mode which is not required. The aerosol composition within each mode is uniform in size (internally mixed) but it varies among modes (externally mixed). The aging of aerosols, through coagulation or condensation of water vapour and sulfuric acid, is described by GMXe by transferring aerosols from the externally mixed to the internally mixed modes. Convective and large-scale clouds are separately treated and individually calculated by the submodels CONVECT and CLOUD, respectively. The CONVECT submodel contains multiple convection parameterizations (Tost et al., 2006b). In this work the scheme of Tiedtke (1989) with modifications by Nordeng (1994) has been used. Convective cloud microphysics is highly simplified and neither explicit aerosol activation into liquid droplets nor aerosol effects in the ice formation processes are taken into account, i.e. convective microphysics is solely based on temperature and updraught strength. Detrainment from convection is treated by taking updraught (and downdraught) concentrations of water vapour and cloud condensate and the corresponding mass flux detrainment rates into account. These are merged including turbulent detrainment (i.e. exchange of mass through the cloud edges) and organized detrainment (i.e. organized outflow at cloud top). The detrained water vapour is added to the large-scale water vapour field, while the detrained cloud condensate is directly used as a source term for cloud condensate by the large-scale cloud scheme (i.e. the CLOUD submodel), which considers the detrained condensate as either liquid or ice depending on the temperature (if T<238 K the phase is ice) and the updraught velocity. The number of detrained ice crystals is estimated from the ice condensate detrained from convection by assuming an only temperature dependent radius. The CLOUD submodel uses a double-moment stratiform cloud microphysics scheme for cloud droplets and ice crystals (Lohmann et al., 1999, 2007; Lohmann and Kärcher, 2002), which defines prognostic equations for specific humidity, liquid cloud mixing ratio, ice cloud mixing ratio, cloud droplet number concentration (CDNC), and ICNC. The advantage of using a two-moment scheme is that it allows aerosol–cloud interactions, improving calculations of cloud microphysical processes and radiative transfer. In the CLOUD submodel, ice crystals form via homogeneous nucleation in the cirrus regime, and via immersion and contact freezing in the mixed-phase regime (more details about ice nucleation are given in the next subsection). Cloud droplet formation is parameterized by the “unified activation framework” (UAF; Kumar et al., 2011; Karydis et al., 2011). It is an advanced physically based parameterization which merges two theories: κ-Köhler theory (KT; Petters and Kreidenweis, 2007), which governs the activation of soluble aerosols, and the Frenkel–Halsey–Hill adsorption activation theory (FHH-AT; Kumar et al., 2009), which describes the droplet activation due to water adsorption onto insoluble aerosols (e.g. mineral dust). Aerosol modes that consist of only soluble material follow the KT, and the required effective hygroscopicity (κ) is calculated based on the chemical composition of the mode as described by the ISORROPIA thermodynamic equilibrium model (Fountoukis and Nenes, 2007). Aerosol modes that consist of an insoluble core with soluble coating follow the UAF scheme, which takes into account the effects of adsorption and absorption on the cloud condensation nuclei (CCN) activity of the mixed aerosol. More details about the UAF scheme and its implementation in the EMAC model can be found in Karydis et al. (2017). The diagnostic cloud cover scheme of Sundqvist et al. (1989) based on the grid mean relative humidity is used; it assumes that a grid box is partly covered by clouds when the relative humidity exceeds a threshold and is totally covered when saturation is reached. Other microphysical processes, like phase transitions, autoconversion, aggregation, accretion, evaporation of rain, melting of snow, and sedimentation of cloud ice, are also taken into account by the CLOUD submodel. An evaluation of the double-moment cloud microphysics scheme used by ECHAM5 was presented in Lohmann et al. (2007, 2008) and Lohmann and Hoose (2009), applying the two-moment aerosol microphysics scheme HAM (Stier et al., 2005). Lauer et al. (2007) and Righi et al. (2013, 2015, 2016) showed an evaluation of the CLOUD submodel in conjunction with the aerosol microphysics submodel MADE (Ackermann et al., 1998), while Tost (2017) evaluated the CLOUD submodel in combination with the GMXe submodel. In Sect. 4 we will extend the comparison with various observations. Finally, physical loss processes, like dry deposition, wet deposition, and sedimentation of aerosol, are explicitly considered by the submodels DRYDEP, SEDI, and SCAV (Kerkweg et al., 2006; Tost et al., 2006a).
2.2 Default ice nucleation in EMAC
The CLOUD submodel describes the evolution of the prognostic variables which undergo all cloud microphysical processes (e.g. precipitation, deposition, and evaporation/sublimation). As far as the formation of new ice crystals is concerned, they are computed via two independent parameterizations, as shown in black in Fig. 1.

Figure 1Scheme of the new ice crystal formation in the CLOUD submodel:
different ice nucleation schemes can be used in the cirrus and in the
mixed-phase regimes. nicnc and limm_BN09 are variables
defined in the namelist file “cloud.nml”; red parts are new; three dots
indicate other processes coded in the CLOUD submodel.
In the cirrus regime (T≤238.15 K) it is assumed that cirrus clouds exclusively form homogeneously using the parameterization of Kärcher and Lohmann (2002, hereafter referred to as KL02). Such parameterization computes the newly formed ice crystals via homogeneous nucleation () of supercooled solution droplets and allows supersaturation with respect to ice. Alternatively, it is possible to use the parameterization of Kärcher and Lohmann (2003) to simulate cirrus formation via pure heterogeneous freezing; however, by default the model operates with KL02, under the assumption that the dominant freezing mechanism for cirrus clouds is homogeneous nucleation.
In the mixed-phase regime (238.15 K K) heterogeneous nucleation occurs via immersion () and contact () freezing as described in Lohmann and Diehl (2006, hereafter referred to as LD06). Insoluble dust can initiate contact nucleation in the presence of supercooled water droplets following the parameterization of Levkov et al. (1992). Soluble dust and black carbon can act as immersion nuclei, according to the stochastic freezing hypothesis described in Diehl and Wurzler (2004). Possibly, contact freezing via thermophoresis can be included (), but it is usually not considered (i.e. ) since its contribution is negligible (Lohmann and Hoose, 2009). The Wegener–Bergeron–Findeisen (WBF) process at subfreezing temperatures is parameterized, so liquid water is forced to evaporate from cloud droplets and deposit onto existing ice crystals.
In the CLOUD submodel, a single updraught velocity (w) is used for the whole grid cell, although w can vary strongly in reality within the cell horizontal dimension (e.g. Guo et al., 2008). This is a simplification which is commonly used by GCMs; nevertheless, important progress has been recently achieved on this front to describe the subgrid-scale variability in updraught velocity using high-resolution simulations (Barahona et al., 2017). In EMAC, the subgrid-scale variability in vertical velocity is introduced by a turbulent component (wsub), which depends on the subgrid-scale turbulent kinetic energy (TKE) described by Brinkop and Roeckner (1995), such that . The vertical velocity is given by the sum of the grid mean vertical velocity () and the turbulent contribution: (Kärcher and Lohmann, 2002). Zhou et al. (2016) analysed the effect of different updraught velocity representations on ice number concentrations and showed that using wsub overestimates the ICNCs at temperatures below 205 K, but agrees better with the observations at higher temperatures. Other studies, e.g. Kärcher and Ström (2003) and Joos et al. (2008), showed that w is in good agreement with vertical velocity observations. Given the importance of updraught velocities for ice formation (Donner et al., 2016; Sullivan et al., 2016), future studies could implement a complete probability distribution of updraughts. Finally, the influence of the pre-existing ice particles is not taken into account. The CLOUD submodel simply reduces the number of aerosol particles available for ice nucleation by the existing ice particle number in the cirrus regime.
2.3 Ice nucleation parameterization BN09
2.3.1 Scheme characteristics
The BN09 parameterization is computationally efficient and suitable for large-scale atmospheric models. It explicitly considers the competition for water vapour between homogeneous and heterogeneous nucleation in the cirrus regime, the influence of chemically heterogeneous, polydisperse aerosols acting as INPs, and allows us to use different heterogeneous nucleation parameterizations.
The BN09 algorithm can be divided into three subsequent parts. First, the limiting number of INPs (Nlim) needed to inhibit homogeneous nucleation is computed if temperatures are below 238 K. Indeed, at such low temperatures homogeneous and heterogeneous nucleation compete for water vapour decreasing ice supersaturation. When INPs exceed Nlim and the maximum supersaturation (smax) is less than the threshold for homogeneous nucleation (shom), homogeneous nucleation is suppressed and ice crystals are formed only heterogeneously. Nlim is determined by computing the number of INPs required to keep smax below shom. In the second step, ice crystals nucleated heterogeneously (Ni,het) are computed via the selected INP parameterization at shom, then two cases can follow. If the condition is satisfied, ice crystals are formed only heterogeneously at smax (i.e. Ni,het(smax)), as homogeneous nucleation is suppressed. Here, the smax is determined using a bisection method to balance the supersaturation within the air parcel. If , the competition between homogeneous and heterogeneous nucleation is simulated. The ice crystals nucleated homogeneously (Ni,hom) are determined via the homogeneous nucleation parameterization of Barahona and Nenes (2008, 2009) (hereafter BNhom):
where Nc is the number concentration of supercooled liquid cloud droplets and fc is the fraction of freezing soluble aerosol. The first factor of fc (i.e. fc,hom) is defined by Barahona and Nenes (2008), while the second factor is the correction introduced by Barahona and Nenes (2009) to take into account the reduction of the probability of homogeneous nucleation due to the change in the droplet size distribution during crystal formation.
Third, the total concentration of new ice crystals formed in the cirrus regime () is determined by the contribution of both heterogeneous and homogeneous nucleation, i.e. (see Fig. 1). On the other hand, if the temperature is higher than 238 K, the algorithm uses the INP parameterization to compute Ni,het(smax).
It is important to stress that the BN09 code actually includes five INP parameterizations to deal with heterogeneous nucleation (as mentioned before) and these are described by (i) Meyers et al. (1992), (ii) Phillips et al. (2007), (iii) Phillips et al. (2008), (iv) Phillips et al. (2013), and (v) Barahona and Nenes (2009). They are all empirically based except the latter, which is derived from the CNT. Sensitivity studies have shown that global means of ICNC vary by up to a factor of 20 according to the INP parameterization used (when the competition between homogeneous and heterogeneous nucleation is taken into account) and empirical-based parameterizations better agree with observations, while CNT overestimates the number of ice crystals (Barahona et al., 2010; Sullivan et al., 2016). Therefore, the simulations described in Sect. 2.4 use the parameterization of Phillips et al. (2013, hereafter referred to as P13) to simulate heterogeneous nucleation, since it better agrees with observations (Sullivan et al., 2016). P13 is the improved version of Phillips et al. (2008), a comprehensive empirical formulation which takes into account the surface area contribution of different insoluble aerosols (with diameters larger than 0.1 µm) to deposition and immersion/condensation nucleation modes, besides the temperature and the supersaturation with respect to ice. The aerosol particles responsible for ice nucleation are divided into four groups: mineral dust (DU), inorganic black carbon (BC), biological aerosols (BIO), and soluble organics (OCsol). Dust and soot, the aerosol species considered in this work for the reasons explained in Sect. 2.4, contribute to determine Ni,het in the following way:
where nINP,X is the number concentration of INPs activated at a saturation ratio with respect to ice Si and temperature T for the aerosol species X, μX represents the mean number of activated ice embryos per insoluble aerosol particle of species X with diameter DX>0.1 µm, nX is the number concentration of aerosol particles (interstitial and INP immersed in cloud droplets) of species X, and NX is the number of different aerosol species. Equation (3) can be further extended for biological aerosols and soluble organics, as shown in Phillips et al. (2013), and Ni,het denotes the new ice crystals formed via deposition and immersion/condensation nucleation modes.
To summarize (see Fig. 1), according to BN09 the new ice crystals formed in the cirrus regime are
while in the mixed-phase regime they are computed as
In order to account for subgrid variabilities, the output variables of BN09, which depend on the vertical velocity (f(w)), are weighted over a Gaussian updraught velocity distribution by numerically calculating the integral (Morales and Nenes, 2010; Sullivan et al., 2016):
where P(w′) is the Gaussian probability density function of subgrid vertical velocities (w′) with mean 0.1 cm s−1 and standard deviation equal to wsub.
2.3.2 Implementation
The BN09 parameterization has been added in the MESSy framework in order to compute the newly formed ice crystals in the cirrus regime and/or in the mixed-phase regime. The input variables of BN09 are the following: temperature (T, K); pressure (P, Pa); width of the vertical velocity distribution (wsub, m s−1) with upper limit 3 m s−1 and lower limit 0.01 m s−1; number concentration of activated cloud droplets (Nc, m−3), dry diameter of Aitken soluble mode (Dc, m; see Appendix A); standard deviation of the Aitken soluble mode (σc); number concentrations (NX, m−3), geometric mean dry diameters (DM, m), and lognormal standard deviations (σM) of interstitial aerosol of species X (which can be DU, BC, OCsol, and BIO, depending on the choice of the INP parameterization). Given the internally mixed representation of aerosols in EMAC, the diameters DM are not distinguished among aerosol species but only among the modes (Aitken (K), accumulation (A), coarse (C); i.e. ) which the species belong to. Similarly, the standard deviations σM are constant depending only on the mode (in EMAC and σC=2.0).
A schematic overview of how BN09 has been implemented in EMAC through the CLOUD submodel is shown in Fig. 1. Moreover, the PREICE effect has been included in the BN09 code. This effect is parameterized by reducing the vertical velocity for ice nucleation (wsub) by a factor depending on the pre-existing ice crystal number concentration and size, limiting the expansion cooling. Such a “corrected” vertical velocity (wsub,pre) has been computed as defined in Eq. (24) by Barahona et al. (2014). Further information about the implementation is given in Appendix A.
2.4 Set-up of simulations
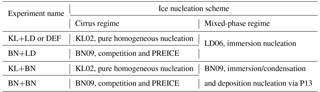
In this study EMAC simulations have been carried out with the T42L31ECMWF resolution, which corresponds to a spherical truncation of T42 (i.e. quadratic Gaussian grid of approx. in latitude and longitude) and 31 vertical hybrid pressure levels up to 10 hPa (approx. 25 km) at the lower stratosphere. All simulations have been run for 6 years (1 year as spin-up time plus 5 years for the analysis) using emissions starting from the year 2000 (GFEDv3.1 from van der Werf et al., 2010, for biomass burning and CMIP5-RCP4.5 from Clarke et al., 2007, for anthropogenic emissions). As in Pozzer et al. (2012), dust is off-line prescribed using monthly emission files based on the AEROCOM dataset (Dentener et al., 2006). Also, volcanic and secondary organic aerosol emissions are based on AEROCOM, while GFEDv3.1 and CMIP5-RCP4.5 have been used to simulate emissions of black carbon and organic aerosols, respectively. Finally, aerosol climatologies have been used for the interactions with radiation (Tanre et al., 1984) and heterogeneous chemistry (Aquila et al., 2011). Prescribed climatologies of sea surface temperatures (SST) and sea-ice concentrations (SIC) from AMIP (30 years: 1980–2009) have been used as boundary conditions. Daily means have been saved as output, and monthly means have been used for the analysis in Sects. 3 and 4.1. Table 1 lists all simulations of this study and summarizes their main characteristics. The default experiment (DEF or KL+LD) is performed with the standard configuration of the EMAC model, i.e. using the parameterization of Kärcher and Lohmann (2002) for cirrus clouds and the parameterization of Lohmann and Diehl (2006) for immersion nucleation in the mixed-phase regime. The UAF scheme is used as cloud droplet formation parameterization, like in Karydis et al. (2017). In order to investigate the model performace using the BN09 scheme, we carried out three other experiments where BN09 operates in the two cloud regimes in different combinations: BN09 computing the new ice crystals in the cirrus regime (BN+LD), in the mixed-phase regime (KL+BN), and in both regimes (BN+BN).
In all experiments, contact nucleation is computed according to LD06, while thermophoresis contact nucleation is not considered since its contribution is negligible (as remarked in Sect. 2.2). The P13 parameterization is used to simulate deposition and immersion/condensation nucleation whenever BN09 is called (for the reasons explained in Sect. 2.3). Since LD06 takes into account only dust and soot for immersion nucleation, we set the same aerosol species as contributions for P13 and turned off the biological and organic contributions.
BN09 improves the ice nucleation representation in EMAC by taking into account processes (e.g. water vapour competition, influence of polydisperse aerosols, PREICE effect) which were previously neglected by KL02 and LD06. In this section we investigate the changes and the effects obtained by using BN09 in the different regimes.
3.1 Annual zonal means
The annual zonal means of ICNC and ice water content (IWC) are shown as a function of latitude and altitude in Fig. 2, where the isolines at 273 and 238 K indicate the approximate bounds of cirrus and mixed-phase regimes. Despite the different ice nucleation parameterizations, ICNCs show similar qualitative patterns in all simulations, indicating the important role of atmospheric dynamics. Their numbers decrease towards lower altitudes (Fig. 2a) because the ice nucleation rate reduces with increasing temperature, while they are much higher over the mid-latitudes in the Northern Hemisphere (NH) because of larger INP concentrations and the influence of large mountain chains, e.g. the Rocky Mountains and the Himalayas. Looking at the relative changes, we note that ICNCs computed with BN09 in the cirrus regime are much lower than the default ICNCs in the upper troposphere and at high latitudes in the Southern Hemisphere (SH), where they are lower by up to 80 % (Fig. 2b). The absolute changes in the ICNC annual zonal means computed as a function of latitude and temperature (Fig. S1 in the Supplement) show that ICNCs in BN+KL are lower than the default case by 300 L−1 at temperatures below 220 K. As ice crystals are formed almost exclusively via homogeneous nucleation here (not shown) and BNhom and KL02 produce the same order of magnitude of ICNCs (Barahona and Nenes, 2008), the negative bias is likely due to the PREICE effect predicted by BN09. Indeed, it has been demonstrated that homogeneous nucleation dominates in the upper troposphere in the tropics and in the SH (Haag et al., 2003; Liu et al., 2012; Barahona et al., 2017), while heterogeneous nucleation is important in the NH (Li et al., 2012; Kuebbeler et al., 2014; Storelvmo and Herger, 2014; Shi et al., 2015; Gasparini and Lohmann, 2016; Barahona et al., 2017) where cirrus clouds are formed from a combination of homogeneous and heterogeneous processes. Interestingly, ICNCs at lower altitudes are also influenced by the ice nucleation parameterization used in the cirrus regime. In fact, there is an increase in ICNCs in the mixed-phase regime probably due to a faster sedimentation of the larger ice crystals produced by BN09 in cirrus clouds, especially in the NH where there are larger sources of efficient ice-nucleating mineral dust. Overall, as remarked later in Sect. 4.1, the total ICNC in BN+LD globally decreases. The changes produced by applying BN09 in the mixed-phase regime (Fig. 2c) result from the different heterogeneous ice nucleation parameterizations used to simulate immersion nucleation, P13 vs. LD06. The changes are especially evident in the NH (more than 40 %), where mineral dust is more abundant than in the SH. As P13 produces fewer new ice crystals than LD06 (not shown), the positive biases in the mixed-phase regime are possibly due to influences from the cirrus regime (e.g. ice crystal sedimentation) and convective detrainment. Overall, the ICNC deviations in the mixed-phase regime obtained using the two different parameterizations are smaller (mostly within ±20 %) than in the cirrus regime. This is also evident from Fig. S1 in the Supplement (last row), where the absolute changes are, on average, between 200 and −200 L−1 when BN09 is used in the cirrus regime and between 50 and −50 L−1 when comparing KL+BN with KL+LD. Possibly, the rate associated with heterogeneous nucleation in the mixed-phase regime is masked by other processes, like sedimentation and aggregation, which also contribute to ICNC in this regime. Finally, the simulation using BN09 in both regimes combines the effects described so far (Fig. 2d). Since cirrus clouds do not occur throughout the whole year, we present in the Supplement (Fig. S2) the ICNC seasonal means for summer (June–July–August, JJA) and winter (December–January–February, DJF). The seasonal analysis helps to understand why there is cirrus occurrence at temperatures higher than 238 K, showing that the ICNC growth in the mixed-phase region predicted by BN+LD is actually very small, as expected given that the ice scheme used in the mixed-phase regime is the same as the default simulation.
The IWC pattern (Fig. 2e) qualitatively follows the ICNC distribution. It is quite symmetrical between the two hemispheres except at high latitudes in the NH, where IWC is slightly higher because of the higher values of ICNC. Particularly, IWC exhibits three local maxima: two over the mid-latitudes in both hemispheres and one in the tropics, associated with storm tracks and deep convections, respectively (Li et al., 2012), in agreement with satellite observations, e.g. Waliser et al. (2009), Li et al. (2012). The relative changes in Fig. 2f show a pattern very similar to Fig. 2b; therefore, IWC decreases where ICNC reduces (and vice versa) when BN09 is used in the cirrus regime. On the other hand, IWC in KL+BN slightly reduces (up to 20 %) in the mixed-phase regime in areas where ICNC increases, especially in the NH at high latitudes (Fig. 2g). This could be due to the different sizes of ice crystals; however, the areas with significance are rather small. Finally, BN+BN in Fig. 2h simulates an overall reduction of IWC except in the three areas with higher values of IWC described in Fig. 2e.

Figure 2Annual zonal means of (grid-averaged) ice crystal number concentration (ICNC, L−1) and non-precipitable ice water content (IWC, mg kg−1) for the default simulation KL+LD and the relative percentage changes in BN+LD, KL+BN, and BN+BN with respect to it (i.e. ), computed where ICNCDEF≥1 L−1 and IWCDEF≥0.1 mg kg−1. The isotherms at 273 and 238 K are annual means, the crossed pattern indicates areas with a significance level of 95 %.
3.2 Global distributions
Figure 3 shows the global distributions of ICNC annual means at two different altitudes: 200 hPa (where temperatures vary between 200 and 220 K) to represent the cirrus regime and 600 hPa (where temperatures are approximately between 240 and 260 K) to represent the mixed-phase regime. ICNCs in the cirrus regime (Fig. 3a) show areas with high values over land and in correspondence with mountainous regions, e.g. the Rocky Mountains, Andes, and Tibetan Plateau with ICNCs >500 L−1. Such a pattern is strongly related to the turbulent contribution of the vertical velocity wsub and in agreement with Gryspeerdt et al. (2018a), who detected mostly orographic cirrus clouds in these areas. Figure 3a also shows higher ICNCs around the edge of the Antarctic ice sheet and over those regions which experience a strong convective activity, i.e. the Intertropical Convergence Zone (ITCZ) and the Tropical Warm Pool (TWP), as observed in Sourdeval et al. (2018). The annual global mean of ICNC at 200 hPa is about 200 L−1 (∼390 L−1 over land and ∼124 L−1 over ocean). The relative changes clearly show that BN09 used in the cirrus regime (Fig. 3b, d) reduces ICNC (up to 60 %) worldwide with respect to the default experiment, and the ICNC annual global mean drops to 137 L−1 (i.e. more than 30 %). As the ice crystals are mainly of homogeneous origin at this altitude, such a reduction is probably due to the PREICE effect. However, there are positive biases along the ITCZ and over the TWP area. As the concentrations of new ice crystals produced by BN09 are not particularly remarkable in these regions (not shown), convective detrainment is likely to play a role. Indeed, there is a certain response of the convective activity to the choice of the ice nucleation scheme used in the cirrus regime. On the contrary, KL+BN is characterized by a general increase in ICNC (Fig. 3c). However, most of the areas with strong positive changes (larger than 60 %) correspond to regions characterized by low ICNC (<30 L−1), thus the global annual mean increases just up to 218 L−1 (i.e. +9 %). At 600 hPa, ICNCs increase towards high latitudes, in particular over Greenland (up to 2000 L−1) and Antarctica (mostly >2000 L−1) (Fig. 3e). It must be said that, due to the very low temperatures in the latter region, even at 600 hPa the conditions are typical of the cirrus regime, and the high ICNCs can be related to the high values of both wsub and ice supersaturation. Gryspeerdt et al. (2018a) found that cirrus clouds over Antarctica have primarily synoptic origin. However, differently from Fig. 3e, observations do not present such a high peak of ICNC over Antarctica (Gryspeerdt et al., 2018b; Sourdeval et al., 2018). The annual global mean is about 53 L−1, which means about one-quarter with respect to the ICNC global mean at 200 hPa. Figure 3f confirms what was already noticed in Figure 2b, which is that the ice nucleation scheme used in the cirrus regime affects the ICNC at the mixed-phase regime altitudes predicting higher ICNCs especially in the NH. However, the largest differences occur in areas where ICNCs are very low and slightly affect the absolute ICNC values. As a result, the annual global mean actually decreases to 47 L−1 because of the negative contribution in the SH. Figure 3g also shows strong positive biases, but ICNCs do not change globally (52 L−1). Thus, we can reiterate that the ICNC in the mixed-phase regime is less sensitive to the ice nucleation scheme changes than the ICNC in the cirrus regime. Vertically integrated ice crystal number concentrations (ICNCburden, Fig. S3 in the Supplement) clearly show that concentrations are higher over continents ( m−2), where vertical updraughts are stronger and aerosol concentrations more abundant, than over oceans ( m−2).
IWC at 200 and 600 hPa (Fig. 4) presents a pattern qualitatively similar to the ICNCs at the corresponding heights. Nevertheless, two interesting features appear. First, there are high IWC values (>10 mg kg−1) over the TWP at 200 hPa, where ICNCs are not particularly high. This is probably caused by the larger radius of ice crystals simulated in this area. Second, IWC at 600 hPa is rather low over Antarctica (likely because of the low water vapour concentration), which is instead one of the regions with the highest ICNC. The relative changes in IWC with respect to the default simulation (Fig. S4 in the Supplement) approximately follow the changes obtained for ICNC, i.e. IWC reduces where ICNC decreases and vice versa.
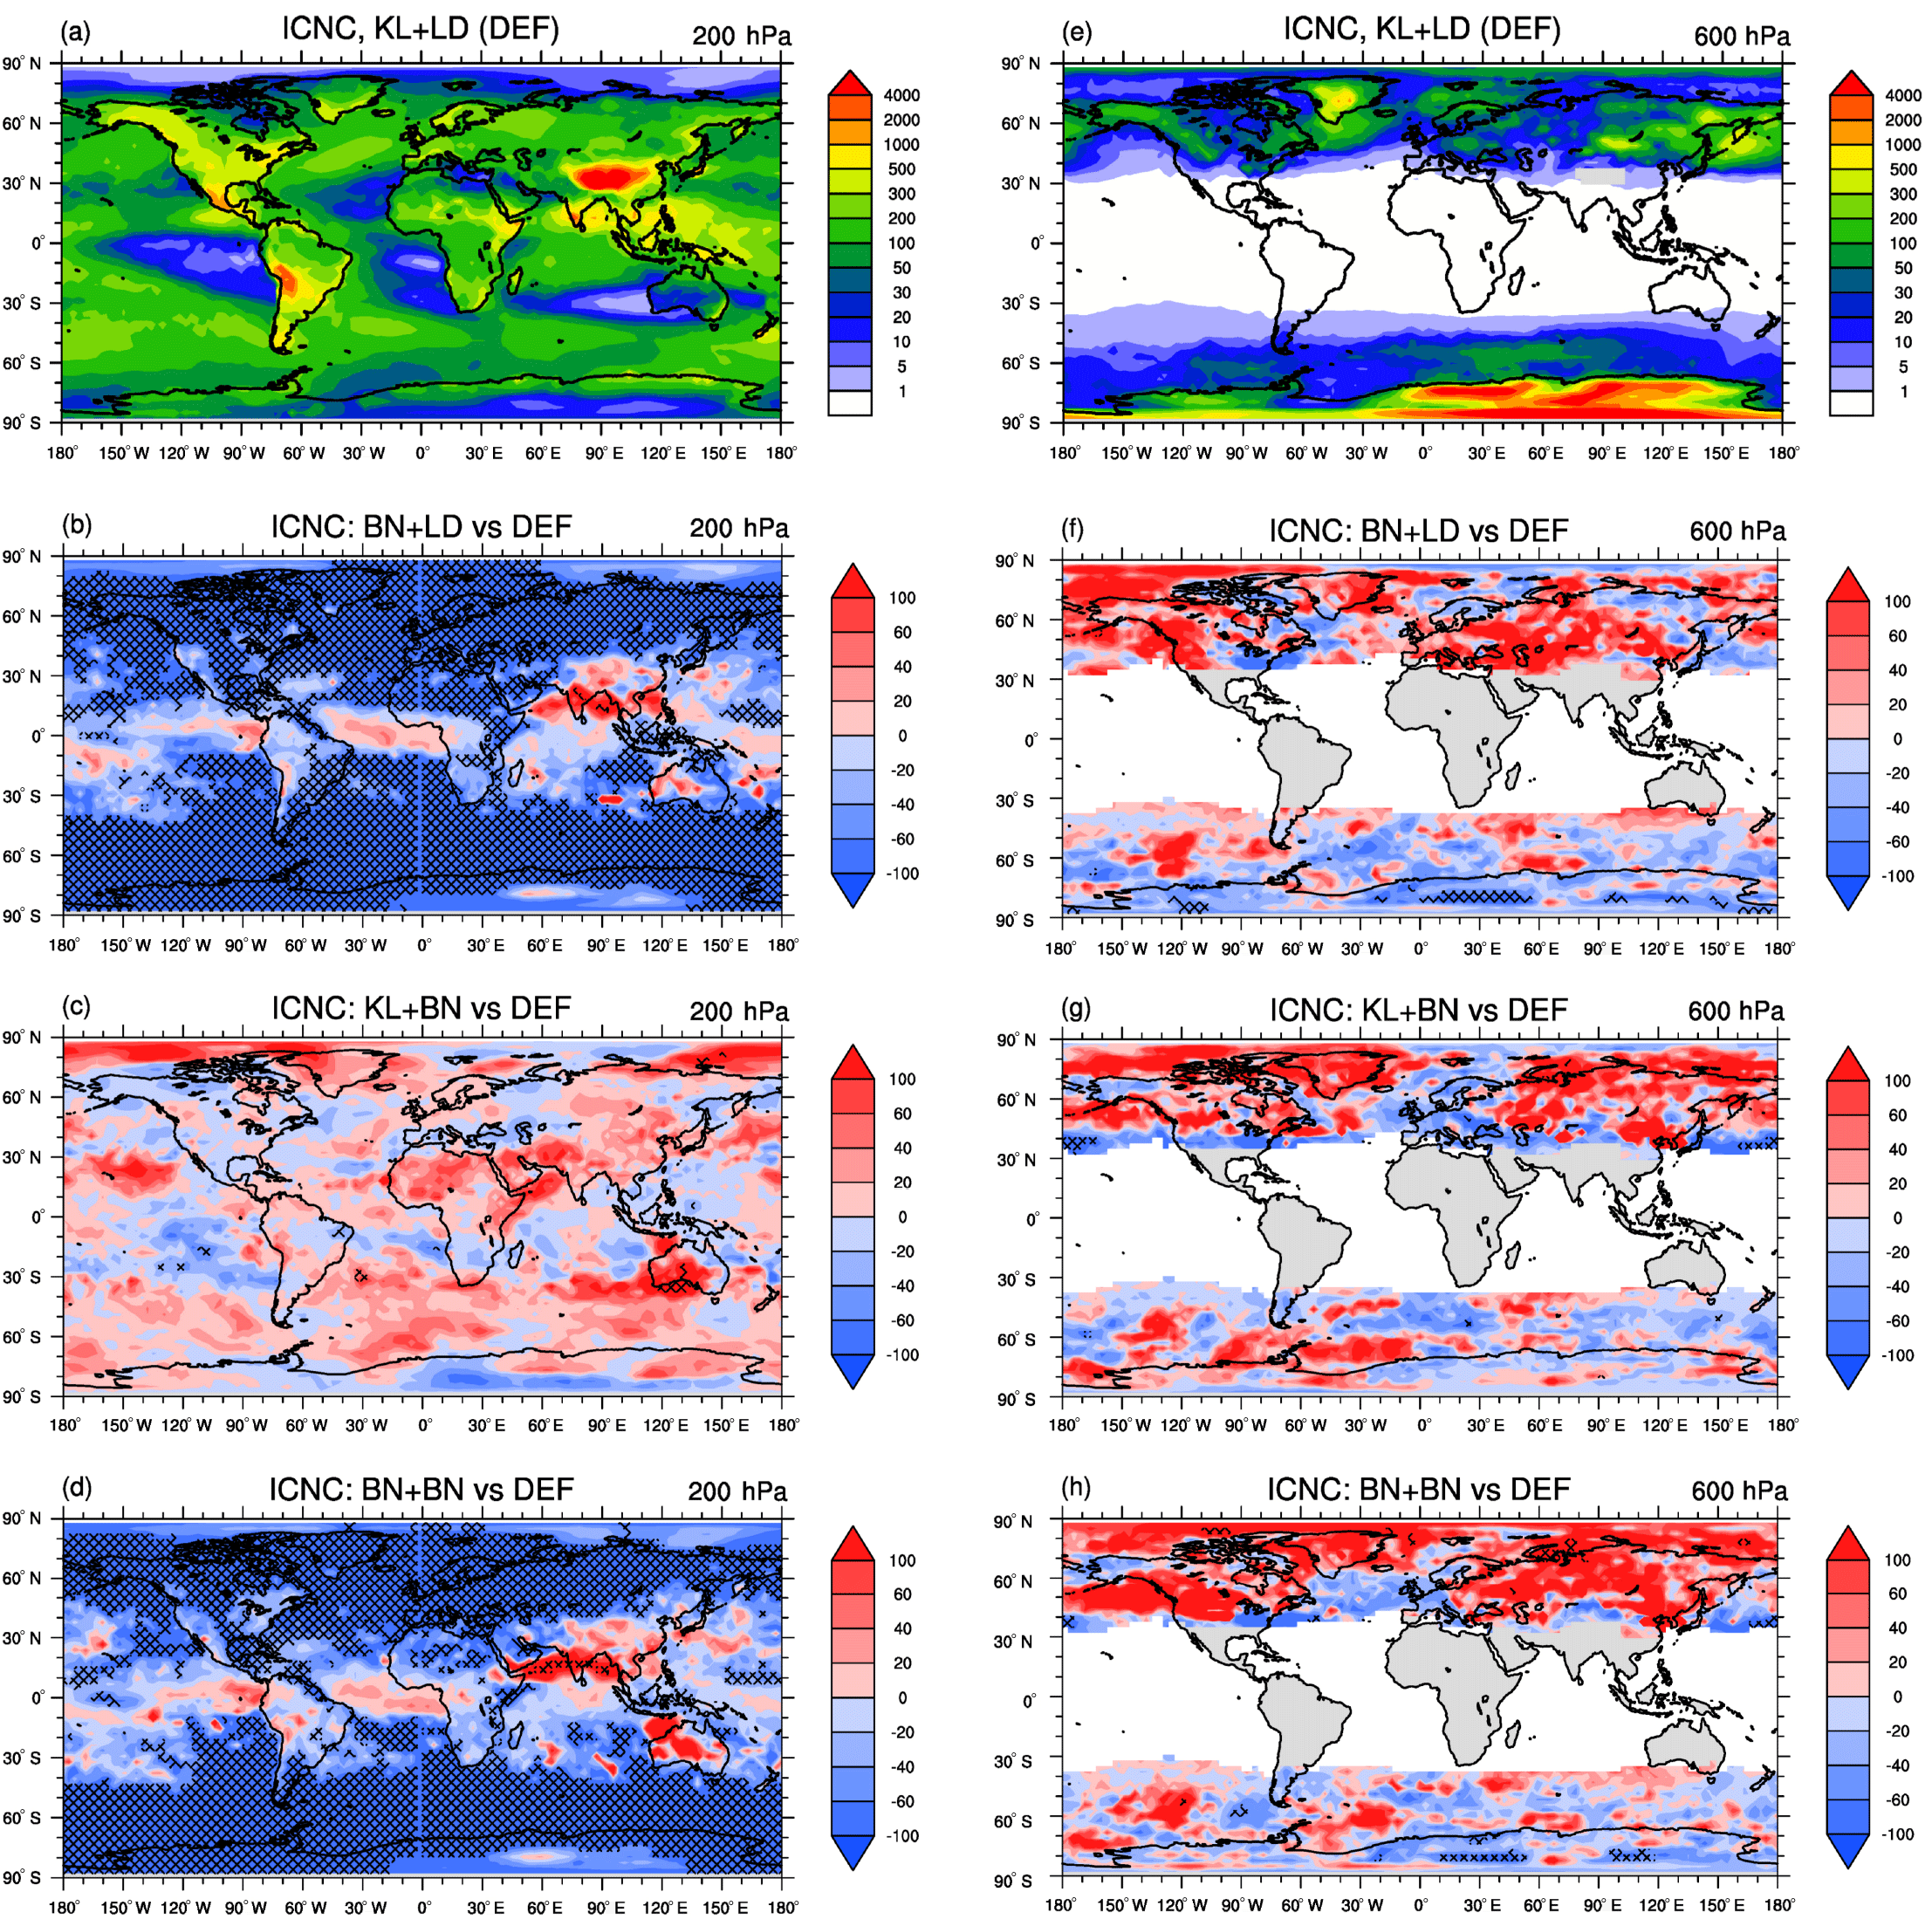
Figure 3Annual means of (grid-averaged) ice crystal number concentration (ICNC, L−1) at 200 hPa (cirrus regime) and 600 hPa (mixed-phase regime) for the default simulation KL+LD and the relative percentage changes in BN+LD, KL+BN, and BN+BN with respect to it (i.e. ). The crossed pattern indicates areas with a significance level of 95 %.
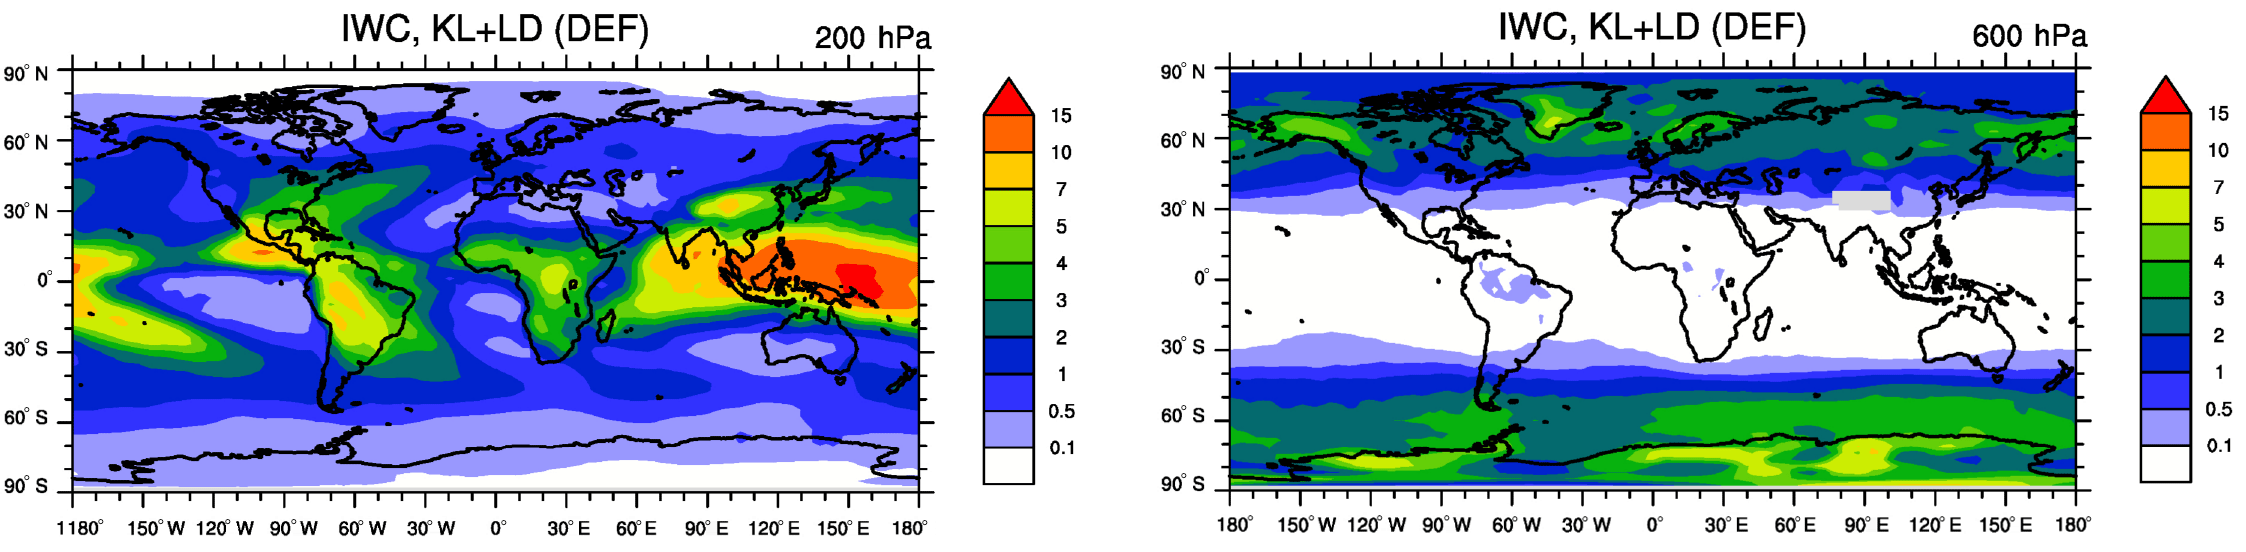
Figure 4Annual means of (grid-averaged) ice water content (IWC, mg kg−1) at 200 hPa (cirrus regime) and 600 hPa (mixed-phase regime) for the default simulation KL+LD.
4.1 Annual global means
Table 2 shows an overview of the global annual means of cloud microphysical variables and radiative fluxes computed for different observations and for all experiments, and the percentage changes with respect to the default simulation. The global vertically integrated ice crystal number concentration changes considerably depending on the ice scheme used in the cirrus regime and in the mixed-phase regime. When BN09 operates in the cirrus regime, ICNCburden decreases by 10 % due to the competition between homogeneous and heterogeneous nucleation and the PREICE effect (a similar result has been also found by Liu et al., 2012; Kuebbeler et al., 2014; and Shi et al., 2015). On the other hand, ICNCburden increases by almost 7 % when BN09 is used in the mixed-phase regime, i.e. when P13 simulates heterogeneous nucleation. On a large scale, these effects offset each other in BN+BN, where the global annual mean is basically unchanged with respect to the default simulation. Overall, the ICNCburden values are very close to the global annual means found by Lohmann et al. (2008) and Kuebbeler et al. (2014), while they are 1 order of magnitude higher compared to the results of Wang and Penner (2010) and Shi et al. (2015). ICNCburden,cirri and ICNCburden,mixed are vertically integrated ICNCs in the cirrus regime and in the mixed-phase regime, respectively. It is interesting to quantitatively see the different contributions to the total ICNC: ICNCsburden,cirri are about 6 times larger than the ICNCsburden,mixed when KL02 is used and about 5 times when BN09 is applied in the cirrus regime. In general, we observe that the variability in ICNC increases when BN09 is used. Vertically integrated cloud droplet number concentration (CDNCburden) is basically not influenced by the choice of the ice nucleation scheme. Its values are comparable with previous modelling studies (e.g. Lohmann et al., 2007; Hoose et al., 2008; Salzmann et al., 2010; Wang and Penner, 2010; Kuebbeler et al., 2014; Shi et al., 2015) and observations, although satellite observations are still affected by strong uncertainties (Bennartz and Rausch, 2017).
The ice water path (IWP) decreases by almost 7 % when BN09 is used in the cirrus regime, similarly to what has been found in Kuebbeler et al. (2014), who compared simulations assuming pure homogeneous nucleation against simulations including water vapour competition. Overall, the model underestimates the IWP, also found in other studies that applied ECHAM-HAM (e.g. Lohmann et al., 2008; Lohmann and Hoose, 2009; Kuebbeler et al., 2014; Gasparini et al., 2018); however, there are still large discrepancies among observational datasets which question the validation of the models (Duncan and Eriksson, 2018). The liquid water path (LWP) estimates derived from satellite observations vary substantially between 23 and 87 g m−2 (Li et al., 2012; Han et al., 1994). The modelled results fall within this range and the one indicated as acceptable in Mauritsen et al. (2012), which is 50–80 g m−2. The LWP variations among the experiments are much smaller than the IWP variations.
The absolute values of the shortwave cloud radiative effect (SCRE) and longwave cloud radiative effect (LCRE) are higher than those derived from satellite data, especially when KL02 is employed in the cirrus regime. However, when the net cloud radiative effect (NCRE) is computed, the same simulations with KL02 in the cirrus regime are closer to the observations. Looking at the absolute changes and the global distributions in the Supplement (Fig. S5) it is evident that the cloud radiative effects are sensitive to the ice nucleation scheme used for cirrus clouds. Indeed, SCRE with BN09 becomes weaker (more than 5 %) because of the less efficient scattering of shortwave radiation by fewer and larger crystals. More importantly, LCRE decreases up to 15 % in BN+LD because cirrus clouds, at the same, can trap less longwave radiation in the Earth–atmosphere system. As a result, NCRE becomes more negative, with statistical significance over some areas in the tropics and high latitudes, and the cooling effect is enhanced.
The total cloud cover (TCC) is slightly overestimated by the model (likely explaining why the cloud radiative forcing is high despite IWP being half of the observed values). However, Mauritsen et al. (2012) assert that a global model is acceptable if TCC is higher than 60 %. The changes with respect to the default simulation are very low (below 2 %), and the biggest change is in BN+LD where TCC reduces by 1.39 %, since lower ICNCs lead to higher sedimentation rates. Finally, the model tends to overestimate the total precipitation (Ptot), i.e. the sum of large scale and convective precipitations, but this has also been found with other global models (e.g. Barahona et al., 2014, with GEOS-5; Shi et al., 2015, with CAM5; and Lohmann et al., 2008, and Kuebbeler et al., 2014 with ECHAM-HAM). When BN09 is used in the cirrus regime, Ptot grows by 4 % especially because of the increase in the convective precipitation contribution, due to some feedbacks on the convective activity generated by the different ice nucleation schemes used, as mentioned in Sect. 3.2.
The annual zonal means of vertically integrated number concentration of ice crystals and cloud droplets, ice water path, liquid water path, shortwave and longwave cloud radiative effects, and total cloud cover are shown in Fig. S6 (in the Supplement) and are comparable with the literature cited before. The annual zonal mean profiles clearly show that the simulations using the same ice nucleation scheme in the cirrus regime are very close to each other, i.e. KL+LD and KL+BN, and BN+LD and BN+BN (as already visible in Table 2).
Overall, the model performs well with respect to observations and the literature. Mostly, the experiments do not yield evident differences among each other at the global scale, as regional variations may cancel out; however, there are clear effects on SCRE and LCRE from changing the cirrus ice nucleation scheme. As there is not a clear indication which simulation performs better, in the next subsection we extend our analysis including a statistical comparison with aircraft measurements.
Table 2Global annual means for simulations and observations. Shown are grid-averaged vertically integrated cloud droplet number concentration (CDNCburden, 1010 m−2), vertically integrated ice crystal number concentration (ICNCburden, 108 m−2), vertically integrated ice crystal number concentration in the cirrus regime (ICNCburden,cirri, 108 m−2), vertically integrated ice crystal number concentration in the mixed-phase regime (ICNCburden,mixed, 108 m−2), grid-averaged liquid water path (LWP, g m−2) and ice water path (IWP, g m−2), net shortwave radiative flux (SWNET,TOA, W m−2), longwave radiative flux (LWTOA, W m−2), and radiative imbalance (ImbalanceTOA, W m−2) at TOA, shortwave cloud radiative effect (SCRE, W m−2), longwave cloud radiative effect (LCRE, W m−2), net cloud radiative effect (NCRE, W m−2), total cloud cover (TCC, %), and total precipitation (Ptot, mm day−1). The values in brackets are (temporal) standard deviations. The sixth column contains the annual global means computed using the satellite data from ERBE 1985–19901 and 2000–20064, CERES-SYN1deg 2004–20102, CERES-EBAF 2000–20163, MODIS-TERRA 2004–20085, CMAP 1970–20166, GPCP 1979–20097, and global means taken from the literature: a is derived from AVHRR data (Gettelman et al., 2010), b from NOAA-9 and NOAA-10 data (Han et al., 1994), c from CloudSat data (Li et al., 2012), and d from ISCCP data (Storelvmo et al., 2008). The last three columns show the percentage changes (%) of the experiments 2, 3, and 4 with respect to the default simulation, i.e. .
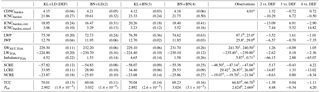
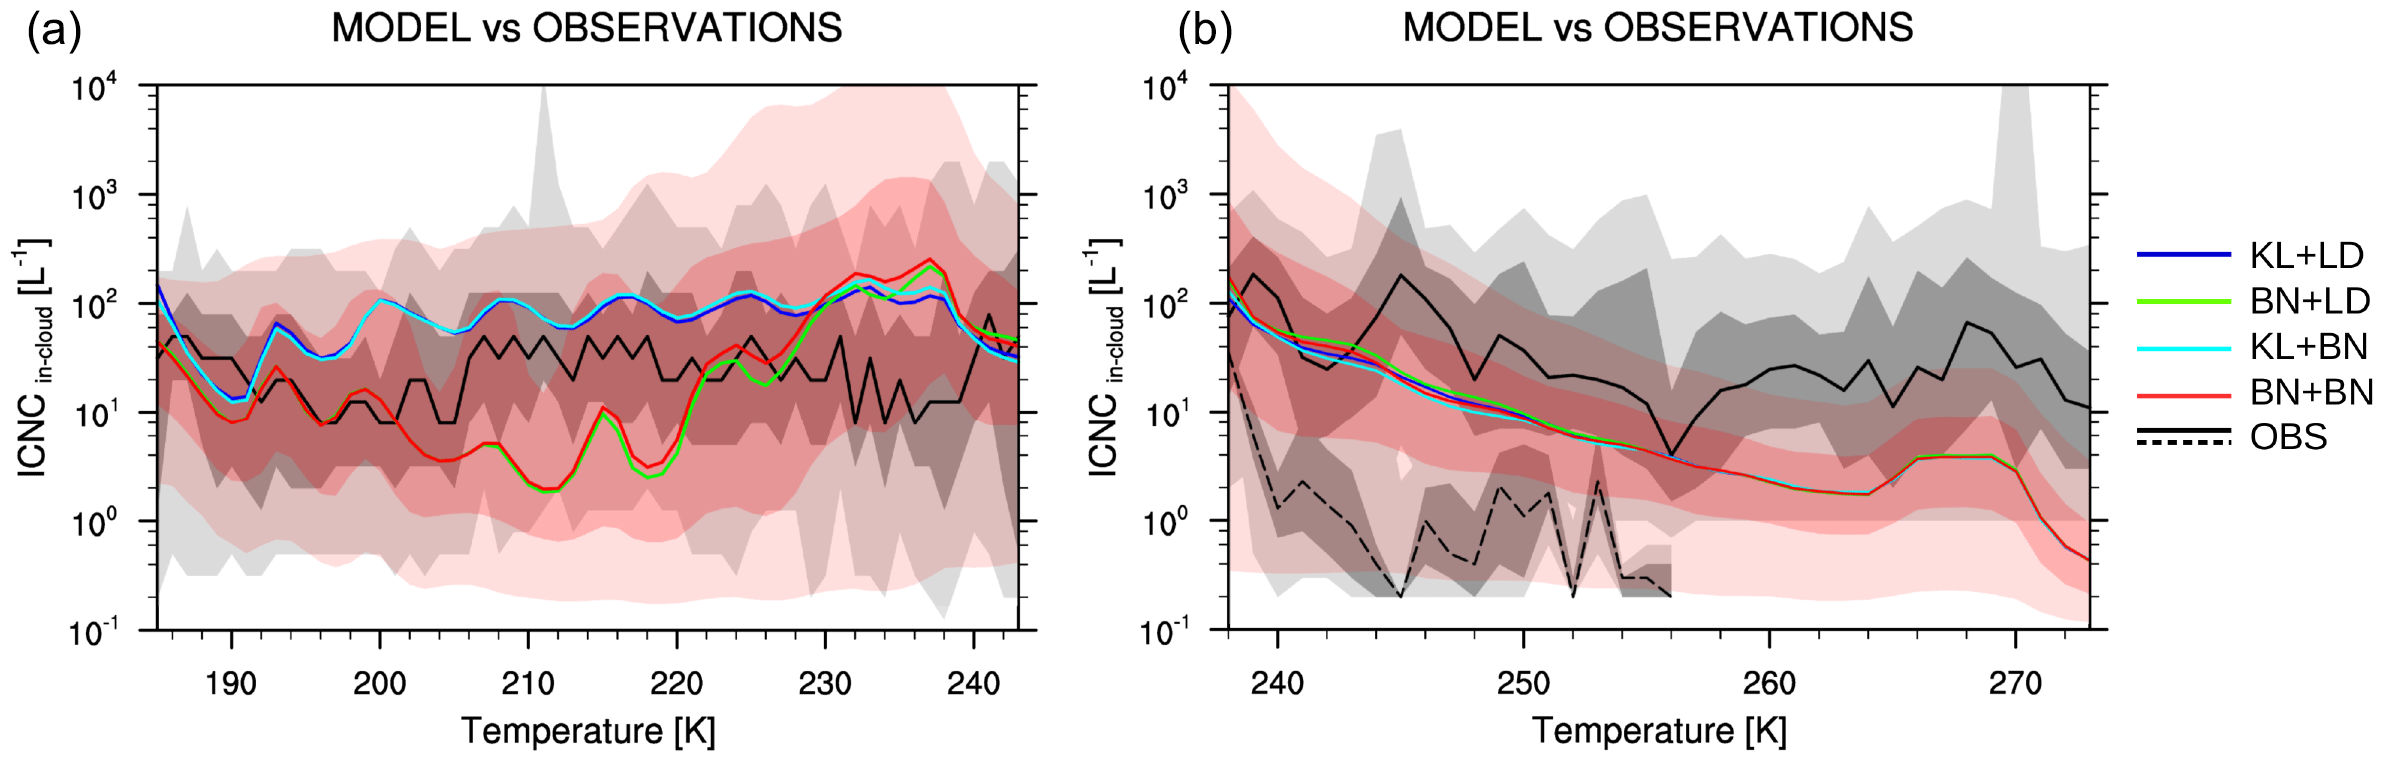
Figure 5In-cloud ice crystal number concentrations (ICNCin−cloud, L−1) versus temperature for modelled results and flight measurements. Medians are computed for modelled results (using daily means between 25∘ S and 75∘ N, masking ICNCin-cloud<0.1 L−1, i.e. the minimum observed value) and observations, for each 1 K temperature bin. They are shown with coloured lines: KL+LD (blue), BN+LD (green), KL+BN (light blue), BN+BN (red), and observations (black). Darker gray/red colours indicate the observations/BN+BN between the 25th and 75th percentiles, while lighter gray/red colours indicate the observations/BN+BN between the 5th and 95th percentiles. (a) Cirrus regime: the modelled medians are computed approximately in the range of 4–20 km height, the observations come from Martina Krämer (personal communication, not yet published, 2017). (b) Mixed-phase regime: the modelled medians are computed approximately in the range of 0–20 km height, the observations belong to the projects WISP-94 (solid line) and ICE-L (dashed line) and concern INP concentrations.
4.2 Comparison with aircraft measurements
The validation of climate models with measurements from field experiments or aircraft campaigns is always limited by the fact that the models have difficulties to capture individual meteorological events. Nevertheless, here we consider a large collection of aircraft measurements recorded over 15 years, between 1999 and 2014 (Martina Krämer, personal communication, not yet published, 2017). Eighteen field campaigns (in total, 113 flights with about 127 h in cirrus clouds) covered Europe, Australia, Africa, Seychelles, Brazil, the USA, Costa Rica, and the tropical Pacific (i.e. between 25∘ S and 75∘ N) in the temperature range of 185–243 K. This extensive observational dataset is compared to the modelled in-cloud ICNCs in Fig. 5a. The observed ICNC varies between 8 and 80 L−1 over the entire temperature range, and the lower and upper quartiles vary between 0.6 and 300 L−1. Again, the simulations can be grouped into two sets according to the ice nucleation scheme used in the cirrus regime, i.e. KL+LD/KL+BN and BN+LD/BN+BN, because of their similarities. For most of the temperature range, the simulations which use KL02 in the cirrus regime overestimate the observed ICNCs (although they mostly remain below the 75th percentile). The overestimation of ICNCs is common to other modelling studies (e.g. Wang and Penner, 2010; Liu et al., 2012; Shi et al., 2015) and especially in cold cirrus clouds (for T<205 K). On the other hand, the simulations which use BN09 in the cirrus regime are very close to the observations at temperatures below 200 K and between 220 and 230 K, while they underestimate ICNCs between 200 and 220 K. In this temperature range the simulations can exceed the observed 25th percentile (although remaining within the 5th percentile). In comparison with the other two simulations, BN+LD and BN+BN always predict lower ICNCs at temperatures below 230 K, as expected because of the competition and PREICE effects. Finally, all four simulations overestimate ICNCs by 1 order of magnitude in the temperature range 230–240 K.
Overall, the simulations BN+LD and BN+BN agree particularly well with the measurements at temperatures lower than 200 K but underestimate the ICNCs within the interval 200–220 K, due to an overestimation of the competitive nucleation and PREICE effects. Barahona et al. (2010) showed that the competitive nucleation effect is small using P13. Also, Liu et al. (2012) found that BN09 (using the parameterization of Phillips et al., 2008, for heterogeneous nucleation) and BNhom produced very similar results in the cirrus regime, suggesting that the competitive nucleation effect was small because of the low ICNCs formed heterogeneously. Thus, we can deduce that the PREICE effect is the one which is likely overestimated in our simulations. Interestingly, modelled ICNCs do not show any particular trend, as with Kuebbeler et al. (2014) who used ECHAM-HAM. Disagreeing, other studies found that ICNCs are inversely proportional with temperature, e.g. Liu et al. (2012) and Shi et al. (2015) with CAM5 (using both the ice nucleation scheme of Liu and Penner (2005) and BN09) and Barahona et al. (2010) with GEOS-5 and BN09. Such distinct behaviours are likely derived from the wide model variabilities in reproducing subgrid-scale processes, like vertical velocity, which play a role in ice nucleation. We reiterate that ICNC is highly dependent on the vertical velocity which is usually poorly represented in terms of spatial and temporal variability (Barahona et al., 2017).
For further information, in Fig. 5b we also show the modelled in-cloud ICNCs in the mixed-phase regime, considering the same latitudes as the case before (25∘ S–75∘ N). The simulations do not show significant differences among each other. The distinctive features are the ICNC decrease with increasing temperatures and a positive “bulge” between 265 and 270 K caused by secondary ice production (rime splintering). The modelled ICNCs are in quite good agreement with two data sets of flight measurements taken from the projects Winter Icing and Storms Project (WISP-94) and Ice in Clouds Experiment–Layer Clouds (ICE-L), which consider about 99 and 46 flight hours, respectively. It is important to stress that this comparison is less accurate than the previous one because the observations here are much more limited both in time and in space than the extensive observational data used for the cirrus regime. It should also be noted that the measurements actually concern INPs. When the INP number is not high enough to deplete the ambient supersaturation, INP concentrations and ICNCs can correspond; however, it is well known that the two concentrations show discrepancies with increasing temperature because of the secondary ice formation (Kanji et al., 2017). Finally, ICNCs in Fig. 5b are in good agreement with the results of Heymsfield et al. (2013), also based on flight campaigns. They found that ICNCs decrease as temperature increases and are within the range 5–50 L−1 in the mixed-phase regime.
Besides the flight measurements, the recent ICNC estimates from lidar–radar satellite retrievals must be mentioned, e.g. Sourdeval et al. (2018) and Gryspeerdt et al. (2018b). In particular, Gryspeerdt et al. (2018b) analysed the behaviour of ICNCs within clouds as a function of temperature. Contrary to Fig. 5a, they showed that there is a weak temperature dependence of ICNC, which increases with decreasing temperature. On the other hand, similarly to Fig. 5, they found a small increase in ICNC around 265–270 K, and, interestingly, a small peak at about 233 K due to orographic and frontal regimes, which could explain our higher modelled ICNCs between 230 and 240 K.
In this study we have implemented the ice nucleation scheme of Barahona and Nenes (2009) into the global chemistry-climate model EMAC. The parameterization takes into account the water vapour competition between homogeneous and heterogeneous nucleation and has been modified to also consider the depositional growth of pre-existing ice crystals. Heterogeneous nucleation can be computed through different INP parameterizations, and we have chosen the empirical INP parameterization of Phillips et al. (2013) for our experiments. We have tested the BN09 scheme operating in the cirrus and/or in the mixed-phase regimes and compared the results with the standard configuration of the model, which assumes that cirrus clouds form via pure homogeneous nucleation (Kärcher and Lohmann, 2002) and uses the immersion nucleation parameterization of Lohmann and Diehl (2006) for mixed-phase clouds.
Focusing on the ice-related results, e.g. ICNC and IWC, we found that using BN09 in the cirrus regime strongly reduces the total ICNC worldwide because of the competition and PREICE effects, but increases ICNC along the tropics. In contrast, BN09 in the mixed-phase regime produces slightly higher ICNCs, especially in the NH where mineral dust particles are more abundant. We found that changing the ice nucleation scheme in the cirrus regime generates larger differences in ICNC and IWC than changing parameterization in the mixed-phase regime, that is the simulations using the same parameterization in the cirrus regime (e.g. BN+LD and BN+BN) are easily discernible from the others (LD+KL and LD+BN). Interestingly, we observed a certain dependence of ICNC and IWC in the mixed-phase regime on the parameterization used for cirrus clouds, likely due to a faster sedimentation of larger ice crystals produced by BN09 in cirrus clouds at higher altitudes.
Overall, all modelled results agree well with global observations and the literature data. The comparison made with flight measurements has pointed out that ICNCs are overestimated by KL02 in the cirrus regime. BN09 agrees well with the observations in cold cirrus clouds, but the PREICE effect is likely overestimated causing the underestimation of ICNCs between 200 and 220 K.
As BN09 takes into account additional processes which were previously neglected by the standard version of the model, without consuming extra computational resources, we recommend to apply this ice nucleation scheme in future EMAC simulations. We also suggest to select P13 among the INP parameterizations available in BN09, since it incorporates the ice-nucleating ability of different aerosol species (dust, soot, bioaerosols, and soluble organics) and simulates both deposition and immersion/condensation nucleation. By using the configuration BN+BN, the EMAC model becomes one of the few GCMs which take into account, in a detailed manner, the complexity of ice nucleation. Finally, this work offers further material for future GCM comparisons with a focus on ICNC estimates and for future modelling evaluations against flight measurements and lidar–radar satellite retrievals.
The Modular Earth Submodel System (MESSy) is continuously developed and applied by a consortium of institutions. The usage of MESSy and access to the source code is licensed to all affiliates of institutions, which are members of the MESSy consortium. Institutions can become a member of the MESSy consortium by signing the MESSy Memorandum of Understanding. More information can be found on the MESSy consortium website (http://www.messy-interface.org, last access: 4 October 2018). All code modifications presented in this article will be included in the next version of MESSy.
In this appendix we provide some additional technical information about the
implementation of BN09 into the EMAC model. The BN09 parameterization has
been added as a Fortran95 module in the submodel core layer (SMCL) of MESSy
(named as messy_cloud_ice_BN09.f90). BN09 operates in the cirrus
regime and/or in the mixed-phase regime according to the calls made in the
CLOUD submodel (messy_cloud_lohmann10.f90). As shown in
Fig. 1, BN09 computes the newly formed ice crystals in the
cirrus regime when nicnc=3 and in the mixed-phase regime when
limm_BN09=.TRUE., where nicnc and limm_BN09 are
variables defined in the namelist file cloud.nml (the set-up of
cloud.nml for the simulation BN+BN is shown in Table S1 as an
example).
Other changes made during the implementation are the following.
-
Temperature threshold. The original BN09 assumes the value 235 K as a temperature threshold between the two regimes, while the CLOUD submodel uses the value 238.15 K. For consistency, we used the second threshold as a limit condition to call BN09, and we changed the original threshold of BN09 to the value 238.15 K inside the BN09 code.
-
Number concentration and diameter of cloud droplets. The original BN09 computes the cloud droplet number concentration starting from the number concentration of sulfate aerosol in the Aitken mode. However, since the EMAC model computes the activated cloud droplet number concentration via other parameterizations (e.g. Abdul-Razzak and Ghan, 2000; Lin and Leaitch, 1997; Karydis et al., 2017), we provide BN09 with such variable (neglecting the corresponding computations inside the BN09 code). Unfortunately, these parameterizations do not compute the diameter of the new cloud droplets; therefore, BN09 still computes the diameter using the wet diameter of aerosol in the Aitken mode (i.e. Dc).
The supplement related to this article is available online at: https://doi.org/10.5194/gmd-11-4021-2018-supplement.
SB wrote the paper with contributions from all coauthors. VAK, APT, and JL proposed the development of the CLOUD submodel. AN and DB provided the ice nucleation parameterization. SB – together with SCS, AP, and HT – performed the implementation in EMAC. MK provided the flight measurements. All authors were involved in discussions during the analyses.
The authors declare that they have no conflict of interest.
We would like to thank Mattia Righi from the German Aerospace Center (DLR)
for the discussion on the modelled results. We acknowledge the usage of the
Max Planck Computing and Data Facility (MPCDF) for the simulations performed
in this work. Sylvia C. Sullivan and Athanasios Nenes acknowledge funding
from a NASA Earth and Space Science Fellowship (NNX13AN74H), a NASA MAP grant
(NNX13AP63G), and a DOE EaSM grant (SC0007145). Moreover, Athanasios Nenes
acknowledges funding by the European Research Council Consolidator Grant
726165 (PyroTRACH), Vlassis A. Karydis acknowledges support from an FP7 Marie
Curie Career Integration Grant (project reference 618349), Holger Tost
acknowledges funding from the Carl-Zeiss Foundation, and Alexandra P.
Tsimpidi acknowledges support from a DFG individual grand programme (project
reference TS 335/2-1). Finally, we acknowledge the use of the programmes Ferret
(product of the NOAA's Pacific Marine Environmental Laboratory,
http://ferret.pmel.noaa.gov/Ferret/, last access: 3 September 2018) and NCL (product of the Computational and Information Systems
Laboratory at the NCAR, https://www.ncl.ucar.edu/, last access: 3 September 2018) for the analyses and graphics in this
paper.
The article processing charges for this open-access
publication were covered by the Max Planck Society.
Edited by: Simon Unterstrasser
Reviewed by: two anonymous referees
Abdul-Razzak, H. and Ghan, S. J.: A parameterization of aerosol activation: 2. Multiple aerosol types, J. Geophys. Res.-Atmos., 105, 6837–6844, https://doi.org/10.1029/1999JD901161, 2000. a
Ackermann, I. J., Hass, H., Memmesheimer, M., Ebel, A., Binkowski, F. S., and Shankar, U.: Modal aerosol dynamics model for Europe: development and first applications, Atmos. Environ., 32, 2981–2999, https://doi.org/10.1016/S1352-2310(98)00006-5, 1998. a
Aquila, V., Hendricks, J., Lauer, A., Riemer, N., Vogel, H., Baumgardner, D., Minikin, A., Petzold, A., Schwarz, J. P., Spackman, J. R., Weinzierl, B., Righi, M., and Dall'Amico, M.: MADE-in: a new aerosol microphysics submodel for global simulation of insoluble particles and their mixing state, Geosci. Model Dev., 4, 325–355, https://doi.org/10.5194/gmd-4-325-2011, 2011. a
Barahona, D. and Nenes, A.: Parameterization of cirrus cloud formation in large-scale models: Homogeneous nucleation, J. Geophys. Res.-Atmos., 113, d11211, https://doi.org/10.1029/2007JD009355, 2008. a, b, c
Barahona, D. and Nenes, A.: Parameterizing the competition between homogeneous and heterogeneous freezing in ice cloud formation – polydisperse ice nuclei, Atmos. Chem. Phys., 9, 5933–5948, https://doi.org/10.5194/acp-9-5933-2009, 2009. a, b, c, d, e, f, g
Barahona, D. and Nenes, A.: Dynamical states of low temperature cirrus, Atmos. Chem. Phys., 11, 3757–3771, https://doi.org/10.5194/acp-11-3757-2011, 2011. a, b, c
Barahona, D., Rodriguez, J., and Nenes, A.: Sensitivity of the global distribution of cirrus ice crystal concentration to heterogeneous freezing, J. Geophys. Res.-Atmos., 115, d23213, https://doi.org/10.1029/2010JD014273, 2010. a, b, c
Barahona, D., Molod, A., Bacmeister, J., Nenes, A., Gettelman, A., Morrison, H., Phillips, V., and Eichmann, A.: Development of two-moment cloud microphysics for liquid and ice within the NASA Goddard Earth Observing System Model (GEOS-5), Geosci. Model Dev., 7, 1733–1766, https://doi.org/10.5194/gmd-7-1733-2014, 2014. a, b, c, d, e, f
Barahona, D., Molod, A., and Kalesse, H.: Direct estimation of the global distribution of vertical velocity within cirrus clouds, Sci. Rep.-UK, 7, 1–11, https://doi.org/10.1038/s41598-017-07038-6, 2017. a, b, c, d, e
Bennartz, R. and Rausch, J.: Global and regional estimates of warm cloud droplet number concentration based on 13 years of AQUA-MODIS observations, Atmos. Chem. Phys., 17, 9815–9836, https://doi.org/10.5194/acp-17-9815-2017, 2017. a
Brinkop, S. and Roeckner, E.: Sensitivity of a general circulation model to parameterizations of cloud–turbulence interactions in the atmospheric boundary layer, Tellus A, 47, 197–220, https://doi.org/10.1034/j.1600-0870.1995.t01-1-00004.x, 1995. a
Cantrell, W. and Heymsfield, A.: Production of Ice in Tropospheric Clouds: A Review, B. Am. Meteorol. Soc., 86, 795–807, https://doi.org/10.1175/BAMS-86-6-795, 2005. a
Chen, T., Rossow, W. B., and Zhang, Y.: Radiative Effects of Cloud-Type Variations, J. Climate, 13, 264–286, https://doi.org/10.1175/1520-0442(2000)013<0264:REOCTV>2.0.CO;2, 2000. a
Clarke, L., Edmonds, J., Jacoby, H., Pitcher, H., Reilly, J., and Richels, R.: Scenarios of Greenhouse Gas Emissions and Atmospheric Concentrations, Sub-report 2.1A of Synthesis and Assessment Product 2.1 by the US Climate Change Science Program and the Subcommittee on Global Change Research, Department of Energy, Office of Biological & Environmental Research, Washington, DC, USA, 260 pp., 2007. a
Cziczo, D. J., Froyd, K. D., Hoose, C., Jensen, E. J., Diao, M., Zondlo, M. A., Smith, J. B., Twohy, C. H., and Murphy, D. M.: Clarifying the Dominant Sources and Mechanisms of Cirrus Cloud Formation, Science, 340, 1320–1324, https://doi.org/10.1126/science.1234145, 2013. a
Dentener, F., Kinne, S., Bond, T., Boucher, O., Cofala, J., Generoso, S., Ginoux, P., Gong, S., Hoelzemann, J. J., Ito, A., Marelli, L., Penner, J. E., Putaud, J.-P., Textor, C., Schulz, M., van der Werf, G. R., and Wilson, J.: Emissions of primary aerosol and precursor gases in the years 2000 and 1750 prescribed data-sets for AeroCom, Atmos. Chem. Phys., 6, 4321–4344, https://doi.org/10.5194/acp-6-4321-2006, 2006. a
Diehl, K. and Wurzler, S.: Heterogeneous Drop Freezing in the Immersion Mode: Model Calculations Considering Soluble and Insoluble Particles in the Drops, J. Atmos. Sci., 61, 2063–2072, https://doi.org/10.1175/1520-0469(2004)061<2063:HDFITI>2.0.CO;2, 2004. a
Dietmüller, S., Jöckel, P., Tost, H., Kunze, M., Gellhorn, C., Brinkop, S., Frömming, C., Ponater, M., Steil, B., Lauer, A., and Hendricks, J.: A new radiation infrastructure for the Modular Earth Submodel System (MESSy, based on version 2.51), Geosci. Model Dev., 9, 2209–2222, https://doi.org/10.5194/gmd-9-2209-2016, 2016. a
Donner, L. J., O'Brien, T. A., Rieger, D., Vogel, B., and Cooke, W. F.: Are atmospheric updrafts a key to unlocking climate forcing and sensitivity?, Atmos. Chem. Phys., 16, 12983–12992, https://doi.org/10.5194/acp-16-12983-2016, 2016. a
Duncan, D. I. and Eriksson, P.: An update on global atmospheric ice estimates from satellite observations and reanalyses, Atmos. Chem. Phys., 18, 11205–11219, https://doi.org/10.5194/acp-18-11205-2018, 2018. a
Fountoukis, C. and Nenes, A.: ISORROPIA II: a computationally efficient thermodynamic equilibrium model for K+–Ca2+– Mg2+––Na+–––Cl−–H2O aerosols, Atmos. Chem. Phys., 7, 4639–4659, https://doi.org/10.5194/acp-7-4639-2007, 2007. a
Gasparini, B. and Lohmann, U.: Why cirrus cloud seeding cannot substantially cool the planet, J. Geophys. Res.-Atmos., 121, 4877–4893, https://doi.org/10.1002/2015JD024666, 2016. a
Gasparini, B., Meyer, A., Neubauer, D., Münch, S., and Lohmann, U.: Cirrus Cloud Properties as Seen by the CALIPSO Satellite and ECHAM-HAM Global Climate Model, J. Climate, 31, 1983–2003, https://doi.org/10.1175/JCLI-D-16-0608.1, 2018. a
Gettelman, A., Liu, X., Ghan, S. J., Morrison, H., Park, S., Conley, A. J., Klein, S. A., Boyle, J., Mitchell, D. L., and Li, J.-L. F.: Global simulations of ice nucleation and ice supersaturation with an improved cloud scheme in the Community Atmosphere Model, J. Geophys. Res.-Atmos., 115, d18216, https://doi.org/10.1029/2009JD013797, 2010. a
Gettelman, A., Liu, X., Barahona, D., Lohmann, U., and Chen, C.: Climate impacts of ice nucleation, J. Geophys. Res.-Atmos., 117, d20201, https://doi.org/10.1029/2012JD017950, 2012. a
Gryspeerdt, E., Quaas, J., Goren, T., Klocke, D., and Brueck, M.: An automated cirrus classification, Atmos. Chem. Phys., 18, 6157–6169, https://doi.org/10.5194/acp-18-6157-2018, 2018a. a, b
Gryspeerdt, E., Sourdeval, O., Quaas, J., Delanoë, J., and Kühne, P.: Ice crystal number concentration estimates from lidar-radar satellite retrievals. Part 2: Controls on the ice crystal number concentration, Atmos. Chem. Phys. Discuss., https://doi.org/10.5194/acp-2018-21, in review, 2018b. a, b, c
Gultepe, I. and Heymsfield, A. J.: Introduction Ice Fog, Ice Clouds, and Remote Sensing, Pure Appl. Geophys., 173, 2977–2982, https://doi.org/10.1007/s00024-016-1380-2, 2016. a
Guo, H., Liu, Y., Daum, P. H., Senum, G. I., and Tao, W.-K.: Characteristics of vertical velocity in marine stratocumulus: comparison of large eddy simulations with observations, Environ. Res. Lett., 3, 1–8, https://doi.org/10.1088/1748-9326/3/4/045020, 2008. a
Haag, W., Kärcher, B., Ström, J., Minikin, A., Lohmann, U., Ovarlez, J., and Stohl, A.: Freezing thresholds and cirrus cloud formation mechanisms inferred from in situ measurements of relative humidity, Atmos. Chem. Phys., 3, 1791–1806, https://doi.org/10.5194/acp-3-1791-2003, 2003. a, b
Han, Q., Rossow, W. B., and Lacis, A. A.: Near-Global Survey of Effective Droplet Radii in Liquid Water Clouds Using ISCCP Data, J. Climate, 7, 465–497, https://doi.org/10.1175/1520-0442(1994)007<0465:NGSOED>2.0.CO;2, 1994. a
Hendricks, J., Kärcher, B., and Lohmann, U.: Effects of ice nuclei on cirrus clouds in a global climate model, J. Geophys. Res.-Atmos., 116, d18206, https://doi.org/10.1029/2010JD015302, 2011. a, b, c
Heymsfield, A. J., Schmitt, C., and Bansemer, A.: Ice Cloud Particle Size Distributions and Pressure-Dependent Terminal Velocities from In Situ Observations at Temperatures from 0∘ to 86∘C, J. Atmos. Sci., 70, 4123–4154, https://doi.org/10.1175/JAS-D-12-0124.1, 2013. a
Heymsfield, A. J., Krämer, M., Luebke, A., Brown, P., Cziczo, D. J., Franklin, C., Lawson, P., Lohmann, U., McFarquhar, G., Ulanowski, Z., and Van Tricht, K.: Cirrus Clouds, Meteor. Mon., 58, 2.1–2.26, https://doi.org/10.1175/AMSMONOGRAPHS-D-16-0010.1, 2017. a, b
Hong, Y., Liu, G., and Li, J.-L. F.: Assessing the Radiative Effects of Global Ice Clouds Based on CloudSat and CALIPSO Measurements, J. Climate, 29, 7651–7674, https://doi.org/10.1175/JCLI-D-15-0799.1, 2016. a
Hoose, C., Lohmann, U., Bennartz, R., Croft, B., and Lesins, G.: Global simulations of aerosol processing in clouds, Atmos. Chem. Phys., 8, 6939–6963, https://doi.org/10.5194/acp-8-6939-2008, 2008. a
ICE-L: Continuous Flow Diffusion Chamber Ice Nuclei, Version 1.0, UCAR/NCAR – Earth Observing Laboratory, available at: https://doi.org/10.5065/D6GF0RTM (last access: 14 December 2017), 2011. a
IPCC: Climate Change 2013: The Physical Science Basis, Cambridge University Press, 1535 pp., 2013. a
Jensen, E. J., Diskin, G., Lawson, R. P., Lance, S., Bui, T. P., Hlavka, D., McGill, M., Pfister, L., Toon, O. B., and Gao, R.: Ice nucleation and dehydration in the Tropical Tropopause Layer, P. Natl. Acad. Sci. USA, 110, 2041–2046, https://doi.org/10.1073/pnas.1217104110, 2013. a, b
Jöckel, P., Kerkweg, A., Pozzer, A., Sander, R., Tost, H., Riede, H., Baumgaertner, A., Gromov, S., and Kern, B.: Development cycle 2 of the Modular Earth Submodel System (MESSy2), Geosci. Model Dev., 3, 717–752, https://doi.org/10.5194/gmd-3-717-2010, 2010. a
Joos, H., Spichtinger, P., Lohmann, U., Gayet, J.-F., and Minikin, A.: Orographic cirrus in the global climate model ECHAM5, J. Geophys. Res.-Atmos., 113, D18205, https://doi.org/10.1029/2007JD009605, 2008. a
Kanji, Z. A., Ladino, L. A., Wex, H., Boose, Y., Burkert-Kohn, M., Cziczo, D. J., and Krämer, M.: Overview of Ice Nucleating Particles, Meteor. Mon., 58, 1.1–1.33, https://doi.org/10.1175/AMSMONOGRAPHS-D-16-0006.1, 2017. a, b
Kärcher, B. and Lohmann, U.: A parameterization of cirrus cloud formation: Homogeneous freezing of supercooled aerosols, J. Geophys. Res.-Atmos., 107, AAC 4–1–AAC 4–10, https://doi.org/10.1029/2001JD000470, 2002. a, b, c, d
Kärcher, B. and Lohmann, U.: A parameterization of cirrus cloud formation: Heterogeneous freezing, J. Geophys. Res.-Atmos., 108, 4402, https://doi.org/10.1029/2002JD003220, 2003. a, b
Kärcher, B. and Ström, J.: The roles of dynamical variability and aerosols in cirrus cloud formation, Atmos. Chem. Phys., 3, 823–838, https://doi.org/10.5194/acp-3-823-2003, 2003. a
Kärcher, B., Hendricks, J., and Lohmann, U.: Physically based parameterization of cirrus cloud formation for use in global atmospheric models, J. Geophys. Res.-Atmos., 111, d01205, https://doi.org/10.1029/2005JD006219, 2006. a, b, c
Karydis, V. A., Kumar, P., Barahona, D., Sokolik, I. N., and Nenes, A.: On the effect of dust particles on global cloud condensation nuclei and cloud droplet number, J. Geophys. Res.-Atmos., 116, D23204, https://doi.org/10.1029/2011JD016283, 2011. a
Karydis, V. A., Tsimpidi, A. P., Pozzer, A., Astitha, M., and Lelieveld, J.: Effects of mineral dust on global atmospheric nitrate concentrations, Atmos. Chem. Phys., 16, 1491–1509, https://doi.org/10.5194/acp-16-1491-2016, 2016. a
Karydis, V. A., Tsimpidi, A. P., Bacer, S., Pozzer, A., Nenes, A., and Lelieveld, J.: Global impact of mineral dust on cloud droplet number concentration, Atmos. Chem. Phys., 17, 5601–5621, https://doi.org/10.5194/acp-17-5601-2017, 2017. a, b, c
Kerkweg, A., Buchholz, J., Ganzeveld, L., Pozzer, A., Tost, H., and Jöckel, P.: Technical Note: An implementation of the dry removal processes DRY DEPosition and SEDImentation in the Modular Earth Submodel System (MESSy), Atmos. Chem. Phys., 6, 4617–4632, https://doi.org/10.5194/acp-6-4617-2006, 2006. a
Klingmüller, K., Metzger, S., Abdelkader, M., Karydis, V. A., Stenchikov, G. L., Pozzer, A., and Lelieveld, J.: Revised mineral dust emissions in the atmospheric chemistry–climate model EMAC (MESSy 2.52 DU_Astitha1 KKDU2017 patch), Geosci. Model Dev., 11, 989–1008, https://doi.org/10.5194/gmd-11-989-2018, 2018. a
Koop, T., Luo, B., Tsias, A., and Peter, T.: Water activity as the determinant for homogeneous ice nucleation in aqueous solutions, Nature, 406, 611–614, https://doi.org/10.1038/35020537, 2000. a
Korolev, A.: Limitations of the Wegener–Bergeron–Findeisen Mechanism in the Evolution of Mixed-Phase Clouds, J. Atmos. Sci., 64, 3372–3375, https://doi.org/10.1175/JAS4035.1, 2007. a
Korolev, A., McFarquhar, G., Field, P. R., Franklin, C., Lawson, P., Wang, Z., Williams, E., Abel, S. J., Axisa, D., Borrmann, S., Crosier, J., Fugal, J., Krämer, M., Lohmann, U., Schlenczek, O., Schnaiter, M., and Wendisch, M.: Mixed-Phase Clouds: Progress and Challenges, Meteor. Mon., 58, 5.1–5.50, https://doi.org/10.1175/AMSMONOGRAPHS-D-17-0001.1, 2017. a, b, c, d
Kuebbeler, M., Lohmann, U., Hendricks, J., and Kärcher, B.: Dust ice nuclei effects on cirrus clouds, Atmos. Chem. Phys., 14, 3027–3046, https://doi.org/10.5194/acp-14-3027-2014, 2014. a, b, c, d, e, f, g, h, i, j
Kumar, P., Sokolik, I. N., and Nenes, A.: Parameterization of cloud droplet formation for global and regional models: including adsorption activation from insoluble CCN, Atmos. Chem. Phys., 9, 2517–2532, https://doi.org/10.5194/acp-9-2517-2009, 2009. a
Kumar, P., Sokolik, I. N., and Nenes, A.: Cloud condensation nuclei activity and droplet activation kinetics of wet processed regional dust samples and minerals, Atmos. Chem. Phys., 11, 8661–8676, https://doi.org/10.5194/acp-11-8661-2011, 2011. a
Lauer, A., Eyring, V., Hendricks, J., Jöckel, P., and Lohmann, U.: Global model simulations of the impact of ocean-going ships on aerosols, clouds, and the radiation budget, Atmos. Chem. Phys., 7, 5061–5079, https://doi.org/10.5194/acp-7-5061-2007, 2007. a
Levkov, L., Rockel, B., Kapitza, H., and E., R.: 3D mesoscale numerical studies of cirrus and stratus clouds by their time and space evolution, Beitr. Phys. Atmos., 65, 35–58, 1992. a
Li, J.-L. F., Waliser, D. E., Chen, W.-T., Guan, B., Kubar, T., Stephens, G., Ma, H.-Y., Deng, M., Donner, L., Seman, C., and Horowitz, L.: An observationally based evaluation of cloud ice water in CMIP3 and CMIP5 GCMs and contemporary reanalyses using contemporary satellite data, J. Geophys. Res.-Atmos., 117, d16105, https://doi.org/10.1029/2012JD017640, 2012. a, b, c, d
Lin, H. and Leaitch, W. R.: Development of an in-cloud aerosol activation parameterization for climate modelling, in: Proceedings of the WMO Workshop on measurement of Cloud Properties for Forecasts of Weather, Air Quality and Climate, World Meteorological Organization, Geneva, 328–335, 1997. a
Liu, X. and Penner, J. E.: Ice nucleation parameterization for global models, Meteorol. Mag., 14, 499–514, https://doi.org/10.1127/0941-2948/2005/0059, 2005. a, b, c
Liu, X., Penner, J. E., Ghan, S. J., and Wang, M.: Inclusion of Ice Microphysics in the NCAR Community Atmospheric Model Version 3 (CAM3), J. Climate, 20, 4526–4547, https://doi.org/10.1175/JCLI4264.1, 2007. a
Liu, X., Shi, X., Zhang, K., Jensen, E. J., Gettelman, A., Barahona, D., Nenes, A., and Lawson, P.: Sensitivity studies of dust ice nuclei effect on cirrus clouds with the Community Atmosphere Model CAM5, Atmos. Chem. Phys., 12, 12061–12079, https://doi.org/10.5194/acp-12-12061-2012, 2012. a, b, c, d, e, f, g
Lohmann, U.: Anthropogenic Aerosol Influences on Mixed-Phase Clouds, Current Climate Change Reports, 3, 32–44, https://doi.org/10.1007/s40641-017-0059-9, 2017. a
Lohmann, U. and Diehl, K.: Sensitivity Studies of the Importance of Dust Ice Nuclei for the Indirect Aerosol Effect on Stratiform Mixed-Phase Clouds, J. Atmos. Sci., 63, 968–982, https://doi.org/10.1175/JAS3662.1, 2006. a, b, c
Lohmann, U. and Feichter, J.: Global indirect aerosol effects: a review, Atmos. Chem. Phys., 5, 715–737, https://doi.org/10.5194/acp-5-715-2005, 2005. a
Lohmann, U. and Hoose, C.: Sensitivity studies of different aerosol indirect effects in mixed-phase clouds, Atmos. Chem. Phys., 9, 8917–8934, https://doi.org/10.5194/acp-9-8917-2009, 2009. a, b, c
Lohmann, U. and Kärcher, B.: First interactive simulations of cirrus clouds formed by homogeneous freezing in the ECHAM general circulation model, J. Geophys. Res.-Atmos., 107, AAC 8–1–AAC 8–13, https://doi.org/10.1029/2001JD000767, 2002. a
Lohmann, U., Feichter, J., Chuang, C. C., and Penner, J. E.: Prediction of the number of cloud droplets in the ECHAM GCM, J. Geophys. Res.-Atmos., 104, 9169–9198, https://doi.org/10.1029/1999JD900046, 1999. a
Lohmann, U., Stier, P., Hoose, C., Ferrachat, S., Kloster, S., Roeckner, E., and Zhang, J.: Cloud microphysics and aerosol indirect effects in the global climate model ECHAM5-HAM, Atmos. Chem. Phys., 7, 3425–3446, https://doi.org/10.5194/acp-7-3425-2007, 2007. a, b, c
Lohmann, U., Spichtinger, P., Jess, S., Peter, T., and Smit, H.: Cirrus cloud formation and ice supersaturated regions in a global climate model, Environ. Res. Lett., 3, 045022, https://doi.org/10.1088/1748-9326/3/4/045022, 2008. a, b, c, d, e
Matus, A. V. and L'Ecuyer, T. S.: The role of cloud phase in Earth's radiation budget, J. Geophys. Res.-Atmos., 122, 2559–2578, https://doi.org/10.1002/2016JD025951, 2017. a, b
Mauritsen, T., Stevens, B., Roeckner, E., Crueger, T., Esch, M., Giorgetta, M., Haak, H., Jungclaus, J., Klocke, D., Matei, D., Mikolajewicz, U., Notz, D., Pincus, R., Schmidt, H., and Tomassini, L.: Tuning the climate of a global model, J. Adv. Model. Earth Sy., 4, m00A01, https://doi.org/10.1029/2012MS000154, 2012. a, b
McCoy, D. T., Tan, I., Hartmann, D. L., Zelinka, M. D., and Storelvmo, T.: On the relationships among cloud cover, mixed–phase partitioning, and planetary albedo in GCMs, J. Adv. Model. Earth Syst., 8, 650–668, https://doi.org/10.1002/2015MS000589, 2016. a
Meyers, M. P., DeMott, P. J., and Cotton, W. R.: New Primary Ice-Nucleation Parameterizations in an Explicit Cloud Model, J. Appl. Meteorol., 31, 708–721, https://doi.org/10.1175/1520-0450(1992)031<0708:NPINPI>2.0.CO;2, 1992. a
Morales, R. and Nenes, A.: Characteristic updrafts for computing distribution-averaged cloud droplet number and stratocumulus cloud properties, J. Geophys. Res.-Atmos., 115, D18220, https://doi.org/10.1029/2009JD013233, 2010. a
Nordeng, T. E.: Extended versions of the convection parametrization scheme at ECMWF and their impact upon the mean climate and transient activity of the model in the tropics, ECMWF Tech. Memo. No. 206, 1994. a
Petters, M. D. and Kreidenweis, S. M.: A single parameter representation of hygroscopic growth and cloud condensation nucleus activity, Atmos. Chem. Phys., 7, 1961–1971, https://doi.org/10.5194/acp-7-1961-2007, 2007. a
Phillips, V. T. J., Donner, L. J., and Garner, S. T.: Nucleation Processes in Deep Convection Simulated by a Cloud-System-Resolving Model with Double-Moment Bulk Microphysics, J. Atmos. Sci., 64, 738–761, https://doi.org/10.1175/JAS3869.1, 2007. a
Phillips, V. T. J., DeMott, P. J., and Andronache, C.: An Empirical Parameterization of Heterogeneous Ice Nucleation for Multiple Chemical Species of Aerosol, J. Atmos. Sci., 65, 2757–2783, https://doi.org/10.1175/2007JAS2546.1, 2008. a, b, c
Phillips, V. T. J., Demott, P. J., Andronache, C., Pratt, K. A., Prather, K. A., Subramanian, R., and Twohy, C.: Improvements to an Empirical Parameterization of Heterogeneous Ice Nucleation and Its Comparison with Observations, J. Atmos. Sci., 70, 378–409, https://doi.org/10.1175/JAS-D-12-080.1, 2013. a, b, c, d
Pozzer, A., de Meij, A., Pringle, K. J., Tost, H., Doering, U. M., van Aardenne, J., and Lelieveld, J.: Distributions and regional budgets of aerosols and their precursors simulated with the EMAC chemistry-climate model, Atmos. Chem. Phys., 12, 961–987, https://doi.org/10.5194/acp-12-961-2012, 2012. a, b
Pozzer, A., de Meij, A., Yoon, J., Tost, H., Georgoulias, A. K., and Astitha, M.: AOD trends during 2001–2010 from observations and model simulations, Atmos. Chem. Phys., 15, 5521–5535, https://doi.org/10.5194/acp-15-5521-2015, 2015. a
Pringle, K. J., Tost, H., Message, S., Steil, B., Giannadaki, D., Nenes, A., Fountoukis, C., Stier, P., Vignati, E., and Lelieveld, J.: Description and evaluation of GMXe: a new aerosol submodel for global simulations (v1), Geosci. Model Dev., 3, 391–412, https://doi.org/10.5194/gmd-3-391-2010, 2010. a
Pruppacher, H. R. and Klett, J. D.: Microphysics of Clouds and Precipitation, Springer, New York, 954 pp., 1997. a, b
Righi, M., Hendricks, J., and Sausen, R.: The global impact of the transport sectors on atmospheric aerosol: simulations for year 2000 emissions, Atmos. Chem. Phys., 13, 9939–9970, https://doi.org/10.5194/acp-13-9939-2013, 2013. a
Righi, M., Hendricks, J., and Sausen, R.: The global impact of the transport sectors on atmospheric aerosol in 2030 – Part 1: Land transport and shipping, Atmos. Chem. Phys., 15, 633–651, https://doi.org/10.5194/acp-15-633-2015, 2015. a
Righi, M., Hendricks, J., and Sausen, R.: The global impact of the transport sectors on atmospheric aerosol in 2030 – Part 2: Aviation, Atmos. Chem. Phys., 16, 4481–4495, https://doi.org/10.5194/acp-16-4481-2016, 2016. a
Roeckner, E., Brokopf, R., Esch, M., Giorgetta, M., Hagemann, S., Kornblueh, L., Manzini, E., Schlese, U., and Schulzweida, U.: Sensitivity of Simulated Climate to Horizontal and Vertical Resolution in the ECHAM5 Atmosphere Model, J. Climate, 19, 3771–3791, https://doi.org/10.1175/JCLI3824.1, 2006. a
Salzmann, M., Ming, Y., Golaz, J.-C., Ginoux, P. A., Morrison, H., Gettelman, A., Krämer, M., and Donner, L. J.: Two-moment bulk stratiform cloud microphysics in the GFDL AM3 GCM: description, evaluation, and sensitivity tests, Atmos. Chem. Phys., 10, 8037–8064, https://doi.org/10.5194/acp-10-8037-2010, 2010. a
Sander, R., Baumgaertner, A., Gromov, S., Harder, H., Jöckel, P., Kerkweg, A., Kubistin, D., Regelin, E., Riede, H., Sandu, A., Taraborrelli, D., Tost, H., and Xie, Z.-Q.: The atmospheric chemistry box model CAABA/MECCA-3.0, Geosci. Model Dev., 4, 373–380, https://doi.org/10.5194/gmd-4-373-2011, 2011. a
Seinfeld, J. H., Bretherton, C., Carslaw, K. S., Coe, H., DeMott, P. J., Dunlea, E. J., Feingold, G., Ghan, S., Guenther, A. B., Kahn, R., Kraucunas, I., Kreidenweis, S. M., Molina, M. J., Nenes, A., Penner, J. E., Prather, K. A., Ramanathan, V., Ramaswamy, V., Rasch, P. J., Ravishankara, A. R., Rosenfeld, D., Stephens, G., and Wood, R.: Improving our fundamental understanding of the role of aerosol-cloud interactions in the climate system, P. Natl. Acad. Sci. USA, 113, 5781–5790, https://doi.org/10.1073/pnas.1514043113, 2016. a
Shi, X., Liu, X., and Zhang, K.: Effects of pre-existing ice crystals on cirrus clouds and comparison between different ice nucleation parameterizations with the Community Atmosphere Model (CAM5), Atmos. Chem. Phys., 15, 1503–1520, https://doi.org/10.5194/acp-15-1503-2015, 2015. a, b, c, d, e, f, g
Sourdeval, O., Gryspeerdt, E., Krämer, M., Goren, T., Delanoë, J., Afchine, A., Hemmer, F., and Quaas, J.: Ice crystal number concentration estimates from lidar-radar satellite remote sensing. Part 1: Method and evaluation, Atmos. Chem. Phys. Discuss., https://doi.org/10.5194/acp-2018-20, in review, 2018. a, b, c
Spichtinger, P. and Cziczo, D. J.: Impact of heterogeneous ice nuclei on homogeneous freezing events in cirrus clouds, J. Geophys. Res.-Atmos., 115, d14208, https://doi.org/10.1029/2009JD012168, 2010. a
Stier, P., Feichter, J., Kinne, S., Kloster, S., Vignati, E., Wilson, J., Ganzeveld, L., Tegen, I., Werner, M., Balkanski, Y., Schulz, M., Boucher, O., Minikin, A., and Petzold, A.: The aerosol-climate model ECHAM5-HAM, Atmos. Chem. Phys., 5, 1125–1156, https://doi.org/10.5194/acp-5-1125-2005, 2005. a
Storelvmo, T. and Herger, N.: Cirrus cloud susceptibility to the injection of ice nuclei in the upper troposphere, J. Geophys. Res.-Atmos., 119, 2375–2389, https://doi.org/10.1002/2013JD020816, 2014. a
Sullivan, S. C., Morales Betancourt, R., Barahona, D., and Nenes, A.: Understanding cirrus ice crystal number variability for different heterogeneous ice nucleation spectra, Atmos. Chem. Phys., 16, 2611–2629, https://doi.org/10.5194/acp-16-2611-2016, 2016. a, b, c, d
Sundqvist, H., Berge, E., and Kristjansson, J. E.: Condensation and Cloud Parameterization Studies with a Mesoscale NUmerical Weather Prediction Model, Mon. Weather Rev., 117, 1641–1657, 1989. a
Tan, I., Storelvmo, T., and Zelinka, M. D.: Observational constraints on mixed-phase clouds imply higher climate sensitivity, Science, 352, 224–227, https://doi.org/10.1126/science.aad5300, 2016. a
Tanre, D., Geleyn, J.-F., and Slingo, J. M.: First results of the introduction of an advanced aerosol-radiation interaction in the ECMWF low resolution global model, in: Aerosols and their climatic effects, A. Deepak, 133–177, 1984. a
Tiedtke, M.: A Comprehensive Mass Flux Scheme for Cumulus Parameterization in Large-Scale Models, Mon. Weather Rev., 117, 1779–1800, 1989. a
Tost, H.: Chemistry–climate interactions of aerosol nitrate from lightning, Atmos. Chem. Phys., 17, 1125–1142, https://doi.org/10.5194/acp-17-1125-2017, 2017. a
Tost, H., Jöckel, P., Kerkweg, A., Sander, R., and Lelieveld, J.: Technical note: A new comprehensive SCAVenging submodel for global atmospheric chemistry modelling, Atmos. Chem. Phys., 6, 565–574, https://doi.org/10.5194/acp-6-565-2006, 2006a. a
Tost, H., Jöckel, P., and Lelieveld, J.: Influence of different convection parameterisations in a GCM, Atmos. Chem. Phys., 6, 5475–5493, https://doi.org/10.5194/acp-6-5475-2006, 2006b. a
Tsimpidi, A. P., Karydis, V. A., Pandis, S. N., and Lelieveld, J.: Global combustion sources of organic aerosols: model comparison with 84 AMS factor-analysis data sets, Atmos. Chem. Phys., 16, 8939–8962, https://doi.org/10.5194/acp-16-8939-2016, 2016. a
van der Werf, G. R., Randerson, J. T., Giglio, L., Collatz, G. J., Mu, M., Kasibhatla, P. S., Morton, D. C., DeFries, R. S., Jin, Y., and van Leeuwen, T. T.: Global fire emissions and the contribution of deforestation, savanna, forest, agricultural, and peat fires (1997–2009), Atmos. Chem. Phys., 10, 11707–11735, https://doi.org/10.5194/acp-10-11707-2010, 2010. a
Vergara-Temprado, J., Miltenberger, A. K., Furtado, K., Grosvenor, D. P., Shipway, B. J., Hill, A. A., Wilkinson, J. M., Field, P. R., Murray, B. J., and Carslaw, K. S.: Strong control of Southern Ocean cloud reflectivity by ice-nucleating particles, P. Natl. Acad. Sci. USA, 115, 2687–2692, https://doi.org/10.1073/pnas.1721627115, 2018. a
Waliser, D. E., Li, J.-L. F., Woods, C. P., Austin, R. T., Bacmeister, J., Chern, J., Del, G. A., Jiang, J. H., Kuang, Z., Meng, H., Minnis, P., Platnick, S., Rossow, W. B., Stephens, G. L., Sun-Mack, S., Tao, W.-K., Tompkins, A. M., Vane, D. G., Walker, C., and Wu, D.: Cloud ice: A climate model challenge with signs and expectations of progress, J. Geophys. Res.-Atmos., 114, D00A21, https://doi.org/10.1029/2008JD010015, 2009. a
Wang, M. and Penner, J. E.: Cirrus clouds in a global climate model with a statistical cirrus cloud scheme, Atmos. Chem. Phys., 10, 5449–5474, https://doi.org/10.5194/acp-10-5449-2010, 2010. a, b, c
WISP-94: Low Rate Navigation, State Parameter, and Microphysics Flight-Level Data. Version 1.0. UCAR/NCAR – Earth Observing Laboratory, available at: https://doi.org/10.5065/D6125QXM (last access: 14 December 2017), 2011. a
Zhou, C., Penner, J. E., Lin, G., Liu, X., and Wang, M.: What controls the low ice number concentration in the upper troposphere?, Atmos. Chem. Phys., 16, 12411–12424, https://doi.org/10.5194/acp-16-12411-2016, 2016. a, b