the Creative Commons Attribution 4.0 License.
the Creative Commons Attribution 4.0 License.
 | 30 Nov 2018
Modeling the effects of litter stoichiometry and soil mineral N availability on soil organic matter formation using CENTURY-CUE (v1.0)
Haicheng Zhang
Daniel S. Goll
Stefano Manzoni
Philippe Ciais
Bertrand Guenet
Yuanyuan Huang
Microbial decomposition of plant litter is a crucial process for the land carbon (C) cycle, as it directly controls the partitioning of litter C between CO2 released to the atmosphere versus the formation of new soil organic matter (SOM). Land surface models used to study the C cycle rarely considered flexibility in the decomposer C use efficiency (CUEd) defined by the fraction of decomposed litter C that is retained as SOM (as opposed to be respired). In this study, we adapted a conceptual formulation of CUEd based on assumption that litter decomposers optimally adjust their CUEd as a function of litter substrate C to nitrogen (N) stoichiometry to maximize their growth rates. This formulation was incorporated into the widely used CENTURY soil biogeochemical model and evaluated based on data from laboratory litter incubation experiments. Results indicated that the CENTURY model with new CUEd formulation was able to reproduce differences in respiration rate of litter with contrasting C : N ratios and under different levels of mineral N availability, whereas the default model with fixed CUEd could not. Using the model with flexible CUEd, we also illustrated that litter quality affected the long-term SOM formation. Litter with a small C : N ratio tended to form a larger SOM pool than litter with larger C : N ratios, as it could be more efficiently incorporated into SOM by microorganisms. This study provided a simple but effective formulation to quantify the effect of varying litter quality (N content) on SOM formation across temporal scales. Optimality theory appears to be suitable to predict complex processes of litter decomposition into soil C and to quantify how plant residues and manure can be harnessed to improve soil C sequestration for climate mitigation.


Plant litter decomposition plays a key role in the global carbon (C) cycle and thus needs to be well represented in land surface models. The decomposition and transformation processes of plant litter control the formation of soil organic matter (SOM) (Prescott, 2010; Schmidt et al., 2011; Walela et al., 2014; Cotrufo et al., 2015) and associate immobilization and mineralization of essential plant nutrients (Moorhead and Sinsabaugh, 2006; Parton et al., 2007; Manzoni et al., 2008; Manzoni and Porporato, 2009). Hence, a reliable litter decay model is necessary for estimating soil C balance and turnover of ecosystem C (Allison, 2012; Bonan et al., 2013; Wieder et al., 2013; Campbell and Paustian, 2015). In particular, a realistic representation of litter decomposition in land surface models is helpful to decrease the uncertainties in predicted effects of climate change and anthropogenic management on ecosystems (Gholz et al., 2000; Campbell and Paustian, 2015; Luo et al., 2016). As litter decomposition is a very complex process determined by climate (e.g., temperature and moisture), litter quality (e.g., nitrogen (N) concentration), soil nutrients and the physiological characteristics of microorganisms (Lekkerkerk et al., 1990; Prescott, 2010; Manzoni et al., 2012; Frey et al., 2013; Sinsabaugh et al., 2013; García-Palacios et al., 2016), there remain large uncertainties in existing litter decay models (Zhang et al., 2008; Bonan et al., 2013; Campbell and Paustian, 2015). Many litter decay models, especially those incorporated in global land surface models, have ignored stoichiometric constraints to microbial processes (Bonan et al., 2013; Cotrufo et al., 2013; Wieder et al., 2013, 2015).
Microbial carbon use efficiency (CUE), defined as the ratio of microbial biomass production to material uptake from substrates (Lekkerkerk et al., 1990; Manzoni et al., 2012), is an important parameter constraining litter decay, but it has rarely been represented as a flexible quantity in land surface models. During litter decomposition, only a part of the decomposed litter C is being transferred into SOM, while the remaining C is being released as CO2 to the atmosphere by microbial respiration (Campbell and Paustian, 2015; Cotrufo et al., 2015). While CUE is a physiological property of each decomposer community, it also determines the ecosystem-level efficiency at which litter C is transferred into SOM a step further from simple microbial incorporation. We denote this efficiency as carbon use efficiency of litter decomposition (CUEd). With higher CUEd, more plant-produced litter is transformed biologically into SOM, and soil C storage can reach higher values (Six et al., 2006; Sinsabaugh et al., 2013). In most existing soil biogeochemical models, CUEd is assumed to be the same as microbial CUE and considered as a fixed parameter. The Verberne model (Verberne et al., 1990) assumes, for instance, CUEd≈0.25. In the Yasso model (Liski et al., 2005), the CUEd is set to 0.2. The CENTURY model sets the CUEd for decomposition of surface and belowground metabolic litter to 0.55 and 0.45, respectively (Parton et al., 1988). In Daisy (Hansen et al., 1991), NCSOIL (Molina et al., 1983) and ICBM (Kätterer and Andrén, 2001), CUEd=0.6 for the labile litter pools and takes a lower value for recalcitrant substrates. Only a few models account for variable CUE, letting it vary in response to substrate stoichiometry (Schimel and Weintraub, 2003) or temperature (Allison et al., 2010).
The increasing evidence for a variable microbial CUE leads to a conceptual CUE model which can explain trends in CUE of microorganisms along stoichiometric gradients (Manzoni et al., 2017). The values of CUEd used in existing litter decay models are mostly derived from CUE obtained in laboratory studies on microbial physiology or limited observations in certain ecosystems and thus show large variations without a dynamic link to environmental conditions (Parton et al., 1988; Verberne et al., 1990; Hansen et al., 1991; Liski et al., 2005; Manzoni et al., 2012). Recent studies (Manzoni et al., 2008, 2012) suggested that the microbial CUE in terrestrial ecosystems ranges from less than 0.1 for wood decomposers to about 0.5 for decomposition of N-rich and high-quality litter. To explain those differences, Manzoni et al. (2017) proposed a conceptual model of microbial CUE based on the assumption that decomposers adapt their metabolism (and hence CUE) to maximize their growth rate. This model based on optimality theory links CUE to substrate and decomposer stoichiometry, where the optimal CUE decreases with increasing substrate C-to-nutrient ratio and increases with soil nutrient availability. The predictions of this theoretical model have been verified by empirical evidence from CUE estimates for different microorganisms in both aquatic and terrestrial ecosystems (Manzoni et al., 2017).
Besides variable CUEd, many previous studies have also indicated the necessity for litter decomposition models to consider soil mineral N availability as a driver of litter decomposition rates, in particular under low N availability (Wieder et al., 2015; Luo et al., 2016; Averill and Waring, 2018). Microbial biomass is nearly homeostatic (Cleveland and Liptzin, 2007; Franklin et al., 2011; Allison, 2012). When the supply of N from substrates is lower than the demand of microbes to fulfill their specific stoichiometric C : N ratio, microbes will utilize mineral N (immobilization) (Manzoni et al., 2012). Thus, low availability of mineral N can limit microbial activity and in turn litter decay rate (Manzoni and Porporato, 2009; Fujita et al., 2014). Although there are fertilization experiments reporting insignificant or even negative impacts of added N on litter decay rate (Fog, 1988; Hobbie and Vitousek, 2000; Finn et al., 2015), many incubation experiments showed a significant decrease of litter decomposition rate with declining mineral N availability (Recous et al., 1995; Hobbie and Vitousek, 2000; Guenet et al., 2010). Moreover, recent modeling studies have indicated that including the limiting effect of low mineral N on decomposition improved predictions of C and N fluxes (Bonan et al., 2013; Fujita et al., 2014). Therefore, soil mineral N can alter litter C flux by affecting both the litter decay rate and the partition of decayed litter C (via flexible CUEd).
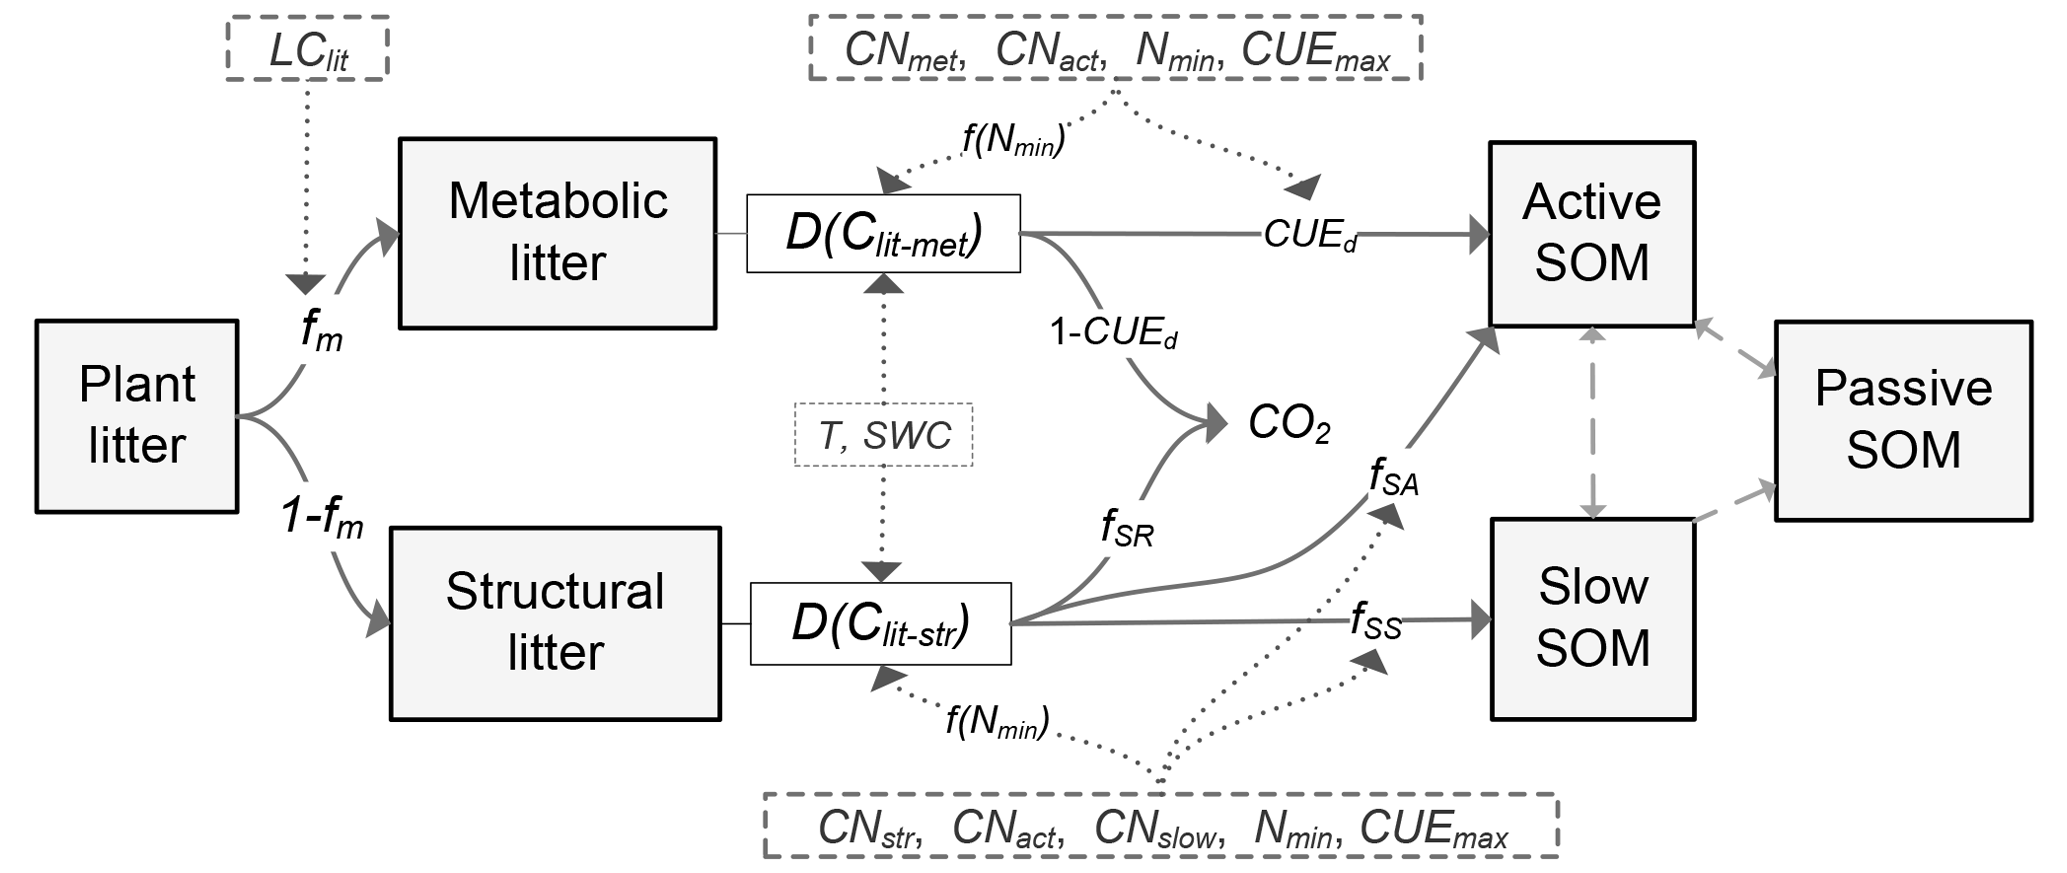
Figure 1Schematic diagram of the C flows in the litter decay model used in this study. fm is the fraction of metabolic compounds in plant litter. D(Clit-met) and D(Clit-str) are the decomposition rates (g C kg−1 day−1) of metabolic or structural litter, respectively. LClit is the lignin-to-C ratio (on a mass basis) of plant litter; CNmet, CNstr, CNact and CNslow are the C : N ratio of metabolic litter pool, structural litter pool, active SOM pool and slow SOM pool, respectively; Nmin is the concentration of mineral N in solution (g N kg−1 soil); f(Nmin) is a factor reducing litter decay rate when soil mineral N availability is limiting; T (∘C) and SWC (%) are temperature and soil water content, respectively; CUEd is C use efficiency of the transformation from litter to soil organic matter (SOM); CUE is the maximum microbial CUE (dimensionless) when growth is limited by C from the organic substrate; fSA, fSS and fSR are the fractions of decomposed structural litter C that is transferred to active SOM pool, slow SOM pool and released to atmosphere in forms of CO2, respectively. As in the algorithms in the CENTURY model (Parton et al., 1988), here , , , where flig is the lignin fraction (0–1, dimensionless) in the structural litter pool, and CUEd_SA and CUEd_SS are the CUE of C transformation from structural litter pool to active and slow SOM pools, respectively.
Some detailed microbial decomposition models actually have included variable microbial CUE and the limitation of low mineral N availability on litter decay rate (Ingwersen et al., 2008; Pagel et al., 2013; Campbell et al., 2016; Huang et al., 2018); however, the parameterization and evaluation of these models pose significant challenges due to their complexity and limited verification data (Wieder et al., 2013; Campbell and Paustian, 2015). There is still scope for implementing the effects of litter stoichiometry and soil mineral N availability on litter decomposition in litter decay models with more generalizable structure. In particular, it is important to test the role of these effects in models that have already been incorporated into land surface models for long-term and large-scale applications (e.g., CENTURY; Parton et al., 1988). In this study, we incorporated flexible CUEd based on substrate C : N ratios and mineral N limitations into a soil biogeochemical model based on the CENTURY equations to simulate the decomposition and transfer processes of litter C. The study was organized as follows. First, the new model was calibrated and tested against data from laboratory litter incubation experiments for its ability to capture the effect of variable litter quality and soil mineral N on litter respiration rates (short-term simulations). Second, the model parameterized assuming flexible CUEd and mineral N limitations was used to explore the consequences of such stoichiometric constraints on the production of soil organic carbon (SOC) (long-term simulations). With these two modeling analyses, we aimed at linking stoichiometric constraints acting on short-term (months to years) decomposition dynamics to their consequences on SOC accumulation occurring at decadal to centennial timescales.
2.1 The CENTURY decomposition model
The basis of the litter decay model used in this study is the CENTURY model (Fig. 1), a first-order decay model that describes decomposition as a function of substrate availability and quality, clay content, soil moisture and soil temperature (Parton et al., 1988). Most land surface models (e.g., Kucharik et al., 2000; Sitch et al., 2003; Krinner et al., 2005) adopted a similar structure to simulate the litter and soil biogeochemical processes. Dead organic matter in CENTURY is separated into structural and metabolic litter and three SOM pools (active, slow, passive) with different turnover times. There is no explicit representation of microbial biomass in CENTURY; instead, the biomass of microbes is assumed to be in equilibrium with labile SOM and thus implicitly included in the active SOM pool. When litter is being decomposed, a fraction of the decomposed C is respired to the atmosphere and the remaining fraction (CUEd conceptually equal to microbial CUE) enters the acceptor SOM pool. Three of such fractions are defined to characterize the transfer of C from litter to SOM: CUEma for transfer of the metabolic litter to the active SOM pool, and CUEsa and CUEss for transfer of structural litter to active and slow SOM pools, respectively (Fig. 1). These fractions are set to be time invariant in the original version of CENTURY, so that a fixed fraction of decomposed C is retained in the acceptor pool regardless of environmental conditions and changes in the quality of the donor pool. The N flows in CENTURY follow the C flows and are equal to the product of C flow by the N : C ratio of the acceptor SOM pool. N mineralization is defined as the difference between N obtained from the donor pools and N stoichiometric demand of the acceptor pool (Parton et al., 1988; Metherell et al., 1993). In this way, net N mineralization occurs when the donor pool has a low C : N ratio, but N is immobilized (taken up by microbes) when the donor pool has a high C : N ratio.
2.2 Optimal CUE
To quantify how microbial CUE varies along gradients of nutrient availability, it can be hypothesized that microorganisms maximize their growth rate, and hence their ecological competitiveness, by adapting resource (C and nutrients) use efficiencies. This follows the growth maximization hypothesis (Mooshammer et al., 2014; Manzoni et al., 2017). Based on this hypothesis, Manzoni et al. (2017) formulated a theoretical model expressing microbial CUE as a function of the stoichiometric difference between decomposers and their substrate. The CUE for which growth rate is maximized is the optimal CUE (CUEopt) given by
where CUEmax is the maximum microbial CUE (dimensionless) when growth is limited by C from the organic substrate. CND and CNS are the C : N ratio (in mass, dimensionless) of decomposer and their substrate, respectively. Although Manzoni et al. (2017) indicated that mineral phosphorus (P) could also affect optimal CUE, we only considered N as a limiting nutrient. IN (g N kg−1 soil) is the maximum rate at which mineral N can be taken up by microbes, and U0 (g C kg−1 soil) is the C-limited uptake rate (corresponding to the decomposition rate at optimal mineral N concentration). When litter C : N is low or soil mineral N is in excess, the second term in the minimum function (Eq. 1) is higher than 1, and CUE (C-limited conditions, as in nutrient-rich litter). In contrast, when mineral N is scarce, CUEopt decreases with increasing substrate C : N ratio (N-limited conditions, N-poor litter). Lack of N in the organic substrates can be compensated by mineral N being immobilized by microorganisms from the soil solution. Immobilization meets the nutrient demands as long as it is lower than the maximum supply rate IN, at which point microbial CUE starts being downregulated. Thus, for any given C : N ratio in the substrate, CUEopt increases with inorganic N concentration in the soil solution until CUEmax is reached. It should also be noted that Eq. (1) is interpreted at the microbial community scale, not for individual organisms.
2.3 Adaption of the optimal CUE model in the CENTURY model
CUE of decomposition (CUEd) is also assumed to be equivalent to microbial CUE in this study. Then we followed the theory from Manzoni et al. (2017) (Eq. 1) to parameterize CUEd during litter decomposition into CENTURY (Fig. 1). Due to the implicit representation of microbial growth in CENTURY, we replaced the original optimality CUE model (Eq. 1) by a simpler equation that involves the C : N ratios of the donor and acceptor pools, rather than microbial C : N ratios:
where CNlit and CNSOM are the C : N ratio (dimensionless) of litter (metabolic or structural) and SOM pools (active, slow or passive), respectively. The C : N ratio of SOM (around 9 : 1 on a mass basis in CENTURY) is representative of the decomposer biomass, its value being between the average C : N ratio of soil microbial communities including fungi and bacteria (7.4 : 1 in Cleveland and Liptzin, 2007) and the C : N ratio of soil fungi (13.4 : 1 in Zhang and Elser, 2017), which are probably largely responsible for fresh litter decomposition. CUEmax (dimensionless) is the maximum CUEd achieved when nutrients are not limiting, and it is set to 0.8 based on a synthesis of observed CUE of soil microbes (Manzoni et al., 2012). The exponent a (g N kg−1 soil) captures the effect of mineral N uptake by microbes on CUEd. Because CUEd is expected to increase with mineral N availability (Eq. 1), a is assumed to be a linear function of the mineral N concentration (Nmin, g N kg−1 soil):
where m1 (kg g−1 N) and n1 (g N kg−1 soil) are two coefficients that need to be calibrated. Equations (2) and (3) modulate the decrease in CUEd with decreasing litter quality when mineral N availability changes: the exponent a increases with increasing mineral N availability, causing an increase in CUEd at any given litter C : N ratio. Hence, increasing a mimics an increase in IN in Eq. (1). Figure 2a illustrates how CUEd from Eq. (2) varies as a function of mineral N concentration for different values of litter C : N.
Equations (2) and (3) were implemented in CENTURY to modify the originally fixed CUEd (Fig. 1). With this change, the fractions of C from litter that remain in SOM are mediated by stoichiometric constraints and mineral N availability, at the expense of additional parameters to fit. The CUEd values for C transfers between SOC pools (active, slow and passive) are not modified.
2.4 Constraint of soil nutrient availability on litter decomposition rate
CENTURY is a first-order decay model in which decomposition rates of metabolic and structural litter are modulated by scaling factors of soil temperature (f(tem)) and moisture (f(water)) (Parton et al., 1988). Here, we introduced an additional mineral N scaling factor (f(Nmin), 0–1, dimensionless) to account for the limitation imposed by low mineral N availability on litter decay rate (D(Clit)):
where Clit is the C (g C kg−1 soil) in the litter pool (metabolic or structural) and k is the potential maximum turnover rate (day−1) at optimal soil temperature, moisture and nutrient conditions.
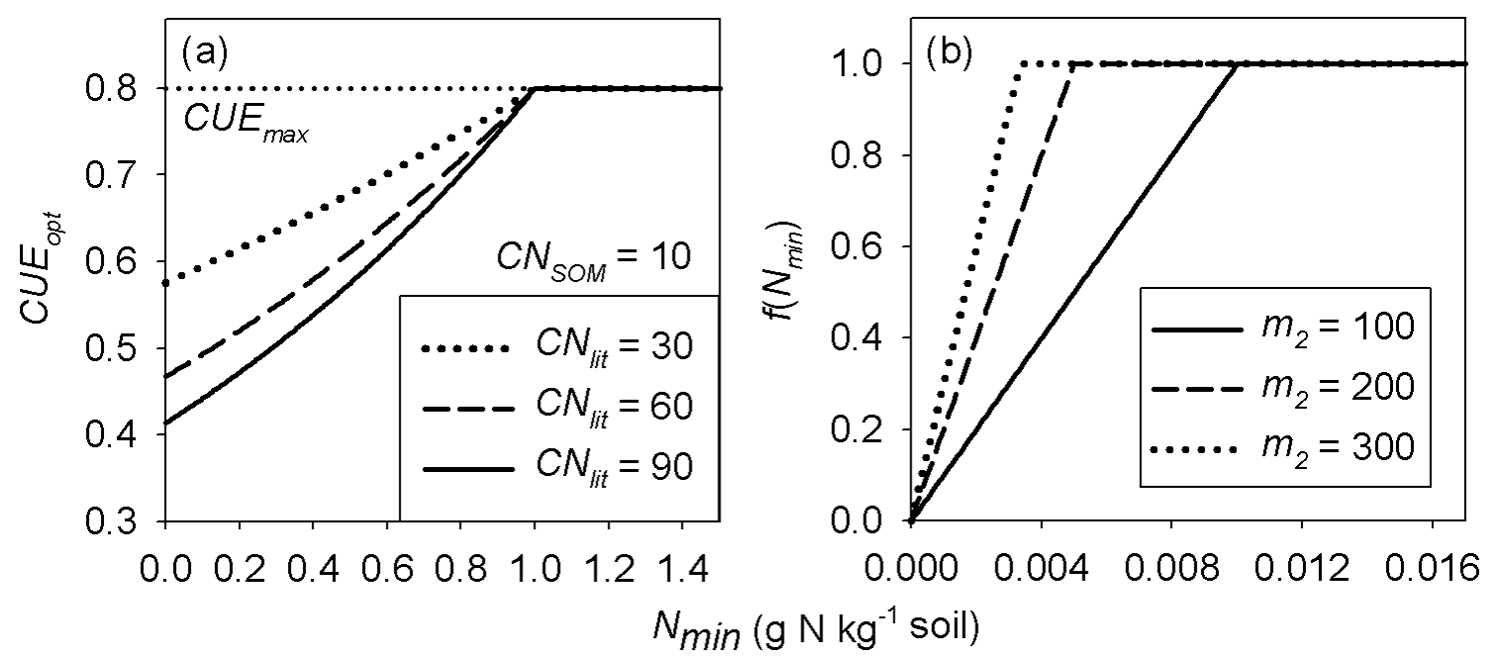
Figure 2Schematic plot of (a) the optimal carbon use efficiency (CUEopt) as a function of soil mineral nitrogen for different litter C : N ratios (from Eq. 2) in the main text (with m1=0.3, n1=1.0) and (b) the N limitation function f(Nmin) applied to litter decomposition rates (from Eq. 5) in the main text. CNlit and CNSOM are the C : N ratios of the litter and SOM pools, respectively. CUE is the maximum CUE under optimal nutrient condition (C limitation only). m1 and n1 are the parameters of Eq. (3) and m2 is the parameter of Eq. (5).
In this study, we assumed that the scaling factor of mineral N increases linearly with increasing soil mineral N concentration (Nmin; Eq. 5) below a threshold value of 1∕m2 g N kg−1 soil, where m2 is a positive coefficient which needs to be calibrated (Fig. 2b). The inhibition effect of mineral N only occurs in the case of immobilization (). The specific function f(Nmin) can be expressed as
Existing studies have adopted approaches that differ from our definition to explicitly represent the N inhibition effects on microbial processes (Manzoni and Porporato, 2009; Bonan et al., 2013; Fujita et al., 2014; Averill and Waring, 2018). In these previous studies, f(Nmin) was assumed equal to the ratio between immobilized mineral N and the N deficit for maintaining a stable C : N of decomposer biomass or other receiver pools. Using the notation of Sect. 2, this definition of f(Nmin) can be expressed as
where m3 is a coefficient that needs to be optimized. U0 (g C kg−1 soil day−1) is the C uptake rate (equivalent to the litter decomposition rate in absence of leaching) when soil mineral N is fully adequate for litter decay (i.e., ) and can be calculated from Eq. (7) as
In this study, we also tested this formulation in the CENTURY-based model, in addition to Eq. (5) (see model M4 in Table A3).
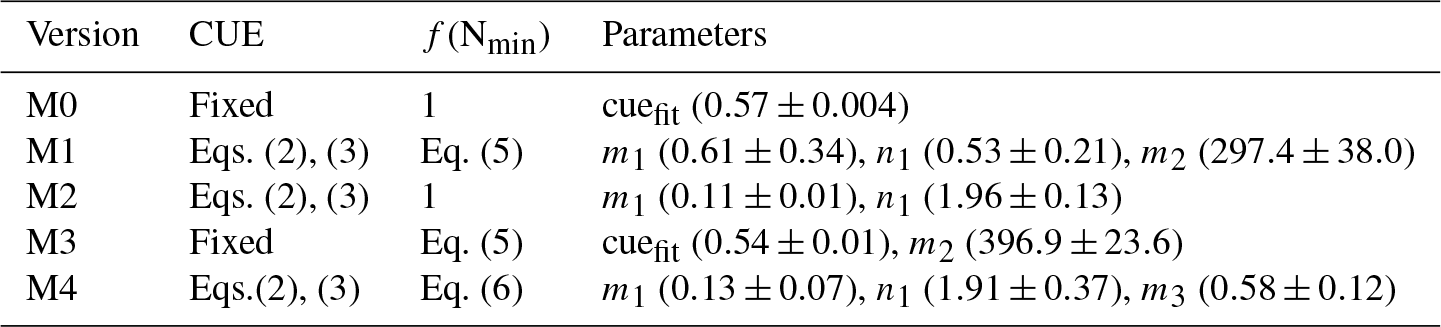
Table 1Optimized parameter values for the five versions of the litter decomposition model used in this study. cuefit is the optimized value of CUE, m1 and n1 are the coefficients in Eq. (3), m2 is the coefficient in Eq. (5), and m3 is the coefficient in Eq. (6). Values in brackets following each parameter are the means (± standard deviations) of the fitted parameter values based on “leave-one-out” cross-validation (see Sect. 2.5 for more details).
2.5 Model parameterization and validation
To determine the respective impacts of including flexible CUEd and N availability constraining decay rates, we built four conceptual litter decay models (Table 1). Model M0 corresponds to the default CENTURY parameterization of a fixed CUEd and no constraints of N availability on litter decay rates (). Model M1 accounts for flexibility in CUE from Eq. (2) and N constraints on decay rates by Eq. (5). Model M2 has flexible CUEd but no N constraints on decay rates (). Model M3 has N constraints on decay rates but a fixed CUEd (Table 1). All of these four models are run at a daily time step. Finally, model M4 also accounts for flexibility in CUE and N constraints on decays (Table A3), but it uses Eq. (6) to represent the N constraints on decays rate rather than Eq. (2). Results from model M4 are presented in the main text, but only shown in the Appendix. This range of models allows identifying which mechanisms are at play during decomposition: flexible CUEd only (M3), mineral N limitation only (M2), both mechanisms (M1, M4), or none (M0).
For calibrating model parameters and evaluation of their results, we collected data of laboratory litter incubation experiments from Recous et al. (1995) (five experiments) and Guenet et al. (2010) (nine experiments; Table A2). The incubation experiments of Recous et al. (1995) and Guenet et al. (2010) continued 80 and 124 days, respectively. Recous et al. (1995) used corn residues (C : N ratio of 130) and Guenet et al. (2010) used wheat straw (C : N ration of 44) in their incubation experiments. The C : N ratios of the corn residue and wheat straw span the range of litter C : N ratios among different ecosystems (Harmon et al., 2009; Brovkin et al., 2012; Manzoni et al., 2010). In the incubation experiments, plant litter was firstly cut into fine fragments before it was mixed with mineral soil. Soil temperature and moisture condition were kept constant during the experiment. Respired C from the incubated litter and SOC as well as the soil mineral N concentrations were measured continuously across the incubation period. To distinguish the litter- and SOC-derived CO2 flux, Guenet et al. (2010) used straw from wheat grown under 13C labeled CO2, and they were therefore able to track the CO2 coming from litter and the CO2 coming from soil. In the experiments by Recous et al. (1995), litter-derived CO2 flux is calculated as the difference in CO2 flux between the incubation samples with both soil and litter, and the control samples without added litter. More detailed information about the incubation experiments of Recous et al. (1995) and Guenet et al. (2010) can be found in Table A2.
The initial C storage and C : N ratios of litter and SOM pool, as well as soil temperature and moisture conditions for decomposition in all of the five versions of the model (M0–M4), were set based on observations (Table A2). Plant litter was firstly separated into metabolic and structural litter pools based on its lignin-to-C ratio (LClit, dimensionless). The fraction of metabolic litter C (fm, 0–1, dimensionless) is calculated by
where m4 is a coefficient to be calibrated; is the maximum fraction of metabolic litter (i.e., the default value in CENTURY; Parton et al., 1988). The fraction of structural litter C is thus 1−fm. The C : N ratios of both metabolic and structural pools are assumed to be equal to the C : N ratio of litter input.
In the M1 and M3 models, the observed mineral N concentrations across the incubation period were used to calculate the daily N inhibition effect (Eq. 5). The observed cumulative respired litter C (g C kg−1 soil) measured in the incubation experiments was used to calibrate the model parameter values. Moreover, to quantify the simulated CO2 flux derived from the litter, we also performed a set of control simulations with only SOM (initial litter pools were set to 0 g kg−1 soil) using the four model versions. The simulated litter-derived CO2 flux is calculated as the difference in CO2 flux between the simulation with both litter and SOM inputs and the simulation with only SOM input.
Parameter calibration was performed for each model with the shuffled complex evolution (SCE) algorithm developed by Duan et al. (1993). The SCE algorithm relies on a synthesis of four concepts that have proved successful for global optimization: combination of probabilistic and deterministic approaches; clustering; systematic evolution of a complex of points spanning the space in the direction of global improvement and competitive evolution (Duan et al., 1993). A more detailed description of this SCE optimization method can be found in Duan et al. (1993, 1994). In this study, the RMSE (root mean square error; Eq. 9) between simulated and measured cumulative respired litter C (%) on all observation days (Table A2) of each incubation experiment was used as the objective function, and the parameters minimizing RMSE between simulated and observed cumulative respired litter C were regarded as optimal parameter values.
where n is the number of observation days, and Simi and Obsi (%) are the simulated and observed percent of cumulative litter-C flux on day i, respectively.
We used leave-one-out cross-validation (Kearns and Ron, 1997; Tramontana et al., 2016) to evaluate each of the four models (i.e., M0–M3), a cross-validation method used when data are scarce. The number of cross-validations corresponds to the number of incubation experiments (14). Each time, one of the 14 incubation experiments was left out as the validation sample, and the remaining 13 experiments were used to train model parameters. In addition to RMSE, we also adopted the Akaike information criterion (AIC; Bozdogan, 1987; Eq. 10) to determine the relative quality of the four version models on estimating cumulative respired litter C.
where np is the number of model parameters. The evaluation of AIC is important here because depending on the model version, different numbers of parameters have to be determined (Table 1), requiring us to weigh both model accuracy and robustness.
Note that the turnover times of SOM pools (active, slow and passive) used in this study are obtained from Organising Carbon and Hydrology In Dynamic Ecosystems – aMeliorated Interactions between Carbon and Temperature (ORCHIDEE-MICT v8.4.1; Guimberteau et al., 2018). The turnover times of litter pools (metabolic and structural), as well as the coefficient m4 in Eq. (8), were optimized against the observed cumulative respired litter C from all of the 14 incubation experiments using the M0 and M1 models (Table A3). A previous study has shown that litter decomposability is negatively correlated to its physical size (for example, Tuomi et al., 2011). Therefore, the turnover times of the fine litter fragments used in the incubation experiments of Recous et al. (1995) and Guenet et al. (2010) are expected to be shorter than the values set in ORCHIDEE-MICT, which are representative of the turnover times of natural plant residues. In addition, the mixing of soil and litter particles in the incubation experiment likely enhances decomposition as spatial disconnection of decomposer and substrate, which can occur under natural soil conditions (Barnes et al., 2012; Hewins et al., 2013), is prevented. The calibrated turnover times of the metabolic and structural pools and the value of m4 in Eq. (8) are 3.5 and 30 days and 0.5, respectively.
2.6 Impacts of litter stoichiometry and mineral N availability on SOM accumulation
We used model M1, with flexible CUEd and decomposition rate function of available N to study the impacts of litter stoichiometry (C : N ratio) and soil mineral N availability on the formation and accumulation of SOM. In total, 24 idealized simulation experiments with different values of litter C : N ratios and soil mineral N availabilities were conducted (Table A4). The assumed litter C : N ratios (CNlit) of 10, 15, 30, 60, 120 and 200 span the variation among most natural substrates and soil amendments from organic matter input in agriculture (Harmon et al., 2009; Brovkin et al., 2012; Manzoni et al., 2010). The assumed range of mineral N availability (Nmin) of 0.001, 0.005, 0.01 and 0.05 g N kg−1 soil spans the observed concentrations of soil mineral N in major terrestrial ecosystems (Metherall et al., 1993).
In each simulation experiment, model M1 was run for 5000 years to bring the litter and SOM pools in equilibrium with the prescribed litter input flux. The daily input rate of plant litter was set to 0.006 g C kg−1 soil day−1, and the initial C stock of litter and SOM pools was all set to be 0 g C kg−1 soil. During the simulation, soil temperature and soil water content were assumed to be 25 ∘C and 60 % of water holding capacity, respectively. We emphasized that our goal with this simplified scenario was to single out the effects of stoichiometric constraints, not to simulate the effects of a realistic climatic regime. Parameter values for M1 (with m1=0.54, n1=0.50 and m2=296.8) used here were optimized based on all of the 14 incubation experiments from Recous et al. (1995) and Guenet et al. (2010) (see above). More detailed information about the specific settings of our simulation experiments can be found in Table A4.
3.1 Evaluation of different models
Results of leave-one-out cross-validation suggest that model M1 provides more accurate prediction of cumulative respired litter C than other models (Fig. 3). The differences between simulated and observed cumulative respired litter C from M1 are mostly less than 6 % for over 93 % of the data (Fig. A1b). The average RMSE of predicted cumulative respired litter C from M1 (3.0 %) is lower than that of model M0 (4.1 %). Models M2 and M3 have slightly lower RMSE values than M0 (3.7 % and 3.8 %, respectively) but perform worse than M1 (Fig. 4). However, the average AIC values of all the models are comparable, suggesting that models with more fitted parameters do not overfit the observations (Fig. 4).
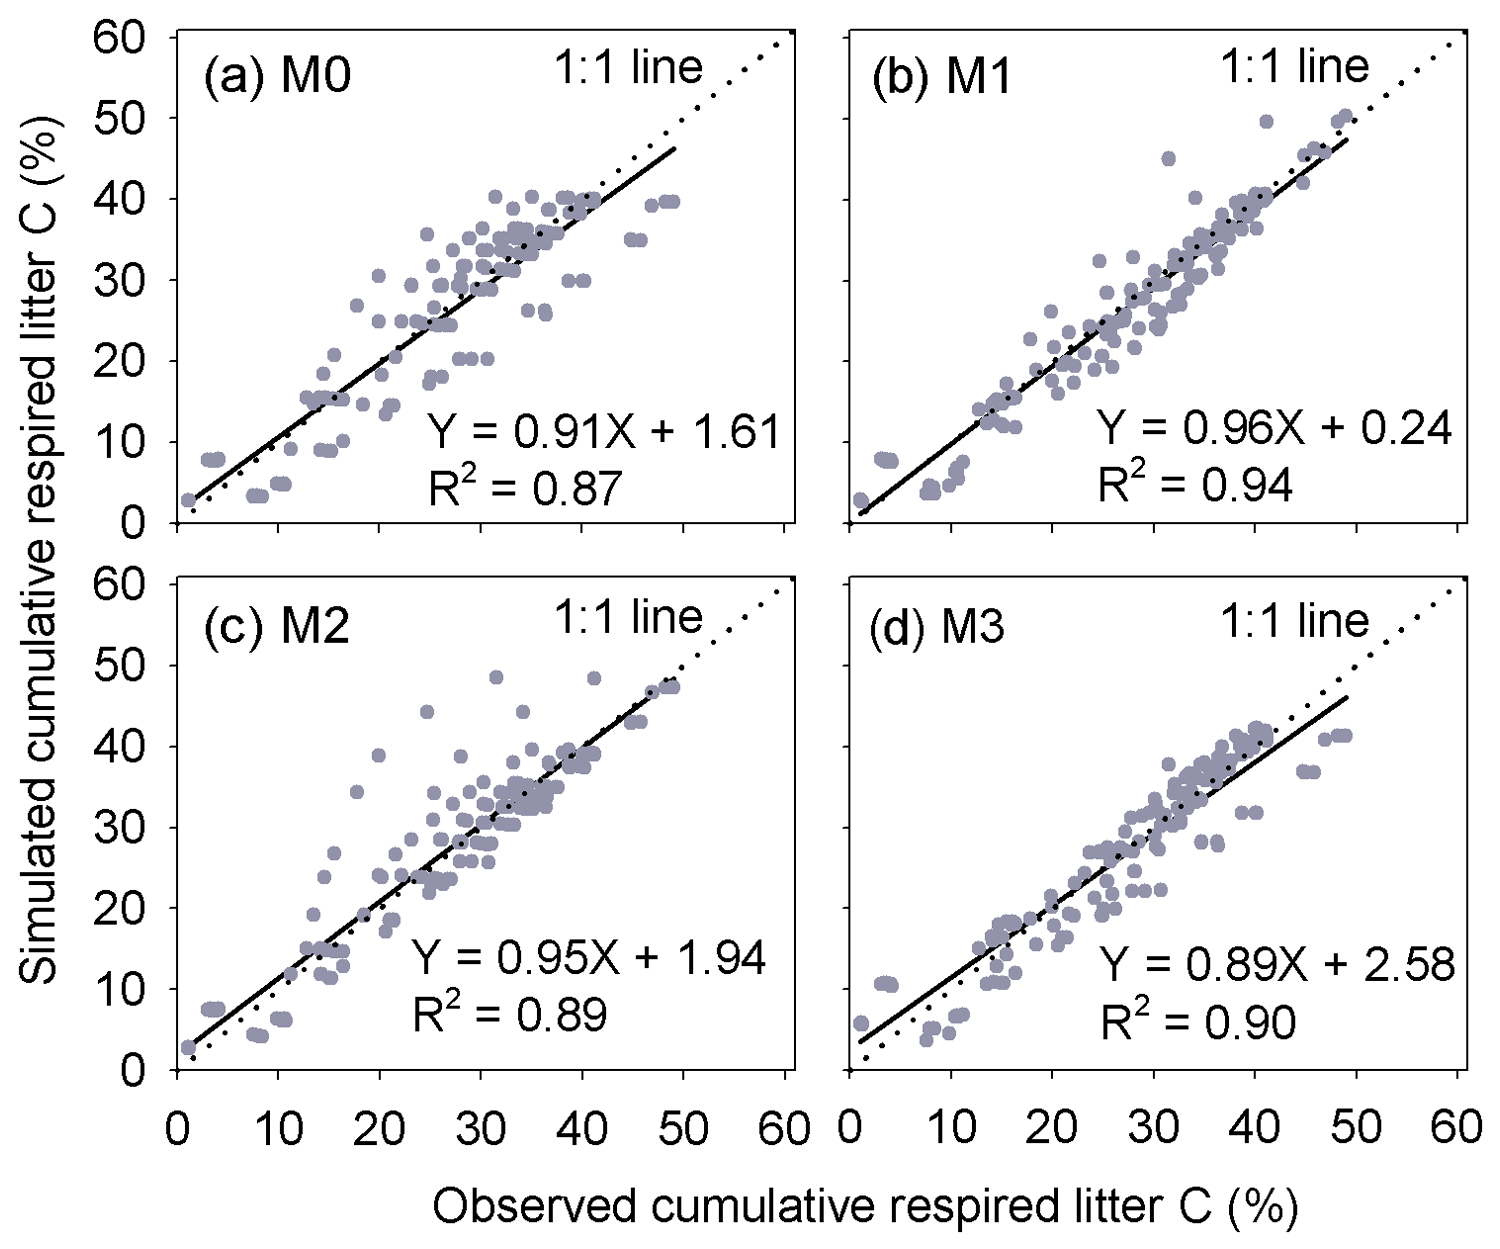
Figure 3Comparison of the predicted cumulative respired litter C to observed values at different times during the litter decomposition process. Each dot denotes an observation of cumulative respired litter C on a certain day. In total, there are 149 points. M0–M3 are the four versions of litter decay models tested in this study (Table 1).
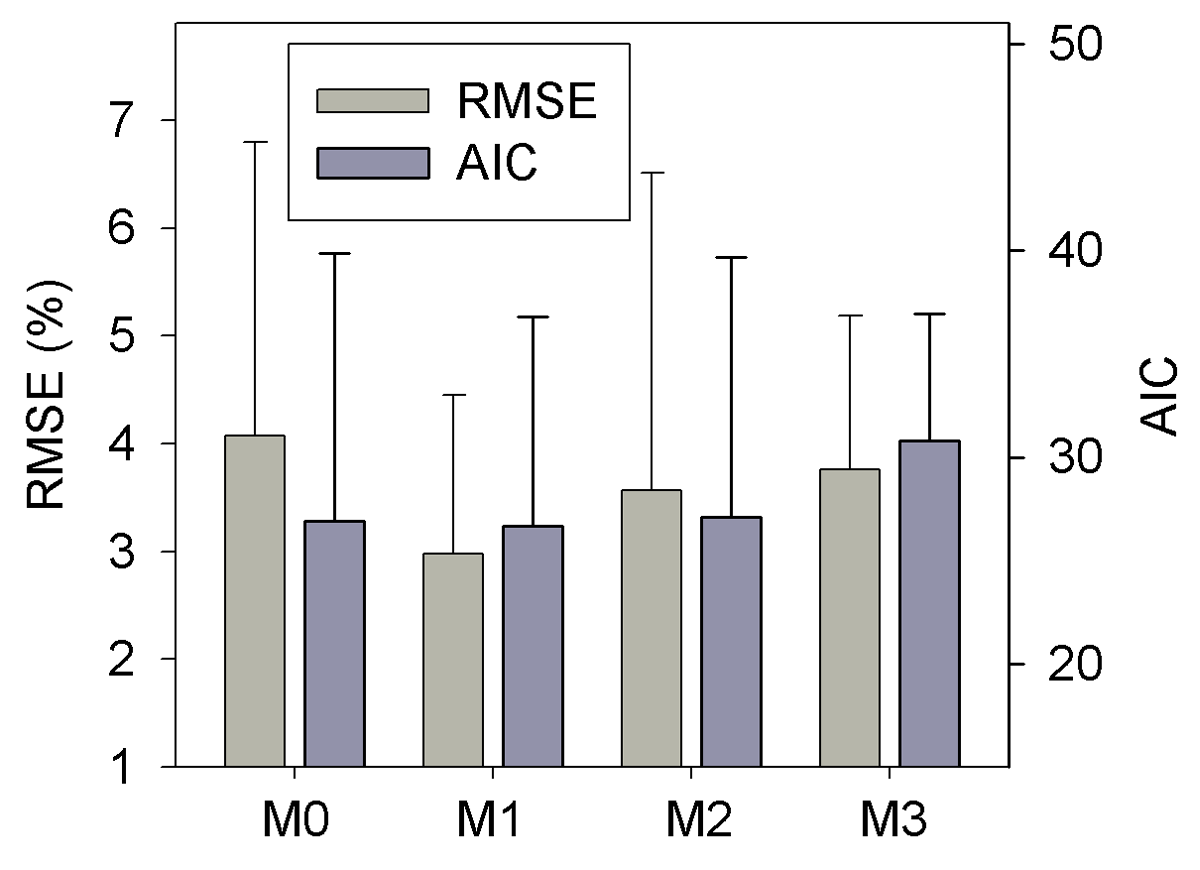
Figure 4The RMSE and AIC of the simulated cumulative respired litter C from the four versions of litter decay model used in this study. Error bars denote the standard deviation of RMSE or AIC for different incubation experiments. M0–M3 denote the four models tested in this study (Table 1).
Model M1 captures the differences in respiration rates due to different C : N ratios of substrate and varying levels of mineral N availability across the 14 incubation experiments (Fig. 5). While model M3 can reproduce the observed effect of soil mineral N availability on litter respirations rates (Fig. 5d), it underestimates the cumulative respired CO2 from low quality litter (CNlit=130) at high mineral N concentrations (>0.04 g N kg−1 soil). Models M0 and M2 cannot represent the effects of soil mineral N on litter respiration rate (Fig. 5a, c), and their predictions are more biased from the observed values compared to M1. Model M4, which uses the alternative formulation for N constraints on litter decay (Eq. 6), reproduces the different respiration rates of substrates with contrasting C : N ratios and at different levels of mineral N availability (Fig. A2) but with a slightly higher average RMSE of cumulative respired litter C than model M1.
The predicted CUEd and the limitation effects of soil mineral N availability on litter decay rate (f(Nmin) function; Eq. 5) are different among the four tested models (Fig. A3). In models M0 and M3, which used a fixed CUEd, the fitted values of CUEd calculated with optimized parameters during the incubation period are about 0.57 and 0.54, respectively (Fig. A3a, d). In models M1 and M2, the CUEd varies with the C : N ratios of plant litter and is only slightly affected by soil mineral N concentrations (Fig. A3b, c). For very low quality litter with a C : N ratio of 130, the CUEd values in models M1 and M2 are 0.40 and 0.44, respectively, which are lower than for better-quality litter with a C : N ratio of 44 (approximately 0.55 and 0.56 in M1 and M2, respectively). Models M0 and M2 do not include the N inhibition effects on litter decay rate; thus, the f(Nmin) in these two models is always 1 (Fig. A3e, g). In M1 and M3, the N inhibition effect changes with both the litter C : N ratio and the mineral N availability (Fig. A3f, h).
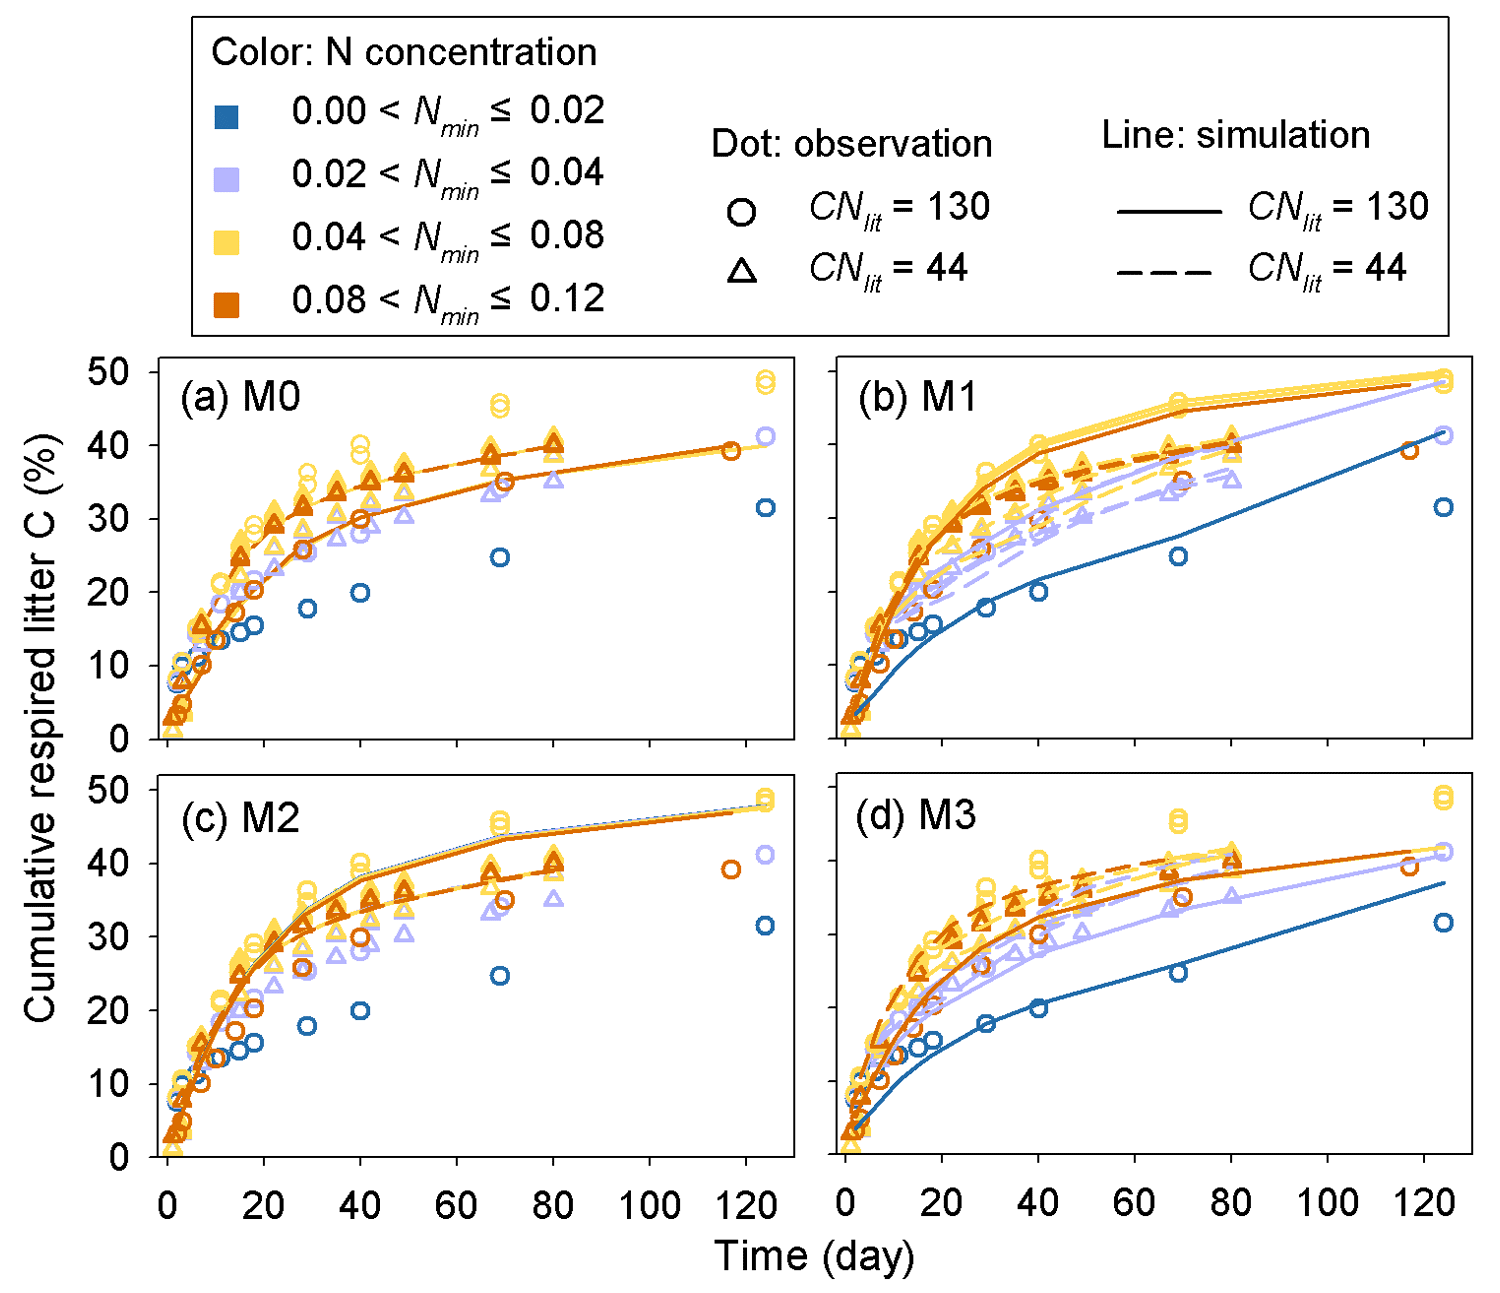
Figure 5Time series of the simulated (lines) and observed (dots) cumulative respired litter C (% of initial litter C) at four different levels of soil mineral N availability (Nmin, g N kg−1 soil). CNlit is the C : N ratio of plant litter. M0–M3 denote the four models tested in this study (Table 1). Here, the simulation results of each model were calculated with parameters optimized based on all of the 14 samples of incubation experiments (Table A2).
CUEd from Eq. (2), calibrated with the data of the two incubation experiments, decreases with increasing CNlit∕CNSOM (Fig. 6). The average CUEd value is larger than the average of data compiled for microbial CUE of litter decomposition in terrestrial ecosystems by Manzoni et al. (2017). This is shown by the gray circles in Fig. 6. Our optimized values of CUEd for a given C : N ratio are more comparable with microbial CUE observed in incubations of soil mixed with litter (Gilmour and Gilmour, 1985; Devêvre and Horwáth, 2000; Thiet et al.,2006), shown as black squares in Fig. 6.
3.2 The effect of litter quality vs. quantity on equilibrium SOM stocks
Model M1 predicts that the size of the SOM pool at equilibrium is mainly determined by litter stoichiometry, with a minor effect of soil mineral N (Fig. 7). The lower the C : N ratio of litter is, the higher the equilibrium SOC stock. For litter with a specific C : N ratio, high soil mineral N concentration (e.g., above 0.05 g N kg−1 soil) generally produces a slightly larger equilibrium SOC stock than a low mineral N concentration (Fig. 7). Further analysis suggests that the SOC at equilibrium increases with decreasing litter C : N because the SOC pool is positively related to the CUEd; however, the limitation of soil mineral N on litter decomposition rate almost shows no impact on SOC (Fig. A4).

Figure 6Comparison of CUEd (lines) predicted by Eq. (2) with parameter values (m2=0.54, n1=0.50) calibrated based on the incubation experiments (Table A2) of Recous et al. (1995) and Guenet et al. (2010) to observed CUE of terrestrial microorganisms along a gradient of CNS∕CND. For observed CUE (dots), CND and CNS are the C : N ratio of decomposers and their substrates, respectively. For simulated CUE (lines), CNS and CND correspond to the C : N ratio of donor (litter pool) and acceptor (the active SOM pool of the CENTURY), respectively. Gray dots are the estimated microbial CUE of litter decomposition in natural terrestrial ecosystems from Manzoni et al. (2017). Black squares are the microbial CUE measured via laboratory incubation experiments of Gilmour and Gilmour (1985), Devêvre and Horwáth (2000) and Thiet et al. (2006). Error bars represent the standard deviations. Nmin (g N kg−1 soil) is the concentration of soil mineral N.
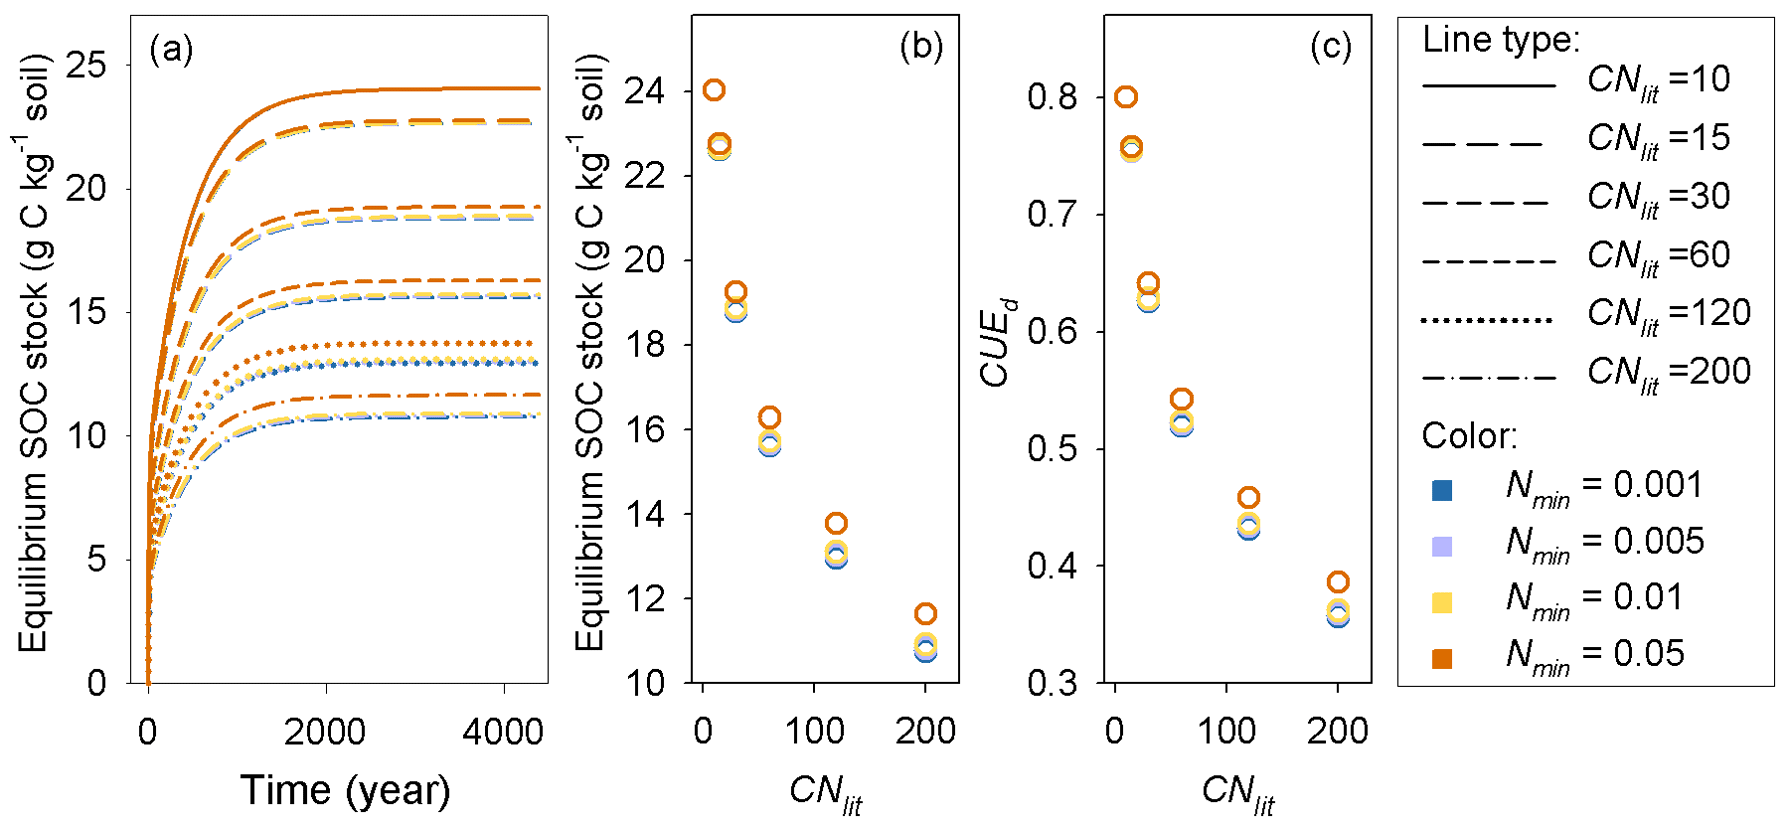
Figure 7(a) Accumulation of soil organic carbon (SOC) for constant substrates input (plant litter) with different C : N ratios (CNlit) at different levels of soil mineral N concentrations (Nmin, g N kg−1 soil), (b) change trends of equilibrium SOC stock and (c) carbon use efficiency of decomposed litter (CUEd) with increasing litter C : N ratio.
We hypothesized that stoichiometric constraints (flexible CUEd or inhibition of decomposition under N-limited conditions) played a role in shaping the trajectory of litter decomposition, with potential consequences on predicted SOC stocks. Our results suggest that flexible CUEd and inhibition effects of soil mineral N on litter decay rate improve prediction of litter decomposition when using a modified version of the CENTURY model (denoted as M1). Evaluation of model M1 using data from incubation experiments indicates that this modified model captures the effects of both variable litter quality (stoichiometry) and mineral N availability on respiration rates (Fig. 5), without strongly inflating the complexity of CENTURY (Table 1). As the stoichiometric constraints are implemented in the generalizable and widely used structure of CENTURY and require only three parameters to be calibrated, they can also be easily implemented into land surface models for large-spatial-scale applications.
Accurately representing N control of microbial processes during litter decomposition has been suggested to be important for modeling the connection between the litter inputs, CUEd and soil C dynamics (Gerber et al., 2010; Manzoni et al., 2012; Cotrufo et al., 2013; Sinsabaugh et al., 2013). In model M1, soil mineral N affects the litter-C flux via two mutually different pathways: (1) mineral N availability affects the litter decay rate and (2) flexible CUEd determining the partition of decomposed C into SOC products and respired CO2 (Fig. 1). Therefore, an increase in soil mineral N concentration enhances litter decay rates, which alone will increase the flux of litter-derived CO2 (Eq. 5 and Fig. A5). However, as higher N concentration also results in a higher CUEd (Eq. 2), more C is transferred to SOC and less C is respired. In this way, SOC is predicted to accumulate with increasing mineral N availability when using model M1 (Fig. 7). In addition, model M4, which is comparable to model M1 but uses an alternative formulation for N effects on the decomposition rate (Eq. 6), performed slightly worse than model M1 (Fig. A2). Arguably, Eq. (6) represents the underlying mechanisms of N inhibition effects (Manzoni and Porporato, 2009, Bonan et al., 2013; Fujita et al., 2014; Averill and Waring, 2018) better than Eq. (5) and due to the minor differences in RMSE and AIC (Fig. A2b) between these formulations it can serve as an alternative to M1.
Our results indicate that the observed diversity of responses of litter respiration rate to mineral N additions (Hobbie and Vitousek, 2000; Guenet et al., 2010; Janssens et al., 2010) is likely due to the combined effects of changes in litter decay rate and CUEd (Fig. A5). Thus, N addition effects can differ among fertilization experiments if litter quality and background N availability vary. In addition to altering litter decay rate and CUEd, mineral N addition can induce abiotic formation of compounds that resist microbial attack, inhibit oxidative enzymes involved in lignin degradation, stimulate microbial biomass production early in decomposition or lead to the accumulation of microbial residues that are resistant to decay (Fog, 1988; Hobbie, 2015). All these effects might decrease litter respiration rate by inhibiting the decomposition process but have not been considered in our current model.
This study provides insights on processes leading to increased SOM sequestration. Enhancing the efficiency at which plant residuals are transformed into stable SOM has been suggested as an effective strategy to sequester C in soil (Prescott, 2010; Cotrufo et al., 2013). Simulation results from our model suggest a positive linear relationship between equilibrium SOC stock and CUE of decomposed litter (Fig. A4), in line with the earlier findings with a similar model (for example, Frey et al., 2013). In fact, with linear models such as CENTURY it can be shown that the steady-state SOC scales linearly with CUE, different from nonlinear models predicting that higher CUE can trigger SOC loss (Allison et al., 2010). Our model goes beyond earlier attempts (Bonan et al., 2013; Fujita et al., 2014; Averill and Waring, 2018) by adapting the optimal metabolic regulation hypothesis of Manzoni et al. (2017) to link CUE, litter quality and SOM formation in a process-oriented way.
The importance of litter quality for SOM formation as found here is in line with recent experiments (Bahri et al., 2008; Rubino et al., 2010; Walela et al., 2014) and modeling studies (Grandy and Neff, 2008; Cotrufo et al., 2013). SOM is mainly formed though the partial decomposition of plant debris by microorganisms (Paul, 2007; Knicker, 2011; Cotrufo et al., 2013). The conceptual model developed by Cotrufo et al. (2013) suggested that although labile litter was decomposed faster than recalcitrant litter, a higher fraction of this labile litter C would be incorporated into microbial biomass and subsequently incorporated into SOM pool (corresponding to a higher CUEd). Therefore, labile litter inputs tend to form a larger SOM pool than the poor-quality (high C : N ratio) litter that is generally used by microbes at lower efficiency. Our simulations of decomposition process of plant litter with different C : N ratios also suggest that litter of good quality (with low C : N ratio) can induce a larger SOM pool than the poor-quality litter (Fig. 7). CUEd plays a more important role than the inhibition effect of low mineral N concentration in determining the size of the stable SOM pool (Fig. A4).
The predictions from Cotrufo et al. (2013) and this study contrast with the conventional hypothesis whereby the poor-quality litter with low decay rate and small CUEd are preferential to be accumulated in SOM (Berg and Mcclaugherty, 2008; Walela et al., 2014). This view of SOM stabilization, however, seems to apply to N-limited systems with high C : N litter and where microbial remains are recalcitrant to decomposition (e.g., boreal forests); in these systems, SOC does accumulate despite its low quality (Kyaschenko et al., 2017). Moreover, one could argue that higher CUEd implies larger microbial biomass, allowing faster decomposition (Allison et al., 2010). These feedbacks between microbial biomass and decomposition rate were not implemented in the current model, but could offer additional flexibility – again at the expense of more difficult model parameterization.
The CUEd formulation from Eq. (2) with parameters calibrated from the two sets of incubation experiments might underestimate the impacts of litter quality on microbial CUE under natural conditions, in particular in the case of SOM decomposition. In both incubation experiments, litter is firstly cut into fine fragments and then fully mixed with mineral soil (Recous et al.,1995; Guenet et al., 2010). Thus, the nutrient accessibility, air permeability and some other environmental factors (e.g., pH) of incubated litter are different from those of decaying litter in more natural, heterogeneous soil conditions. Those different decomposition conditions might be responsible for the differences observed in Fig. 6 between our CUE estimates and previously reported values. We speculate that more heterogeneous conditions reduce nutrient availability and thus might cause lower CUE. Similarly, CUE of surface litter decomposers may be lower than we estimated (Fig. 6), because litter not mixed with soil is probably subject to stronger nutrient limitation.
Further validation and development of our model are still necessary to decrease the model uncertainties. Soil mineral N which affects both litter decay rate and CUE of decayed litter is seldom monitored in litter incubation experiments (e.g., Walela et al., 2014; Stewart et al., 2015) and field litter decay experiments (e.g., Gholz et al., 2000; Harmon et al., 2009), with few exceptions (Recous et al., 1995; Guenet et al., 2010). An increasing number of land surface models (Wang et al., 2010; Zaehle et al., 2014; Goll et al., 2017) have representations of the terrestrial N cycle. By incorporating our newly developed formulations of CUEd and f(Nmin) in these land surface models that simulate the dynamics of soil mineral N concentration, it will be possible to test and validate our developments with more extensive data from laboratory and field experiments. Moreover, similar to N, P has also been suggested as another important factor for litter decomposition and SOM formation (Güsewell and Verhoeven, 2006; Talkner et al., 2009; Manzoni et al., 2010; Prescott, 2010), especially in regions with highly weathered soil (Goll et al., 2012, 2017; Yang et al., 2014). So, it might be necessary to include the effects of P on litter decay rate and CUEd in our model in order to further decrease the simulation uncertainties.
By adapting the hypothesis of optimal microbial CUE proposed by Manzoni et al. (2017) for use in a CENTURY-based model and also introducing a N scaling function to represent the limits of mineral N availability on litter decay rate, we developed a simple but effective litter decomposition model that accounts for key stoichiometric constraints during decomposition. Validation using observation data obtained from laboratory incubation experiments indicated that our model could well predict the respiration rates of litter in different qualities at various levels of mineral N availability. Idealized simulations using our model revealed that the quality of litter inputs plays an important role in determining the soil C stock at equilibrium. High-quality litter (i.e., with low C : N ratio) tends to form a larger SOM pool, as it can be more efficiently utilized by microorganisms than recalcitrant litter (e.g., high C : N ratio). Overall, the developed model captures the microbial mechanisms mediating litter stoichiometry and soil mineral N effects on litter decomposition and SOM formation. Due to the simple and generalizable structure of our model, it can be incorporated into existing land surface models for further long-term and large spatial-scale applications.
The CENTURY-based model used here is programmed in MATLAB language. The source code is available online (https://github.com/hchzhang/CENYUTY_CUE/tree/v1.0 from 8 July 2018). All the data used in this study can be obtained from published literature. Specific references to these data can be found in Sect. 2.5.
Table A1List of symbols used in this study; stoichiometric ratios are all expressed on a mass basis.
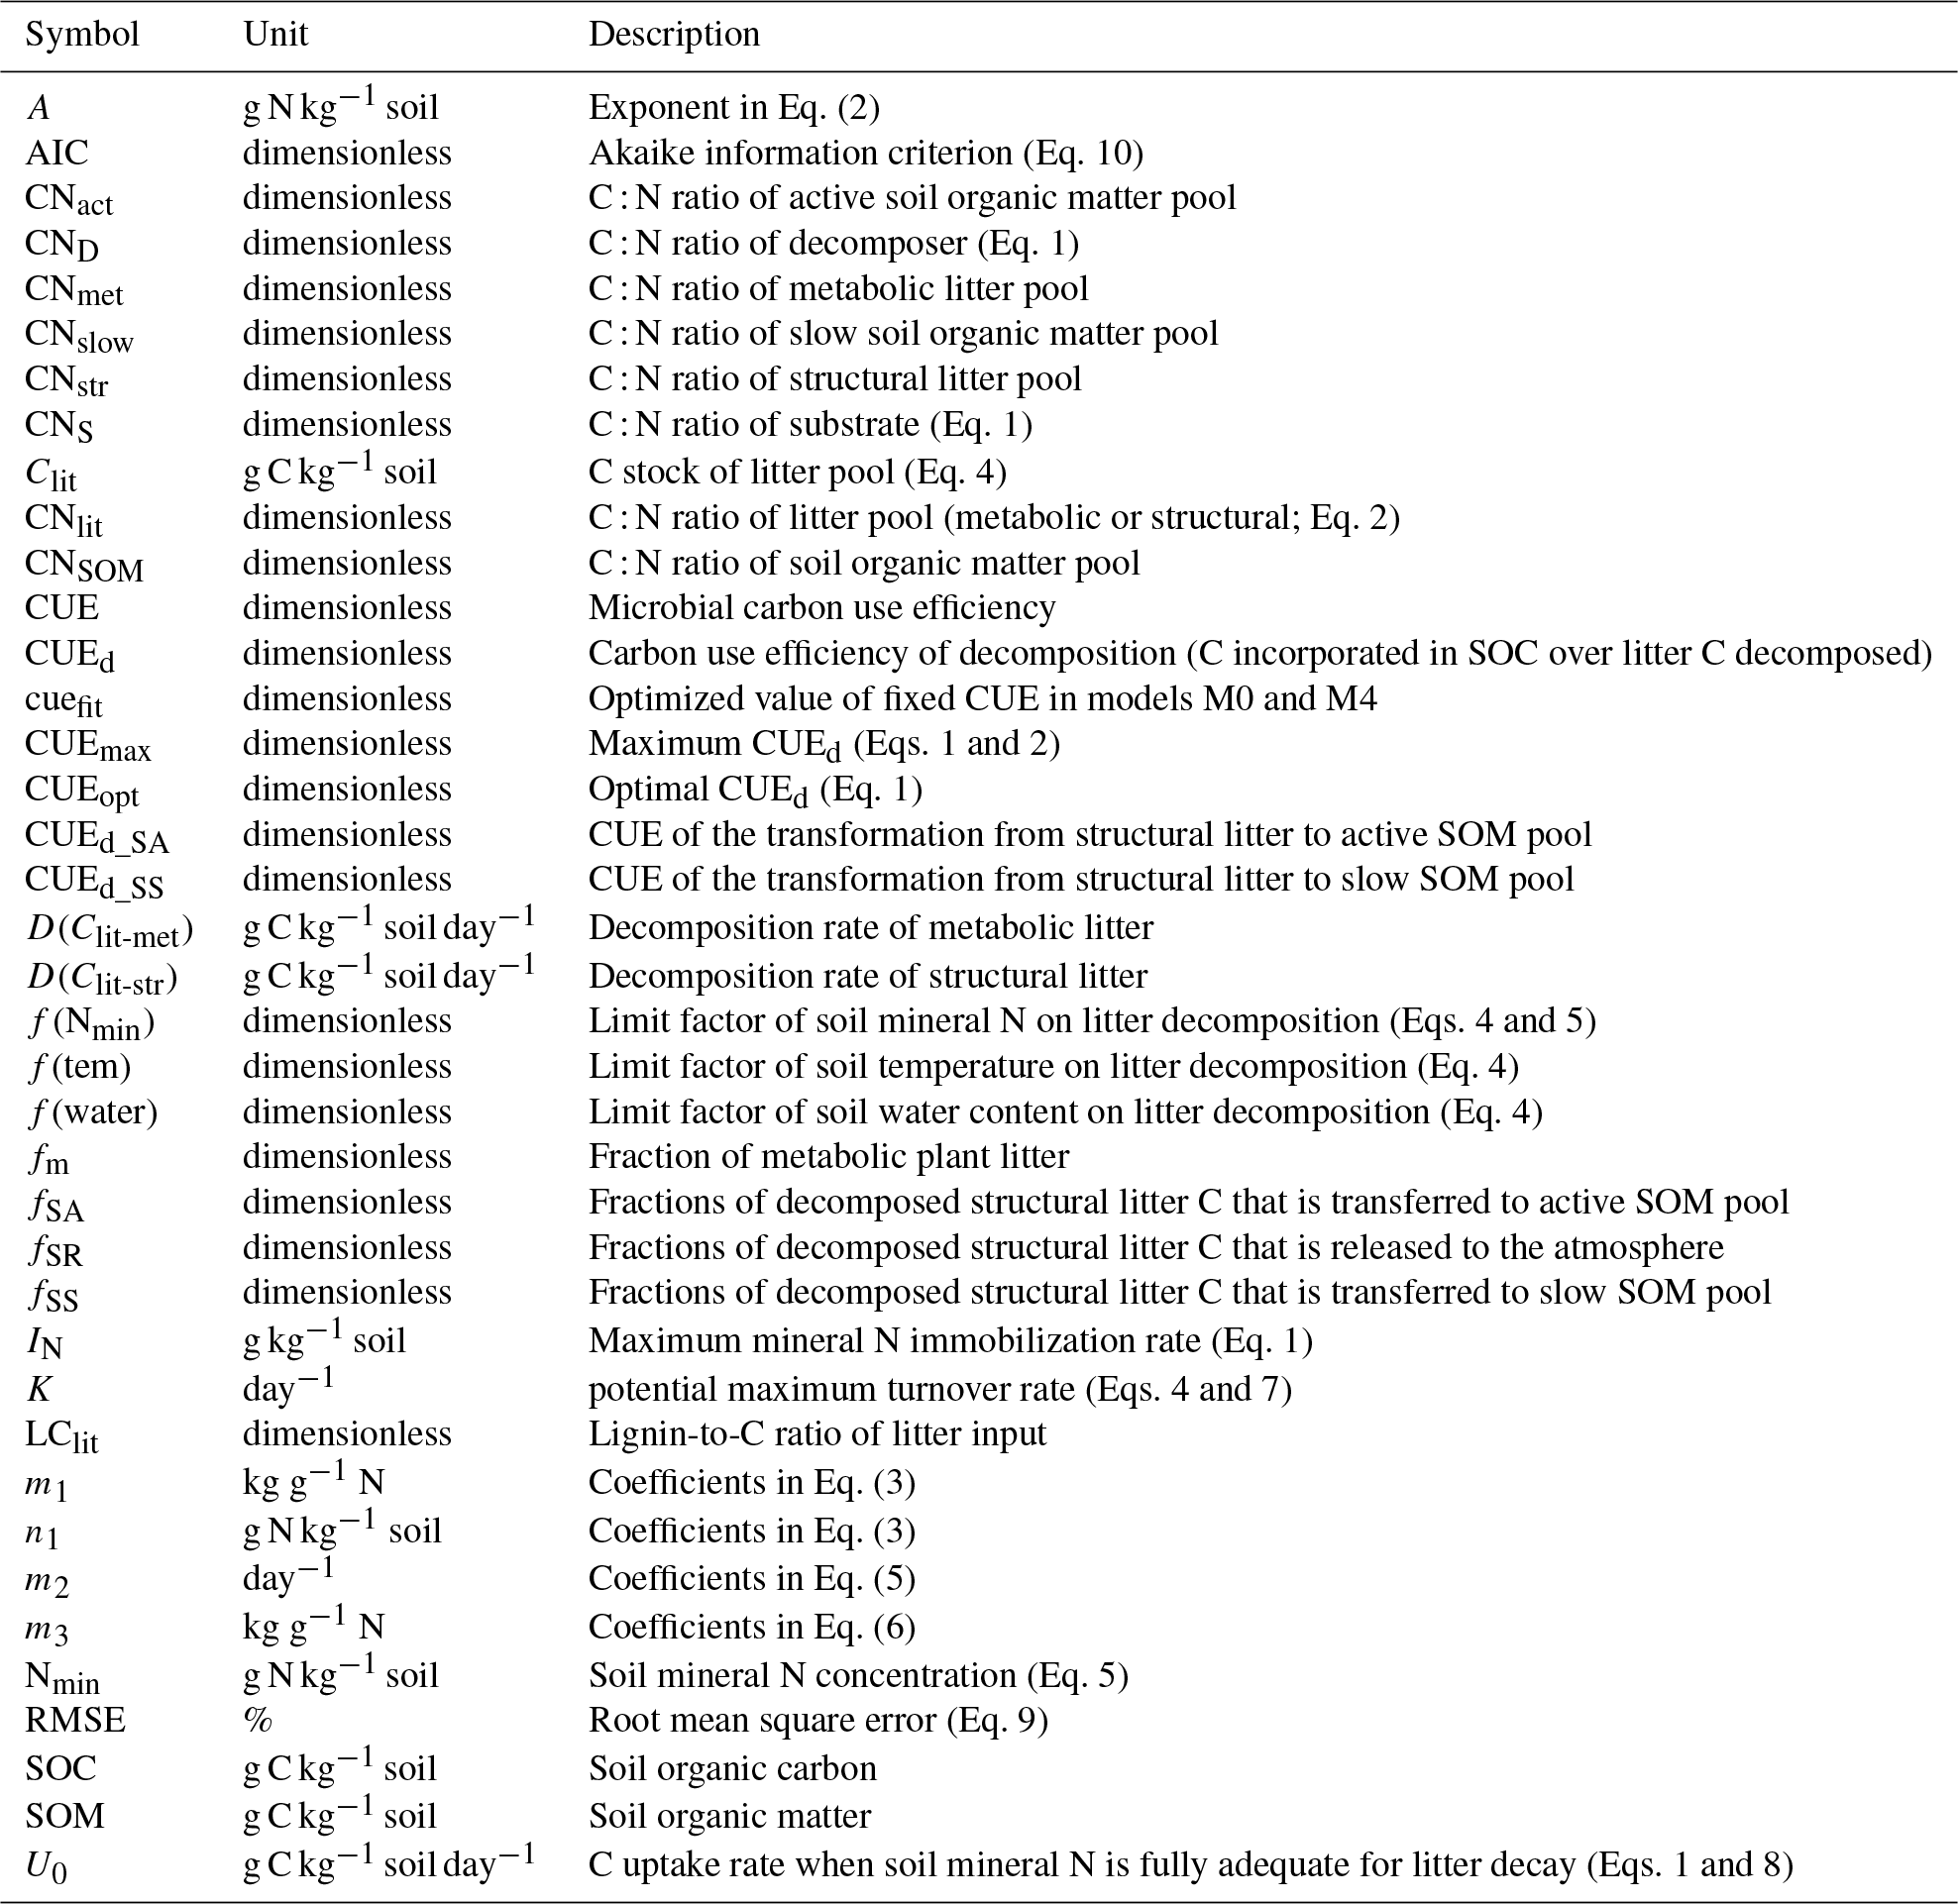
Table A2Information about the 14 samples of laboratory incubation experiment used in this study. CNlit and LClit are the C : N ratio and lignin-to-C ratio of plant litter, respectively. CNSOM is the C : N ratio of SOM pool. Nmin is the concentration of soil mineral N ( + ). For the incubation experiments of Guenet et al. (2010), cumulative respired litter C was measured on days 1, 3, 7, 15, 22, 28, 35, 42, 49, 67 and 80, and Nmin was measured on days 3, 7, 17, 28 and 80. For the incubation experiments of Recous et al. (1995), both cumulative respired litter C and Nmin were mostly measured on days 2, 3, 6, 11, 15, 18, 29, 40, 69 and 124.

Table A3List of parameters calibrated for two versions of the litter decomposition model (M0, M1): klitm and klits are, respectively, the turnover rates of metabolic and structural litter pools, m4 is the coefficient in Eq. (8), cuefit is the optimized value of CUE, m1 and n1 are the coefficients in Eq. (3), and m2 is the coefficient in Eq. (5).
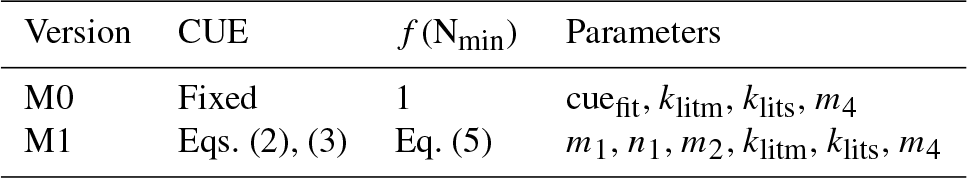
Table A4Specific setting of litter and SOM properties, and soil conditions in the 16 idealized simulations for exploring the impacts of litter stoichiometry (i.e., C : N ratio) and soil mineral N on SOC accumulation. CNlit and LClit are the C : N ratio and lignin-to-C ratio of plant litter, respectively. Litinp (g C kg−1 soil day−1) is the daily input rate of plant litter. CNSOM is the C : N ratio of SOM pool. Nmin (g N kg−1 soil) is the concentration of soil mineral N ( + ). Temp (∘C) and SWC (%) are the temperature and soil water content, respectively.
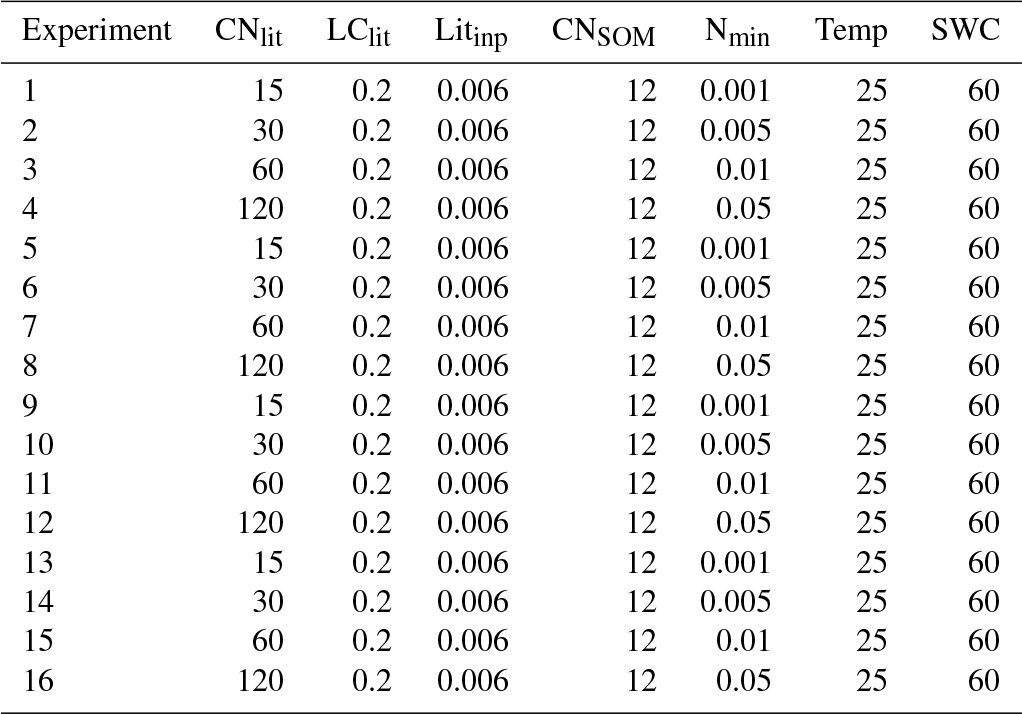
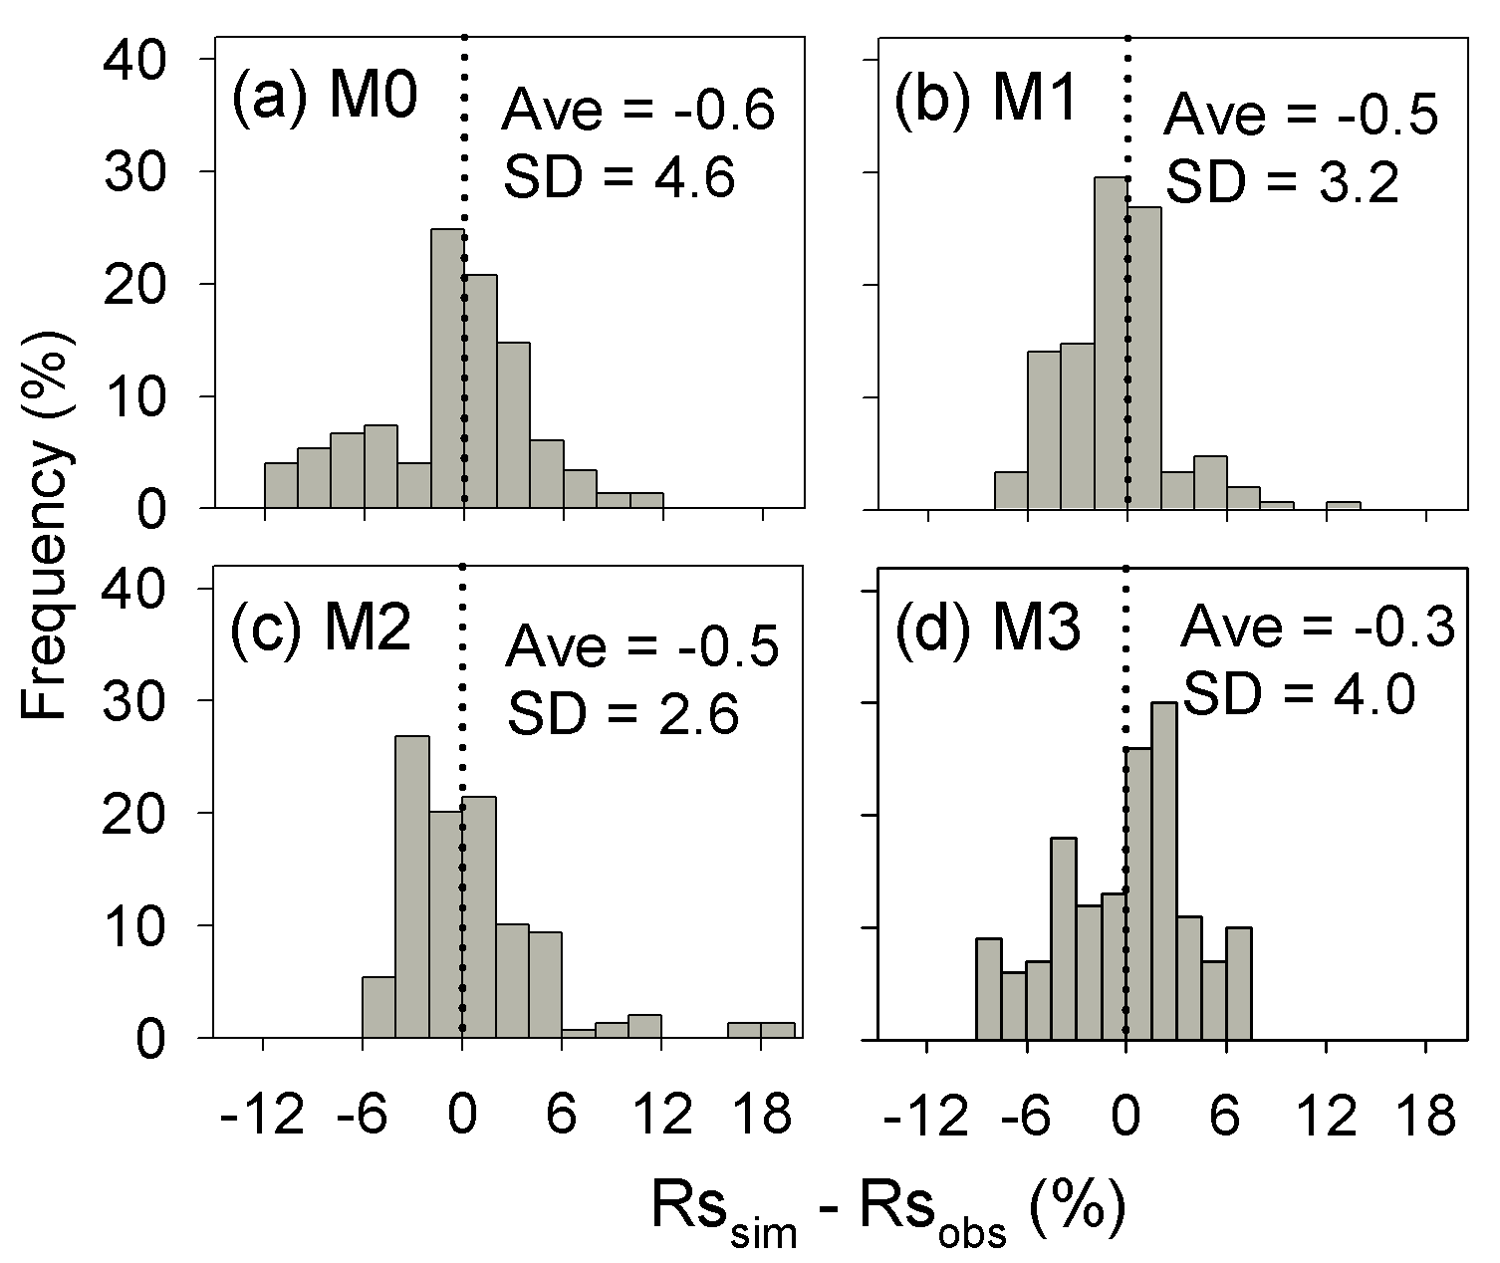
Figure A1Distribution of the difference between the predicted cumulative respired litter C (Rssim, %) and the observed values (Rsobs, %) for all experiments and points in time. SD is the standard deviation of the biases. M0–M3 denote the four models tested in this study (Table 1).
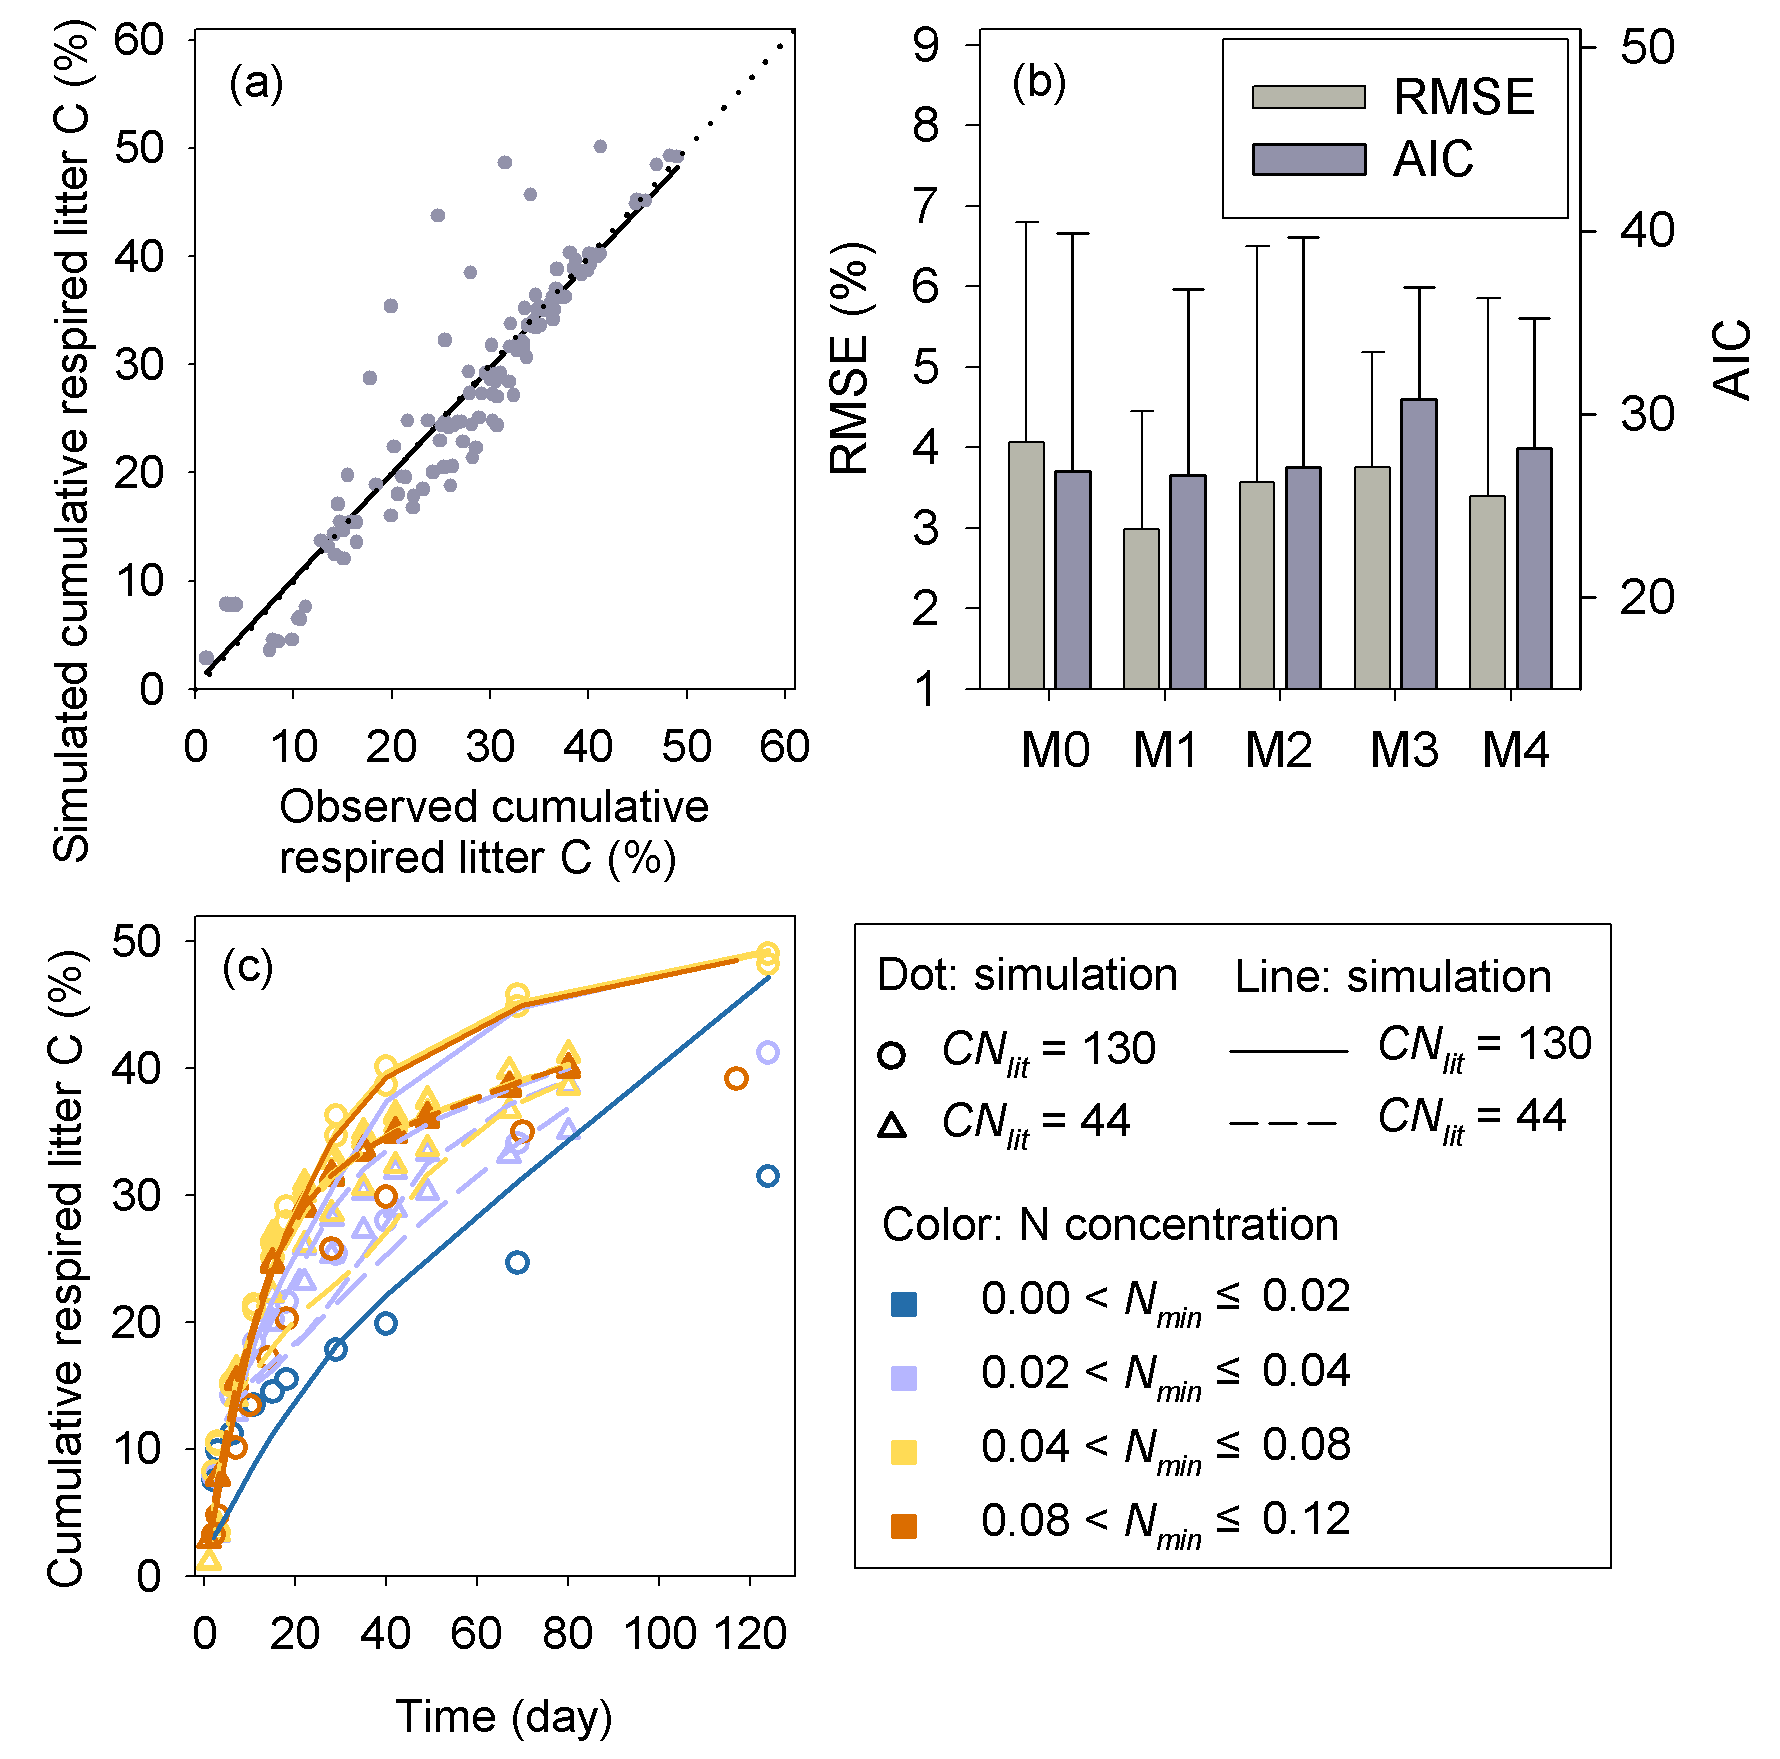
Figure A2Comparison between simulated cumulative respired litter C with f(Nmin) (inhibition effect of soil mineral N on litter decomposition) calculated by Eq. (6) and the observed results from incubation experiments. In panel (b), M0–M4 denote the five versions of litter decay model in Table 1. M4 denotes the model which used Eq. (2) to calculate the dynamic CUE and Eq. (6) to calculate f(Nmin).
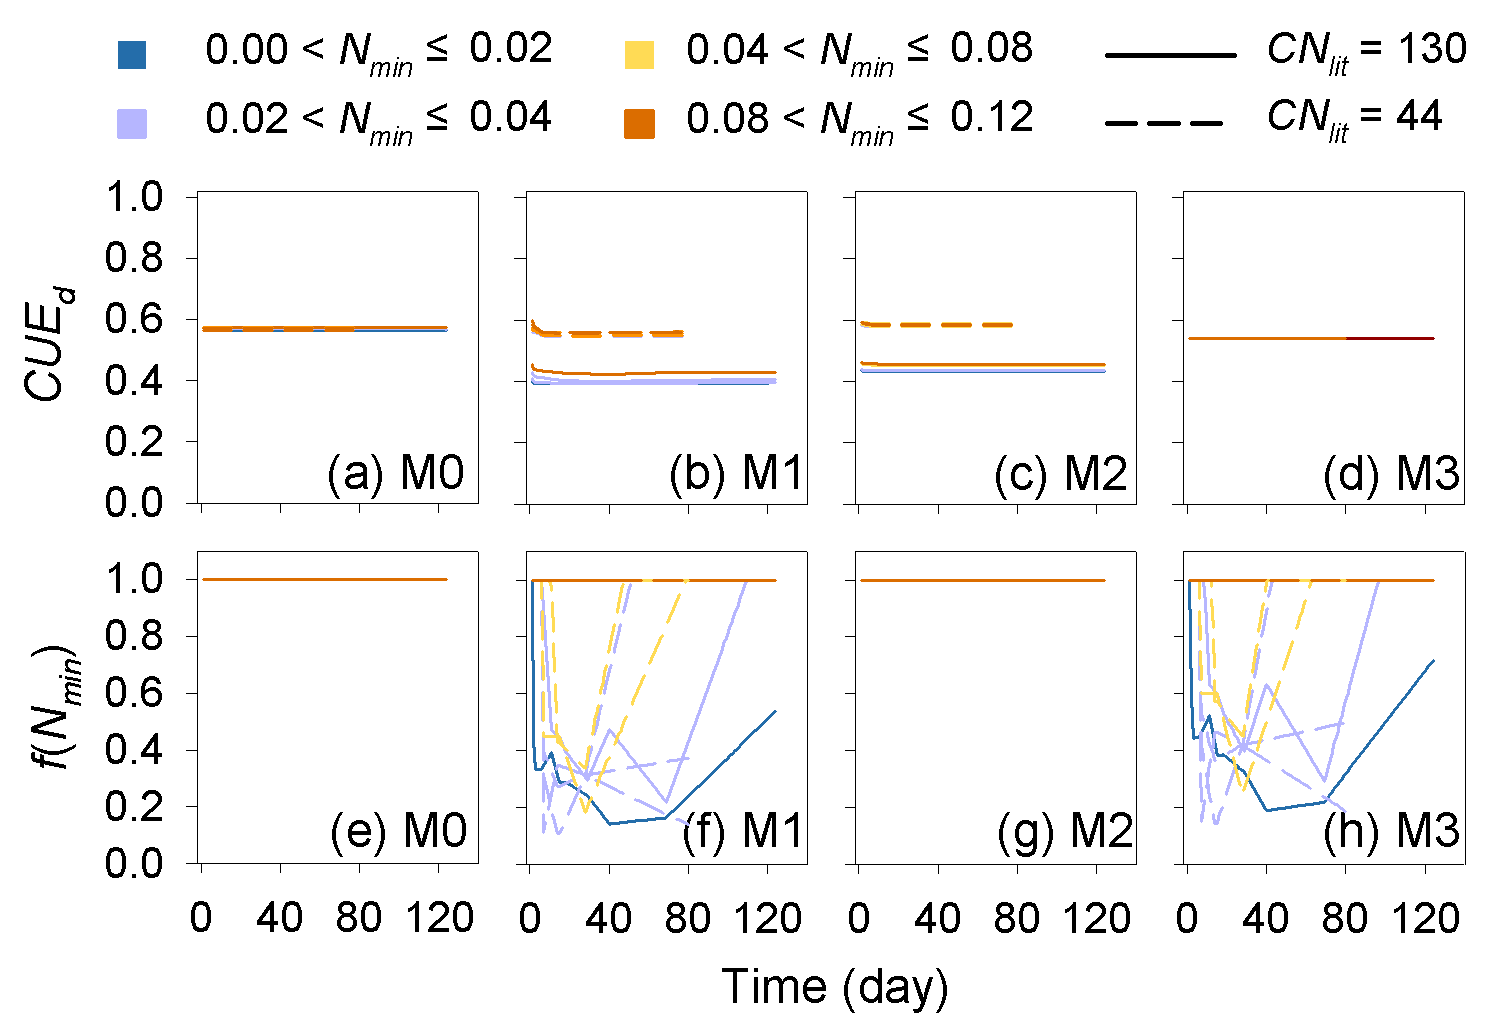
Figure A3Dynamic of the simulated carbon use efficiency (CUE) and f(Nmin) during the incubation experiments (Table A4). CNlit is the C : N ratio of incubated litter, and Nmin is the initial soil mineral N concentration (g N kg−1 soil). M0–M3 are the four models in Table 1. Here, the simulation results of each model were calculated with parameters optimized based on all of the 14 samples of incubation experiments (Table A2).
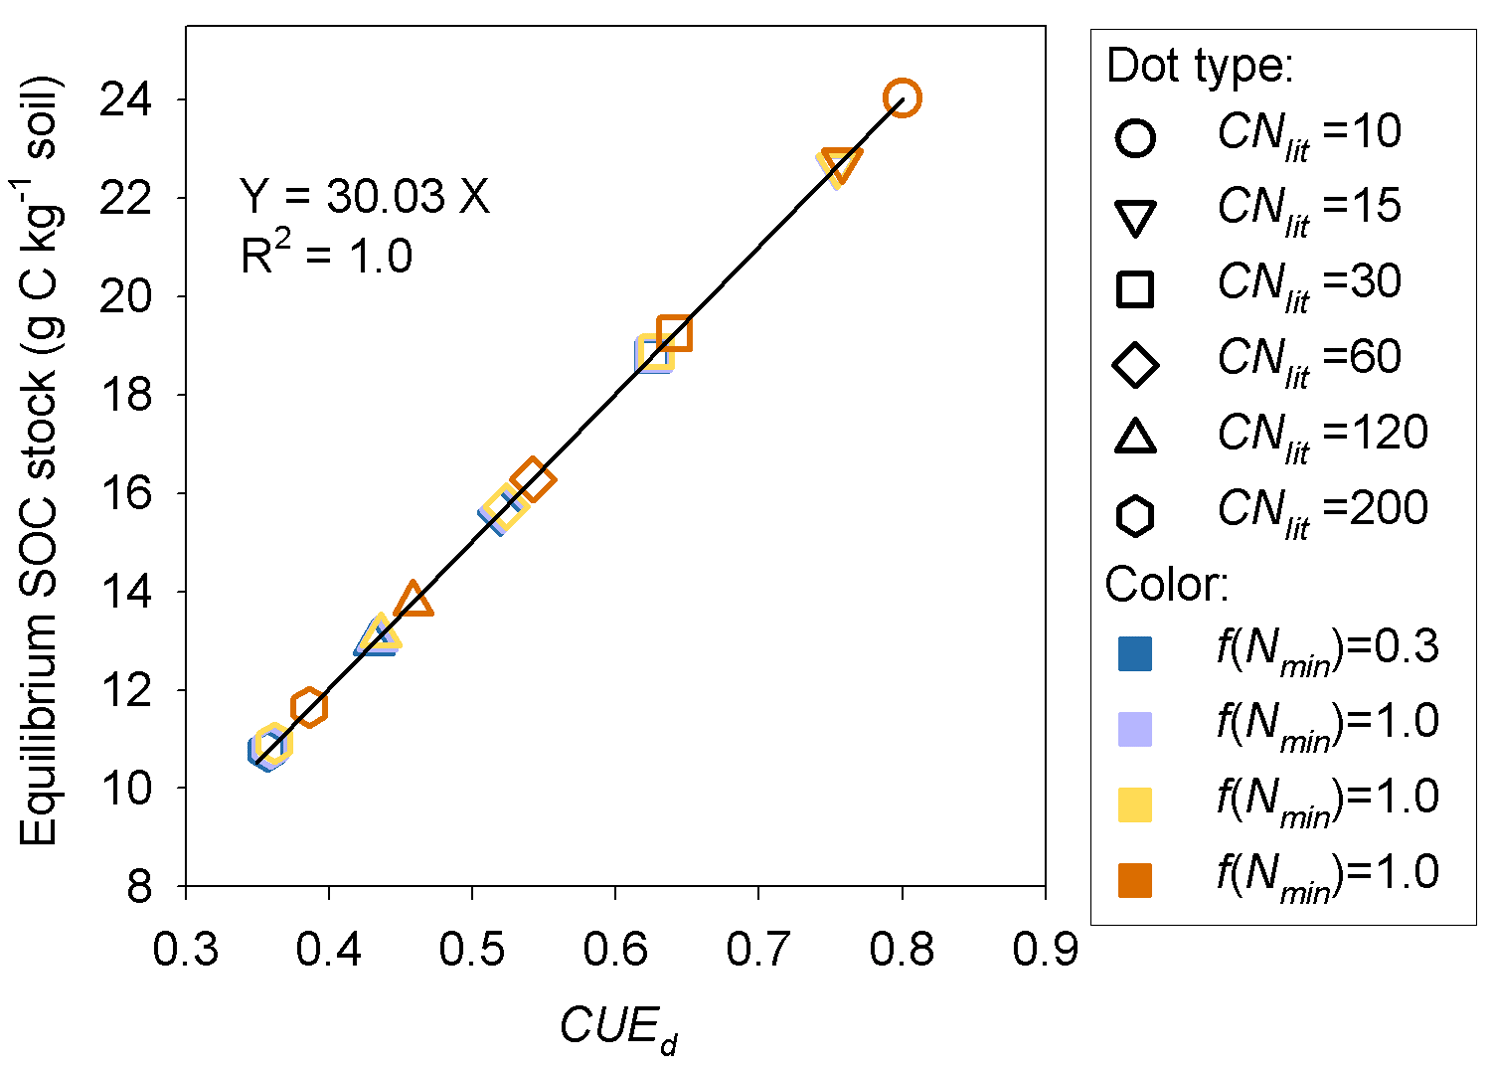
Figure A4Relationship between C stock of the potentially equilibrated SOM pool and the carbon use efficiency of decomposed metabolic litter (CUEd) at the dynamic equilibrium stage. f(Nmin) denotes the inhibition factor (0–1) of soil mineral N on litter decomposition.
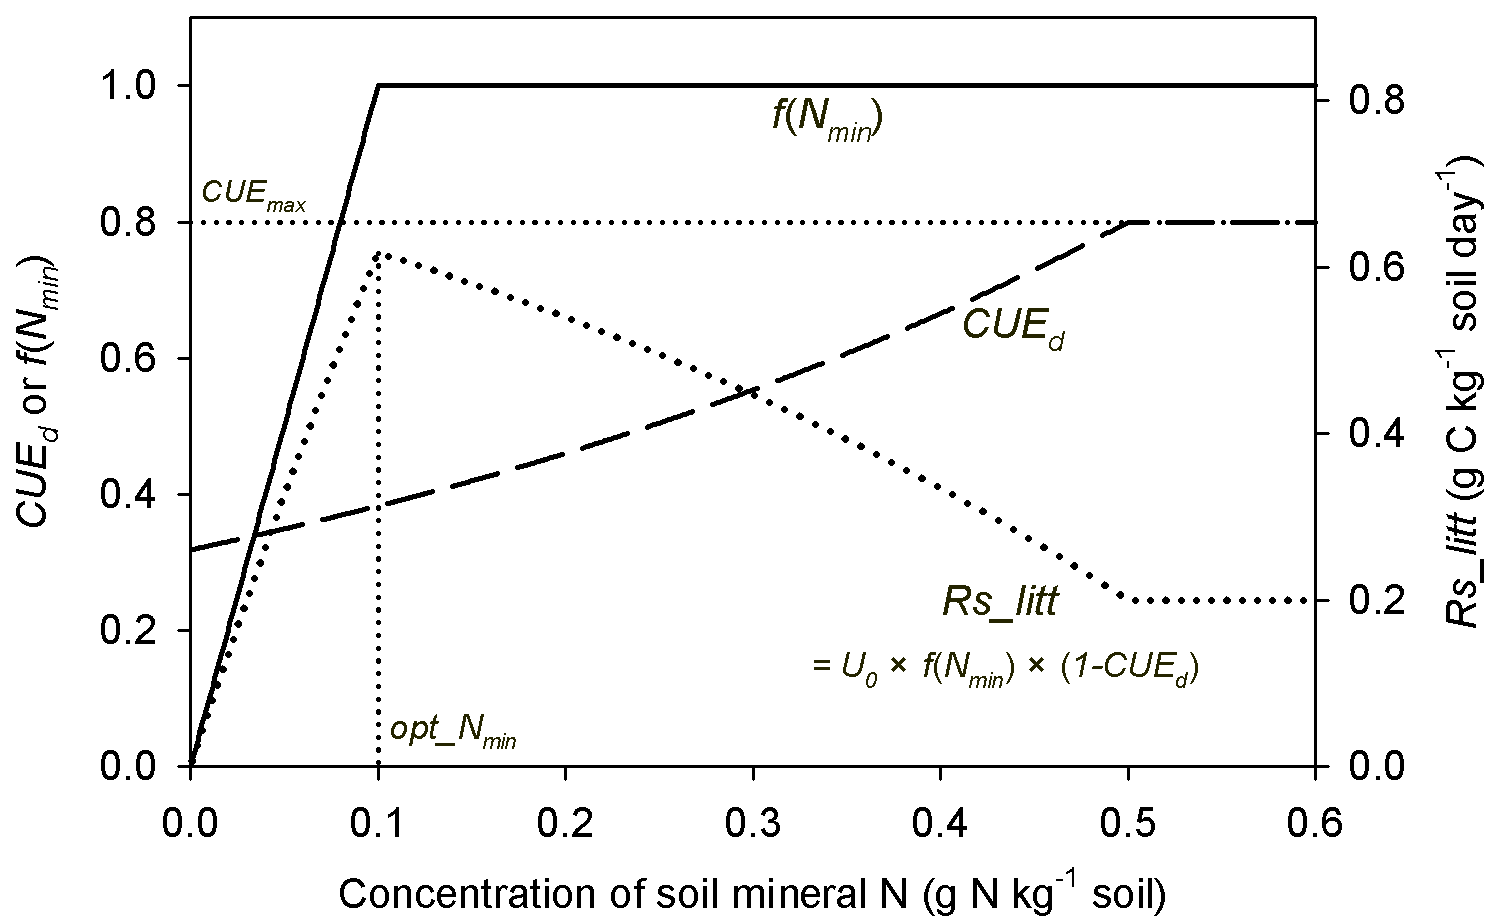
Figure A5Schematic plot for change trends of f(Nmin) (inhibition effect of mineral N; Eq. 6), CUEd (carbon use efficiency of decomposed litter; Eqs. 2, 3) and Rs_litt (litter respiration rate) with increasing concentration of soil mineral N. CUEmax (equal to 0.8) is the maximum CUE set in this study. opt_Nmin denotes the concentration of soil mineral N at which litter respiration is maximized. U0 is the potential decomposition rate when mineral N is fully adequate for litter decay.
HZ led the model development, calibration and validation, and performed all simulations and analysis. DSG, SM, and PC assisted with the implementation of flexible CUE and the limit of soil mineral N availability on litter decomposition rate in the CENTURY model, and contributed to model validation and result analysis. BG provided a part of the calibration and validation data from his laboratory incubation data. HY provided the original source code of CENTURY model. All authors contributed with their comments to the writing of the paper.
The authors declare that they have no conflict of interest.
Haicheng Zhang, Daniel S. Goll, Philippe Ciais and Yuanyuan Huang are funded
by the IMBALANCE-P project of the European Research Council
(ERC-2013-SyG-610028). Stefano Manzoni acknowledges the support of the
Swedish Research Council Vetenskapsrådet (grants 2016-04146 and
2016-06313) and Formas (grant 2015-468).
Edited by: David Lawrence
Reviewed by: two anonymous referees
Allison, S. D.: A trait-based approach for modelling microbial litter decomposition, Ecol. Lett., 15, 1058–1070, https://doi.org/10.1111/j.1461-0248.2012.01807.x, 2012.
Allison, S. D., Wallenstein, M. D., and Bradford, M. A.: Soil-carbon response to warming dependent on microbial physiology, Nat. Geosci., 3, 336–340, https://doi.org/10.1038/ngeo846, 2010.
Averill, C. and Waring, B.: Nitrogen limitation of decomposition and decay: How can it occur?, Glob. Change Biol., 24, 1417–1427, https://doi.org/10.1111/gcb.13980, 2018.
Bahri, H., Rasse, D. P., Rumpel, C., Dignac, M. F., Bardoux, G., Mariotti, A.: Lignin degradation during a laboratory incubation followed by 13C isotope analysis, Soil Biol. Biochem., 40, 1916–1922, 2008.
Barnes, P. W., Throop, H. L., Hewins, D. B., Abbene, M. L., and Archer, S. R.: Soil coverage reduces photodegradation and promotes the development of soil microbial films on dryland leaf litter, Ecosystems, 15, 311–321, 2012.
Berg, B. and Mcclaugherty, C.: Plant Litter. Decomposition, Humus Formation, Carbon Sequestration, Springer Verlag, Heidelberg, Germany, 2008.
Bonan, G. B., Hartman, M. D., Parton, W. J., and Wieder, W. R.: Evaluating litter decomposition in earth system models with long-term litterbag experiments: an example using the Community Land Model version 4 (CLM4), Glob. Change Biol., 19, 957–974, 2013.
Bozdogan, H.: Model selection and Akaike's Information Criterion (AIC): The general theory and its analytical extensions, Psychometrika, 52, 345–370, 1987.
Brovkin, V., van Bodegom, P. M., Kleinen, T., Wirth, C., Cornwell, W. K., Cornelissen, J. H. C., and Kattge, J.: Plant-driven variation in decomposition rates improves projections of global litter stock distribution, Biogeosciences, 9, 565–576, https://doi.org/10.5194/bg-9-565-2012, 2012.
Campbell, E. E. and Paustian, K.: Current developments in soil organic matter modeling and the expansion of model applications: a review, Environ. Res. Lett., 10, 123004, https://doi.org/10.1088/1748-9326/10/12/123004, 2015.
Campbell, E. E., Parton, W. J., Soong, J. L., Paustian, K., Hobbs, N. T., and Cotrufo, M. F.: Using litter chemistry controls on microbial processes to partition litter carbon fluxes with the Litter Decomposition and Leaching (LIDEL) model, Soil Biol. Biochem., 100, 160–174, https://doi.org/10.1016/j.soilbio.2016.06.007, 2016.
Cleveland, C. C. and Liptzin, D.: C : N:P stoichiometry in soil: is there a “Redfield ratio” for the microbial biomass?, Biogeochemistry, 85, 235–252, https://doi.org/10.1007/s10533-007-9132-0, 2007.
Cotrufo, M. F., Wallenstein, M. D., Boot, C. M., Denef, K., and Paul, E.: The Microbial Efficiency-Matrix Stabilization (MEMS) framework integrates plant litter decomposition with soil organic matter stabilization: do labile plant inputs form stable soil organic matter?, Glob. Change Biol., 19, 988–995, https://doi.org/10.1111/gcb.12113, 2013.
Cotrufo, M. F., Soong, J. L., Horton, A. J., Campbell, E. E., Haddix, Michelle L., Wall, D. H., and Parton, W. J.: Formation of soil organic matter via biochemical and physical pathways of litter mass loss, Nat. Geosci., 8, 776–779, https://doi.org/10.1038/ngeo2520, 2015.
Devêvre, O. C. and Horwáth, W. R.: Decomposition of rice straw and microbial carbon use efficiency under different soil temperatures and moistures, Soil Biol. Biochem., 32, 1773–1785, 2000.
Duan, Q., Sorooshian, S., and Gupta, V. K.: Optimal use of the SCE-UA global optimization method for calibrating watershed models, J. Hydrol., 158, 265–284, 1994.
Duan, Q. Y., Gupta, V. K., and Sorooshian, S.: Shuffled complex evolution approach for effective and efficient global minimization, J. Optimiz. Theory App., 76, 501–521, 1993.
Finn, D., Page, K., Catton, K., Strounina, E., Kienzle, M., Robertson, F., Armstrong, R., and Dalal, R.: Effect of added nitrogen on plant litter decomposition depends on initial soil carbon and nitrogen stoichiometry, Soil Biol. Biochem., 91, 160–168, https://doi.org/10.1016/j.soilbio.2015.09.001, 2015.
Fog, K.: The effect of added nitrogen on the rate of decomposition of organic matter, Biol. Rev., 63, 433–462, 1988.
Franklin, O., Hall, E. K., Kaiser, C., Battin, T. J., and Richter, A.: Optimization of Biomass Composition Explains Microbial Growth-Stoichiometry Relationships, Am. Nat., 177, 29–42, https://doi.org/10.1086/657684, 2011.
Frey, S. D., Lee, J., Melillo, J. M., and Six, J.: The temperature response of soil microbial efficiency and its feedback to climate, Nat. Clim. Change, 3, 395–398, https://doi.org/10.1038/nclimate1796, 2013.
Fujita, Y., Witte, J.-P. M., and van Bodegom, P. M.: Incorporating microbial ecology concepts into global soil mineralization models to improve predictions of carbon and nitrogen fluxes, Global Biogeochem. Cy., 28, 223–238, 2014.
García-Palacios, P., McKie, B. G., Handa, I. T., Frainer, A., Hättenschwiler, S., and Jones, H.: The importance of litter traits and decomposers for litter decomposition: a comparison of aquatic and terrestrial ecosystems within and across biomes, Funct. Ecol., 30, 819–829, https://doi.org/10.1111/1365-2435.12589, 2016.
Gerber, S., Hedin, L. O., Oppenheimer, M., Pacala, S. W., and Shevliakova, E.: Nitrogen cycling and feedbacks in a global dynamic land model, Global Biogeochem. Cy., 24, GB1001, https://doi.org/10.1029/2008GB003336, 2010.
Gholz, H. L., Wedin, D. A., Smitherman, S. M., Harmon, M. E., and Parton, W. J.: Long-term dynamics of pine and hardwood litter in contrasting environments: toward a global model of decomposition, Glob. Change Biol., 6, 751–765, 2000.
Gilmour, C. M., and Gilmour, J. T.: Assimilation of carbon by the soil biomass, Plant Soil, 86, 101–112, 1985.
Goll, D. S., Brovkin, V., Parida, B. R., Reick, C. H., Kattge, J., Reich, P. B., van Bodegom, P. M., and Niinemets, Ü.: Nutrient limitation reduces land carbon uptake in simulations with a model of combined carbon, nitrogen and phosphorus cycling, Biogeosciences, 9, 3547–3569, https://doi.org/10.5194/bg-9-3547-2012, 2012.
Goll, D. S., Vuichard, N., Maignan, F., Jornet-Puig, A., Sardans, J., Violette, A., Peng, S., Sun, Y., Kvakic, M., Guimberteau, M., Guenet, B., Zaehle, S., Penuelas, J., Janssens, I., and Ciais, P.: A representation of the phosphorus cycle for ORCHIDEE (revision 4520), Geosci. Model Dev., 10, 3745–3770, https://doi.org/10.5194/gmd-10-3745-2017, 2017.
Grandy, A. S. and Neff, J. C.: Molecular C dynamics downstream: the biochemical decomposition sequence and its impact on soil organic matter structure and function, Sci. Total Environ., 404, 297–307, 2008.
Guenet, B., Neill, C., Bardoux, G., and Abbadie, L.: Is there a linear relationship between priming effect intensity and the amount of organic matter input?, Appl. Soil Ecol., 46, 436–442, https://doi.org/10.1016/j.apsoil.2010.09.006, 2010.
Guimberteau, M., Zhu, D., Maignan, F., Huang, Y., Yue, C., Dantec-Nédélec, S., Ottlé, C., Jornet-Puig, A., Bastos, A., Laurent, P., Goll, D., Bowring, S., Chang, J., Guenet, B., Tifafi, M., Peng, S., Krinner, G., Ducharne, A., Wang, F., Wang, T., Wang, X., Wang, Y., Yin, Z., Lauerwald, R., Joetzjer, E., Qiu, C., Kim, H., and Ciais, P.: ORCHIDEE-MICT (v8.4.1), a land surface model for the high latitudes: model description and validation, Geosci. Model Dev., 11, 121–163, https://doi.org/10.5194/gmd-11-121-2018, 2018.
Güsewell, S. and Verhoeven, J. T. A.: Litter N : P ratios indicate whether N or P limits the decomposability of graminoid leaf litter, Plant Soil, 287, 131–143, 2006.
Hansen, S., Jensen, H. E., Nielsen, N. E., and Svendsen, H.: Simulation of nitrogen dynamics and biomass production in winter wheat using the Danish simulation model DAISY, Fert. Res., 27, 245–259, 1991.
Harmon, M. E., Silver, W. L., Fasth, B., Chen, H. U. A., Burke, I. C., Parton, W. J., Hart, S. C., and Currie, W. S.: Long-term patterns of mass loss during the decomposition of leaf and fine root litter: an intersite comparison, Glob. Change Biol., 15, 1320–1338, https://doi.org/10.1111/j.1365-2486.2008.01837.x, 2009.
Hewins, D. B., Archer, S. R., Okin, G. S., McCulley R. L., and Throop, H. L.: Soil-litter mixing accelerates decomposition in a Chihuahuan Desert grassland, Ecosystems, 16, 183–195, 2013.
Hobbie, S. E.: Plant species effects on nutrient cycling: revisiting litter feedbacks, Trends Ecol. Evol., 30, 357–363, 2015.
Hobbie, S. E. and Vitousek, P. M.: Nutrient limitation of decomposition in Hawaiian forests, Ecology, 81, 1867–1877, 2000.
Huang, Y., Guenet, B., Ciais, P., Janssens, I. A., Soong, J. L., Wang, Y., Goll, D., Blagodatskaya, E., and Huang, Y.: ORCHIMIC (v1.0), a microbe-mediated model for soil organic matter decomposition, Geosci. Model Dev., 11, 2111–2138, https://doi.org/10.5194/gmd-11-2111-2018, 2018.
Ingwersen, J., Poll, C., Streck, T., and Kandeler, E.: Micro-scale modelling of carbon turnover driven by microbial succession at a biogeochemical interface, Soil Biol. Biochem., 40, 864–878, https://doi.org/10.1016/j.soilbio.2007.10.018, 2008.
Janssens, I. A., Dieleman, W., Luyssaert, S., Subke, J. A., Reichstein, M., Ceulemans, R., Ciais, P., Dolman, A. J., Grace, J., Matteucci, G., Papale, D., Piao, S. L., Schulze, E. D., Tang, J., and Law, B. E.: Reduction of forest soil respiration in response to nitrogen deposition, Nat. Geosci., 3, 315–322, https://doi.org/10.1038/ngeo844, 2010.
Kätterer, T. and Andrén, O.: The ICBM family of analytically solved models of soil carbon, nitrogen and microbial biomass dynamics – descriptions and application examples, Ecol. Model., 136, 191–207, 2001.
Kearns, M. and Ron, D.: Algorithmic stability and sanity-check bounds for leave-one-out cross-validation, Neural Comput., 11, 1427–1453, 1997.
Knicker, H.: Soil organic N – An under-rated player for C sequestration in soils?, Soil Biol. Biochem., 43, 1118–1129, 2011.
Krinner, G., Viovy, N., de Noblet-Ducoudré, N., Ogée, J., Polcher, J., Friedlingstein, P., Ciais, P., Sitch, S., and Prentice, I. C.: A dynamic global vegetation model for studies of the coupled atmosphere-biosphere system, Global Biogeochem. Cy., 19, GB1015, https://doi.org/10.1029/2003gb002199, 2005.
Kucharik, C. J., Foley, J. A., Delire, C., Fisher, V. A., Coe, M. T., Lenters, J. D., Young-Molling, C., Ramankutty, N., Norman, J. M., and Gower, S. T.: Testing the performance of a dynamic global ecosystem model: Water balance, carbon balance, and vegetation structure, Global Biogeochem. Cy., 14, 795–825, https://doi.org/10.1029/1999gb001138, 2000.
Kyaschenko, J., Clemmensen, K. E., Karltun, E., and Lindahl, B. D.: Below-ground organic matter accumulation along a boreal forest fertility gradient relates to guild interaction within fungal communities, Ecol. Lett., 20, 1546–1555, https://doi.org/10.1111/ele.12862, 2017.
Lekkerkerk, L., Lundkvist, H., Ågren, G. I., Ekbohm, G., and Bosatta, E.: Decomposition of heterogeneous substrates; An experimental investigation of a hypothesis on substrate and microbial properties, Soil Biol. Biochem., 22, 161–167, 1990.
Liski, J., Palosuo, T., Peltoniemi, M., and Sievänen, R.: Carbon and decomposition model Yasso for forest soils, Ecol. Model., 189, 168–182, https://doi.org/10.1016/j.ecolmodel.2005.03.005, 2005.
Luo, Y., Ahlström, A., Allison, S. D., Batjes, N. H., Brovkin, V., Carvalhais, N., Chappell, A., Ciais, P., Davidson, E. A., and Finzi, A.: Toward more realistic projections of soil carbon dynamics by Earth system models, Global Biogeochem. Cy., 30, 40–56, https://doi.org/10.1002/2015GB005239, 2016.
Manzoni, S. and Porporato, A.: Soil carbon and nitrogen mineralization: Theory and models across scales, Soil Biol. Biochem., 41, 1355–1379, https://doi.org/10.1016/j.soilbio.2009.02.031, 2009.
Manzoni, S., Jackson, R. B., Trofymow, J. A., and Porporato, A.: The global stoichiometry of litter nitrogen mineralization, Science, 321, 684–686, 2008.
Manzoni, S., Trofymow, J. A., Jackson, R. B., and Porporato, A.: Stoichiometric controls on carbon, nitrogen, and phosphorus dynamics in decomposing litter, Ecol. Monogr., 80, 89–106, 2010.
Manzoni, S., Taylor, P., Richter, A., Porporato, A., and Agren, G. I.: Environmental and stoichiometric controls on microbial carbon-use efficiency in soils, New Phytol., 196, 79–91, https://doi.org/10.1111/j.1469-8137.2012.04225.x, 2012.
Manzoni, S., Capek, P., Mooshammer, M., Lindahl, B. D., Richter, A., and Santruckova, H.: Optimal metabolic regulation along resource stoichiometry gradients, Ecol. Lett., 20, 1182–1191, https://doi.org/10.1111/ele.12815, 2017.
Metherell, A. K., Harding, L. A., Cole, C. V., and Parton, W. J.: CENTURY Soil Organic Matter Model Environment Technical Documentation, Agroecosystem Version 4.0, Great Plains System Research Unit, Technical Report No. 4. USDA-ARS, Ft. Collins, USA, 1993.
Molina, J. A. E., Clapp, C. E., Shaffer, M. J., Chichester, F. W., and Larson, W. E.: NCSOIL, A Model of Nitrogen and Carbon Transformations in Soil: Description, Calibration, and Behavior, Soil Sci. Soc. Am. J., 47, 85–91, 1983.
Moorhead, D. L. and Sinsabaugh, R. L.: A Theoretical Model of Litter Decay and Microbial Interaction, Ecol. Monogr., 76, 151–174, 2006.
Mooshammer, M., Wanek, W., Hammerle, I., Fuchslueger, L., Hofhansl, F., Knoltsch, A., Schnecker, J., Takriti, M., Watzka, M., Wild, B., Keiblinger, K. M., Zechmeister-Boltenstern, S., and Richter, A.: Adjustment of microbial nitrogen use efficiency to carbon:nitrogen imbalances regulates soil nitrogen cycling, Nat. Commun., 5, 3694, https://doi.org/10.1038/ncomms4694, 2014.
Pagel, H., Ingwersen, J., Poll, C., Kandeler, E., and Streck, T.: Micro-scale modeling of pesticide degradation coupled to carbon turnover in the detritusphere: model description and sensitivity analysis, Biogeochemistry, 117, 185–204, https://doi.org/10.1007/s10533-013-9851-3, 2013.
Parton, W., Silver, W. L., Burke, I. C., Grassens, L., Harmon, M. E., Currie, W. S., King, J. Y., Adair, E. C., Brandt, L. A., Hart, S. C., and Fasth, B.: Global-scale similarities in nitrogen release patterns during long-term decomposition, Science, 315, 361–364, https://doi.org/10.1126/science.1134853, 2007.
Parton, W. J., Stewart, J. W. B., and Cole, C. V.: Dynamics of C, N, P and S in grassland soils: a model, Biogeochemistry, 5, 109–131, 1988.
Paul, E. A.: Soil Microbiology, Ecology and Biogeochemistry, Academic Press, San Diego, CA, USA, 2007.
Prescott, C. E.: Litter decomposition: what controls it and how can we alter it to sequester more carbon in forest soils?, Biogeochemistry, 101, 133–149, https://doi.org/10.1007/s10533-010-9439-0, 2010.
Recous, S., Robin, D., Darwis, D., and Mary, B.: Soil inorganic N availability: Effect on maize residue decomposition, Soil Biol. Biochem., 27, 1529–1538, 1995.
Rubino, M., Dungait, J. A. J., Evershed, R. P., Bertolini, T., Angelis, P. D., D'Onofrio, A., Lagomarsino, A., Lubritto, C., Merola, A., and Terrasi, F.: Carbon input belowground is the major C flux contributing to leaf litter mass loss: Evidences from a 13C labelled-leaf litter experiment, Soil Biol. Biochem., 42, 1009–1016, 2010.
Schimel, J. P. and Weintraub, M. N.: The implications of exoenzyme activity on microbial carbon and nitrogen limitation in soil: a theoretical model, Soil Biol. Biochem., 35, 549–563, 2003.
Schmidt, M. W., Torn, M. S., Abiven, S., Dittmar, T., Guggenberger, G., Janssens, I. A., Kleber, M., Kogel-Knabner, I., Lehmann, J., Manning, D. A., Nannipieri, P., Rasse, D. P., Weiner, S., and Trumbore, S. E.: Persistence of soil organic matter as an ecosystem property, Nature, 478, 49–56, https://doi.org/10.1038/nature10386, 2011.
Sinsabaugh, R. L., Manzoni, S., Moorhead, D. L., and Richter, A.: Carbon use efficiency of microbial communities: stoichiometry, methodology and modelling, Ecol. Lett., 16, 930–939, https://doi.org/10.1111/ele.12113, 2013.
Sitch, S., Smith, B., Prentice, I. C., Arneth, A., Bondeau, A., Cramer, W., Kaplan, J. O., Levis, S., Lucht, W., Sykes, M. T., Thonicke, K., and Venevsky, S.: Evaluation of ecosystem dynamics, plant geography and terrestrial carbon cycling in the LPJ dynamic global vegetation model, Glob. Change Biol., 9, 161–185, https://doi.org/10.1046/j.1365-2486.2003.00569.x, 2003.
Six, J., Frey, S. D., Thiet, R. K., and Batten, K. M.: Bacterial and Fungal Contributions to Carbon Sequestration in Agroecosystems, Soil Sci. Soc. Am. J., 70, 555–569, 2006.
Stewart, C. E., Moturi, P., Follett, R. F., and Halvorson, A. D.: Lignin biochemistry and soil N determine crop residue decomposition and soil priming, Biogeochemistry, 124, 335–351, https://doi.org/10.1007/s10533-015-0101-8, 2015.
Talkner, U., Jansen, M., and Beese, F. O.: Soil phosphorus status and turnover in central-European beech forest ecosystems with differing tree species diversity, Eur. J. Soil Sci., 60, 338–346, 2009.
Thiet, R. K., Frey, S. D., and Six, J.: Do growth yield efficiencies differ between soil microbial communities differing in fungal:bacterial ratios? Reality check and methodological issues, Soil Biol. Biochem., 38, 837–844, https://doi.org/10.1016/j.soilbio.2005.07.010, 2006.
Tramontana, G., Jung, M., Schwalm, C. R., Ichii, K., Camps-Valls, G., Ráduly, B., Reichstein, M., Arain, M. A., Cescatti, A., Kiely, G., Merbold, L., Serrano-Ortiz, P., Sickert, S., Wolf, S., and Papale, D.: Predicting carbon dioxide and energy fluxes across global FLUXNET sites with regression algorithms, Biogeosciences, 13, 4291–4313, https://doi.org/10.5194/bg-13-4291-2016, 2016.
Tuomi, M., Laiho, R., Repo, A., and Liski, J.: Wood decomposition model for boreal forests, Ecol. Model., 222, 709–718, 2011.
Verberne, E. L. J., Hassink, J., Willigen, P. D., Groot, J. J. R., and Veen, J. A. V.: Modelling organic matter dynamics in different soils, Neth. J. Agr. Sci., 38, 221–238, 1990.
Walela, C., Daniel, H., Wilson, B., Lockwood, P., Cowie, A., and Harden, S.: The initial lignin : nitrogen ratio of litter from above and below ground sources strongly and negatively influenced decay rates of slowly decomposing litter carbon pools, Soil Biol. Biochem., 77, 268–275, https://doi.org/10.1016/j.soilbio.2014.06.013, 2014.
Wang, Y. P., Law, R. M., and Pak, B.: A global model of carbon, nitrogen and phosphorus cycles for the terrestrial biosphere, Biogeosciences, 7, 2261–2282, https://doi.org/10.5194/bg-7-2261-2010, 2010.
Wieder, W. R., Bonan, G. B., and Allison, S. D.: Global soil carbon projections are improved by modelling microbial processes, Nat. Clim. Change, 3, 909–912, https://doi.org/10.1038/nclimate1951, 2013.
Wieder, W. R., Cleveland, C. C., Smith, W. K., and Todd-Brown, K.: Future productivity and carbon storage limited by terrestrial nutrient availability, Nat. Geosci., 8, 441–444, 2015.
Yang, X., Thornton, P. E., Ricciuto, D. M., and Post, W. M.: The role of phosphorus dynamics in tropical forests – a modeling study using CLM-CNP, Biogeosciences, 11, 1667–1681, https://doi.org/10.5194/bg-11-1667-2014, 2014.
Zaehle, S., Medlyn, B. E., De Kauwe, M. G., Walker, A. P., Dietze, M. C., Hickler, T., Luo, Y., Wang, Y.-P., El-Masri, B., Thornton, P., Jain, A., Wang, S., Warlind, D., Weng, E., Parton, W., Iversen, C. M., Gallet-Budynek, A., McCarthy, H., Finzi, A., Hanson, P. J., Prentice, I. C., Oren, R., and Norby, R. J.: Evaluation of 11 terrestrial carbon–nitrogen cycle models against observations from two temperate Free-Air CO2 Enrichment studies, New Phytol., 202, 803–822, 2014.
Zhang, C. F., Meng, F. R., Bhatti, J. S., Trofymow, J. A., and Arp, P. A.: Modeling forest leaf-litter decomposition and N mineralization in litterbags, placed across Canada: A 5-model comparison, Ecol. Model., 219, 342–360, https://doi.org/10.1016/j.ecolmodel.2008.07.014, 2008.
Zhang, J. and Elser, J. J.: Carbon:Nitrogen:Phosphorus Stoichiometry in Fungi: A Meta-Analysis, Front. Microbiol., 8, 1281, https://doi.org/10.3389/fmicb.2017.01281, 2017.