the Creative Commons Attribution 4.0 License.
the Creative Commons Attribution 4.0 License.
 | 07 Jan 2019
The AFWA dust emission scheme for the GOCART aerosol model in WRF-Chem v3.8.1
Sandra L. LeGrand
Chris Polashenski
Theodore W. Letcher
Glenn A. Creighton
Steven E. Peckham
Jeffrey D. Cetola
Airborne particles of mineral dust play a key role in Earth's climate system and affect human activities around the globe. The numerical weather modeling community has undertaken considerable efforts to accurately forecast these dust emissions. Here, for the first time in the literature, we thoroughly describe and document the Air Force Weather Agency (AFWA) dust emission scheme for the Georgia Institute of Technology–Goddard Global Ozone Chemistry Aerosol Radiation and Transport (GOCART) aerosol model within the Weather Research and Forecasting model with chemistry (WRF-Chem) and compare it to the other dust emission schemes available in WRF-Chem. The AFWA dust emission scheme addresses some shortcomings experienced by the earlier GOCART-WRF scheme. Improved model physics are designed to better handle emission of fine dust particles by representing saltation bombardment. WRF-Chem model performance with the AFWA scheme is evaluated against observations of dust emission in southwest Asia and compared to emissions predicted by the other schemes built into the WRF-Chem GOCART model. Results highlight the relative strengths of the available schemes, indicate the reasons for disagreement, and demonstrate the need for improved soil source data.
- Article
(12097 KB) - Full-text XML
- BibTeX
- EndNote


Airborne mineral dust particles play a key role in Earth's radiative budget, weather and climate patterns, and biogeochemical processes (Boucher et al., 2013; DeMott et al., 2010; F. Wang et al., 2017; Huang et al., 2014; Knippertz and Stuut, 2014; Mahowald et al., 2014, 2005, 2010; Ravi et al., 2011; Shinn et al., 2000; Skiles et al., 2015; Webb et al., 2012). Dust can also create hazardous air quality conditions that negatively affect health, agriculture, visibility, communication, and mobility (Al-Hemoud et al., 2017; De Longueville et al., 2010; Goudie and Middleton, 2006; McDonald and Caldwell, 2008; Middleton, 2017; Okin et al., 2011; Rushing et al., 2005; Sprigg et al., 2014). As a result, the development of accurate numerical models of dust emissions and transport is a priority for the research, operational forecasting, and hazard mitigation communities (Knippertz and Stuut, 2014; Shepherd et al., 2016; Sprigg et al., 2014).
Over the past several decades, numerous dust emission and transport models have been developed for forecasting and research purposes (Ginoux et al., 2001; Gong, 2003; In and Park, 2002; Klose and Shao, 2012, 2013; Liu et al., 2003, 2007; Nickovic et al., 2001; Shao, 2001; Tanaka and Chiba, 2005; Tegen and Fung, 1994; Wang et al., 2000; Woodward, 2001; Zender, 2003). One broadly adopted aerosol model is the Georgia Institute of Technology–Goddard Global Ozone Chemistry Aerosol Radiation and Transport (GOCART) model (Chin et al., 2000; Ginoux et al., 2001). The GOCART model includes components that represent the emission, transport, and deposition of an array of atmospheric aerosols including sea spray, combustion products, and mineral dust. In this publication, we will focus on GOCART's representation of mineral dust aerosol. More specifically, we will address one of the most important components of the model for simulating the evolution of dust storms – the representation of dust emissions from the soil surface, which is the critical first step enabling dust transport in the atmosphere.
First, we present a brief history of relevant model development. GOCART was originally designed as a standalone, offline aerosol model driven by assimilated meteorological fields (Chin et al., 2000; Ginoux et al., 2001); however, components of the code have been added to other model frameworks since its release (Barnum et al., 2004; Colarco et al., 2003a, b; Peckham et al., 2011). In 2009, GOCART aerosol physics, including algorithms for dust emissions, transport, dry deposition, and gravitational settling, were added to the Weather Research and Forecasting model with chemistry (WRF-Chem) framework. WRF-Chem is a mesoscale non-hydrostatic Earth system model able to simulate particulate transport and feedbacks simultaneously with the meteorological fields (Fast et al., 2006; Grell et al., 2005; Peckham et al., 2011). Many studies on WRF-Chem model performance, when configured with GOCART dust emission algorithms, have been published since this addition (Alizadeh Choobari et al., 2013; Bian et al., 2011; Chen et al., 2014; Dipu et al., 2013; Jish Prakash et al., 2015; Kalenderski and Stenchikov, 2016; Kalenderski et al., 2013; Kumar et al., 2014; Liu et al., 2011; Zhang et al., 2015; Zhao et al., 2010, 2011, 2013). Though these studies highlight multiple useful applications of the WRF-Chem GOCART dust model, many authors noted the need to tune the model for each location/event to obtain reasonable simulations of aerosol optical depth (AOD) or other dust parameters of interest. The character of the model shortcomings noted by prior studies indicated potential issues with the representation of dust availability (source strength), calculation of dust emissions as a function of wind speed, or both.
In 2011, researchers from the Air Force Weather Agency (AFWA), now designated the 557th Weather Wing, and Atmospheric and Environmental Research, Inc. (AER) began to investigate the WRF-Chem GOCART source code after noting multiple unexpected simulation pattern results for dust emission in southwest Asia. Closer inspection revealed issues with the dust emission scheme, which rendered the original GOCART model dust output invalid under certain environmental conditions. As a result, an alternative dust emission scheme option was developed to augment the WRF-Chem GOCART code. Several journal articles briefly discuss the use of the AER and AFWA modifications (Cremades et al., 2017; Flaounas et al., 2016; Fountoukis et al., 2016; Nabavi, 2017; Rizza et al., 2016; Su and Fung, 2015; Teixeira et al., 2016; Uzan et al., 2016; Wang et al., 2015), but full documentation of the AFWA scheme has not yet been published. The purpose of this publication is therefore to document for the broader modeling community the alternate dust emission scheme (hereafter referred to as the AFWA scheme), its intended use, and how it compares with the other available dust emission schemes included in WRF-Chem GOCART. The primary objectives of this paper are threefold: (1) to discuss potential issues in simulations using the original WRF-Chem GOCART dust emission scheme (hereafter referred to as the GOCART-WRF scheme) that motivated development of the AFWA scheme, (2) to fully describe the algorithms comprising the AFWA scheme, and (3) to document, evaluate, and discuss the differences between dust emission simulations produced using the three available WRF-Chem dust emission schemes.
To support the objectives of this paper, we provide a full documentation of the GOCART-WRF dust emission scheme, including changes that have been made to the code since Ginoux et al. (2001, 2004) that are otherwise incompletely documented in the literature. Next, we detail shortcomings with the original GOCART dust emission scheme (even as revised) and discuss how the AFWA scheme attempts to address these issues, including full documentation of the AFWA dust emission scheme. For completeness, we also discuss the third dust emission scheme currently available for WRF-Chem GOCART, commonly referred to as the University of Cologne (UoC) emission scheme (Shao, 2001, 2004; Shao et al., 2011) and how it might be expected to perform differently by comparing it with the AFWA scheme. We then present a case study WRF-Chem simulation of dust emissions from southwest Asia for a dust event that occurred during January 2010. We use this case study to illustrate the performance of the three dust options included in all releases of WRF-Chem since version 3.6.1, and follow with a discussion of the possible reasons for the discrepancies between the simulations. We conclude with a recommendation that future model development focus on improving the soil characterization datasets that form the foundation of both the AFWA and UoC schemes.
The paper is organized as follows. In Sect. 2, a brief background on the physics of dust emission is provided. In Sect. 3, the three dust emission schemes included in the WRF-Chem model are described. In Sects. 4 and 5, the model configuration and data analysis methods are described. In Sects. 6 and 7, the results of the study are presented and discussed. Conclusions are presented in Sect. 8.
Soil particles mobilize when lift, drag, and impact forces overcome the gravitational and interparticle cohesive forces holding them to the soil bed (Bagnold, 1941; Kok et al., 2012). Three processes are responsible for the entrainment of atmospheric dust particles: (1) aerodynamic lift, (2) saltation bombardment, and (3) particle disaggregation (Shao, 2008). Aerodynamic lift (1) is the process by which wind shear forces directly act upon dust particles at the surface. When lift and drag forces overcome gravitational and cohesive forces, mobilization results. Because interparticle cohesive forces on particles smaller than 60–70 µm are generally much larger than aerodynamic forces, dust-sized (∼0.1–10 µm) particles are rarely lofted directly by the wind (Chepil, 1945; Gillette and Passi, 1988; Shao, 2001). Instead, aerodynamic lift is most efficient at lofting slightly larger particles. Fine sand grains or aggregates on the order of 60 to 70 µm are the first to detach as wind speeds increase. Direct mobilization of these larger, sand-sized particles brings about dust-sized particle mobilization through the other processes – saltation bombardment and particle disaggregation. Once lofted, the larger sand-sized particles undergo saltation, a process in which mobilized particles too heavy to remain in suspension fall back upon the land surface with ballistic trajectories, after being accelerated by the airstream. The impact energy from the collisions can engage new particles into saltation, creating a positive feedback. Dust emission by saltation bombardment (2) occurs in this latter case, when the impact energy from a previously mobilized particle striking the soil surface imparts sufficient force to overcome the cohesive and gravitational forces binding particles to the surface (Alfaro et al., 1997; Gillette, 1981). Saltation bombardment is the most common mechanism for mobilization of smaller dust-sized particles because bombardment can effectively transfer wind energy to break bonds among particles too strongly cohered to mobilize by direct wind shear forcing (aerodynamic lift). Modeling saltation bombardment can be challenging because it requires correctly modeling both wind shear mobilization of larger particles and bombardment interactions between particles of differing size. The third process, particle disaggregation (3) is mechanistically similar to saltation bombardment. Again, the initial mobilization of large particles is due to wind shear forces, and emission of dust-sized particles is caused by energy dissipation during collisions. Instead of collisions mobilizing dust particles from the soil surface, however, the dust emitted is part of the saltating particle and may originate from dust coatings on solid particles or clay aggregates disintegrating during collisions (Bullard et al., 2007; Chappell et al., 2008). Saltation impacts in this case break apart the binding of mobilized soil aggregates and eject finer dust-sized particles into the air. The disaggregation process can be a significant source of aerosol particles under select soil conditions and is challenging to effectively model without a priori knowledge of soil conditions. To adequately represent dust production processes, an emission scheme must account in some way for (at least) the second and third emission mechanisms (saltation and disaggregation). Doing so requires representing the mobilization of saltating grains through wind shear (the first emission mechanism), the transfer of energy from saltating grains to dust particle ejection during collisions, and the resistance of the soil to sandblasting during these energetic collisions.
At present, there are three different dust emission schemes built into the WRF-Chem model: the original GOCART-WRF scheme (dust_opt=1), the AFWA scheme (dust_opt=3), and the University of Cologne (UoC) scheme (dust_opt=4). The dust_opt=2 setting is not applicable to GOCART and has since been disabled. As of this writing, there are 17 baseline versions of WRF-Chem available to the public (starting with version 3.2). The GOCART-WRF scheme is available in all versions, the AFWA scheme was released in version 3.4, and the UoC scheme was released in version 3.6.1. Various changes have been made to each of the dust emission schemes over time. Both the changes and the original nature of the schemes have been incompletely documented in the literature. The primary purpose of this publication is to document the AFWA scheme. However, an attempt is made to identify and highlight portions of the other schemes that are undocumented or are implemented inconsistently with existing documentation.
3.1 The GOCART-WRF dust emission scheme
3.1.1 The original, standalone GOCART dust emission scheme
The version of the dust emission scheme originally described by Ginoux et al. (2001) is referred to here as the “original” dust emission scheme, for lack of a better term in common usage. The scheme was incorporated into the standalone GOCART model, and, in later versions, embedded in WRF-Chem version 3.2. In WRF-Chem, it is called by setting dust_opt=1 in the namelist configuration file. We refer to the scheme after its incorporation into WRF-Chem as the GOCART-WRF scheme. This section refers to the GOCART dust emission scheme in general, while the next section (3.1.2) refers to the GOCART-WRF version specifically.
The original GOCART dust emission scheme is popular with the broader modeling community because it does not require difficult-to-obtain soil or surface characteristics to run (e.g., soil composition, micro- or macro-scale terrain roughness, vegetation type and spacing, and soil aggregate strength). Instead, geographic variability in substrate erodibility is fixed by a simple, topographically based, internally calculated source function. Erodible soil makeup is then fixed to a constant mix of sand, silt, and clay. Wind speed, soil moisture, air density, and generalized soil traits are the only necessary inputs for its dust emission flux calculation, and these are determined from variables readily available in most numerical weather models. This standalone nature of the original GOCART dust model has made it an attractive choice for research and operational centers in need of regional- or global-scale dust products (Barnum et al., 2004; Colarco et al., 2010; Lu et al., 2013; Peters-Lidard et al., 2015).
We first summarize the original GOCART dust emission scheme as it was documented by Ginoux et al. (2001). The original GOCART dust emission scheme calculates dust particle emissions separately for discrete bins of soil grain sizes (referred to as size bins), based on wind speed and soil moisture. Emissions are calculated using an equation modified from work originally by Tegen and Fung (1994) and with basis in Gillette and Passi (1988). The scheme is relatively simple and highly empirical as compared to other dust emission schemes since its equations represent a direct conversion from wind speed to dust emission, rather than using wind speed to calculate a saltating particle flux and then using the saltating particle flux to determine dust emissions, as the physics of dust emission by saltation bombardment discussed in Sect. 2 would motivate. The impacts of saltation bombardment processes on mobilization are not necessarily omitted – rather they are internalized in the relationship between wind speed and emissions. Physically, this simplification is akin to fixing the balance between the mechanisms of dust emission to be constant for all locations. In the original Ginoux et al. (2001) description, seven size bins, representing soil grains with effective particle diameters (Dp) of 0.1 to 6 µm (i.e., clay and small silt-sized particles) were used to represent aerosol sizes most important on a global scale. No size bins were tracked to account for mobilization of saltation particle sizes (e.g., Dp>10 µm). Emission flux values for each size bin (Fp; kg m−2 s−1) were obtained using
where C is a dimensional proportionality constant (default set to 10−6 g s2 m−5 in Ginoux et al. (2001); note that units of kg s2 m−5 in the WRF-Chem model change the value to order 10−9), S is a unitless dust source strength function indicating availability of entrainable particles, sp is the mass fraction of emittable dust from the soil separate class (i.e., sand, silt, or clay) of size group p at the soil surface, U is the horizontal wind speed at 10 m, and Ut(Dp,θs) is the threshold 10 m wind speed required for initiating erosion.
The threshold wind speed Ut(Dp,θs) is first derived for dry soil conditions based on particle diameter, Dp, and then adjusted for soil surface wetness in terms of degree of saturation, θs. In the original scheme, threshold wind speed for dry soil, Ut(Dp), was determined by
where A=6.5 is a dimensionless tuning parameter, Dp is the particle diameter, g is gravitational acceleration, and ρp, ρa are the particle and air density, respectively (Bagnold, 1941; Ginoux et al., 2001). As we will note momentarily, this realization of the Ut(Dp) function was changed prior to the incorporation of the original GOCART scheme into WRF-Chem in version 3.2. A conditional statement was used to correct the threshold wind speed for soil moisture. No erosion occurs if the soil surface wetness is above 0.5. If it is below 0.5, Ut(Dp) is corrected for soil moisture following
Curiously, this means that the value of the correction factor varies from 0 to 1.2, equaling 1 at a soil moisture content of 10 %. This effectively treats the threshold wind speed for dry soil, calculated in Eq. (3), as if it were for soil having a moisture content of 10 % and could result in adjusted threshold wind speeds that are actually below the dry soil calculated wind speed for very low soil moisture conditions.
S, the unitless dust source strength function used in the calculation of Fp in Eq. (1), was added as a stand-in for difficult-to-obtain soil surface characteristics necessary for describing availability of loose erodible soil material. S was determined based on the degree of topographic relief surrounding a model grid cell, based on the premise that dust material is often generated in alluvial processes and accumulates in low points, according to
where zi is the elevation of the cell, and zmax and zmin are the maximum and minimum elevation in the surrounding 10∘ × 10∘ area, respectively. S is set to zero anywhere bare soil is not indicated by Advanced Very High Resolution Radiometer (AVHRR) data (Defries and Townshend, 1999).
Dust mass flux values, Fp, calculated from the scheme are used to represent dust mass flux injected into the lowest atmospheric model level. Separate modules for atmospheric transport and removal from the atmosphere are used to estimate mass concentrations of dust aloft in the atmosphere.
3.1.2 The GOCART-WRF dust emission scheme and its updates
The GOCART-WRF dust emission scheme was first incorporated into WRF-Chem version 3.2. and is called by setting dust_opt=1. Although the GOCART-WRF emission scheme is based on the original GOCART scheme described in Ginoux et al. (2001), the version embedded in WRF-Chem (from version 3.2 through the current release, version 4.0.1) contains some important modifications from the original Ginoux et al. (2001) descriptions summarized above. The scheme has been updated several times since its introduction into WRF-Chem version 3.2, and these changes are incompletely documented in the literature. The most notable modification is a change in the threshold wind velocity equation for dry soil (Eq. 2), which is used after being adjusted for soil moisture (Eq. 3) in Eq. (1) to calculate particle emission flux. This change was made prior to the incorporation of the GOCART model into WRF-Chem version 3.2 and is therefore present in all versions of WRF-Chem that include the GOCART-WRF dust emission scheme. We discuss the replacement (Eq. 5) in detail starting in the next paragraph. In reviewing the source code, we also noted other changes to the GOCART-WRF dust emission scheme relative to the description in Ginoux et al. (2001), which we document for the community as follows:
-
There is a change in the number of dust emission size bins (now five) and the size range for those bins (now 0.1–20 µm) from seven bins ranging 0.1 to 6 µm described in Ginoux et al. (2001). This change was made prior to incorporation into WRF-Chem. All versions of GOCART-WRF use the five bins.
-
A precalculated source strength function S is used (stored in the code as the variable EROD), which is read in and interpolated to the model grid by the WRF-Chem preprocessor. The developers who did the initial code implementation provided static EROD values calculated using Eq. (4), a 1∘ resolution elevation dataset, and the AVHRR-based vegetation mask. This dataset was later replaced by an alternate version derived from .25∘ resolution elevation data in April 2012 (change coincided with the community release of WRF-Chem version 3.4).
-
A simplification of soil makeup is incorporated into the dust emission flux (Eq. 1). All alluvium available for lofting is assumed to have a constant distribution of 50 % sand, 25 % silt, and 25 % clay. The EROD parameter provided by the WRF-Chem preprocessor is stored as a two-layer variable, with the first layer equal to 0.5S and the second layer equal to 0.25S. Each dust size bin is assigned a indicator value (ipoint in the code) to signify whether the bin represents clay-, silt-, or sand-sized grains. Layer 1 is used to parameterize the S term in Eq. (1) for size bins that fall into the sand-sized category, and Layer 2 is used for the clay and silt categories. The effect is that the net S value never exceeds 0.50 because none of the default dust size bins represent sand-sized particles, and the sand fraction is dictated to comprise half the erodible soil mass.
-
Another change is the addition and later removal of a tuning constant which multiplies the emitted dust mass by 0.2 as it is being added to the first atmospheric model layer. This tuning constant may produce unexpected results because it does not alter the dust emission flux values output to the WRF-Chem history file, even as it substantially reduces dust entrained into the atmosphere. The tuning constant is present in versions 3.3–3.8 but is not present in versions 3.2, 3.2.1, and 3.8.1–4.0.1.
-
The dimensional proportionality constant, C, present in Eq. (1) here and referenced in Eq. (2) of Ginoux et al. (2001) (which is often treated as a tuning constant by users), is prescribed as kg s−2 m−5, slightly different from the value of kg s−2 m−5 provided in Ginoux et al. (2001).
-
Soil moisture values passed in by the WRF-Chem framework are converted from volumetric water content (θv) to degree of saturation (θs) for use in Eq. (3) via , where ϕ is the porosity of the soil medium.
-
The threshold soil moisture value used to restrict dust lofting in Eq. (3) was set to 0.2 in WRF-Chem versions 3.2–3.4.1 but later changed to 0.5, bringing the value into agreement with Ginoux et al. (2001) in versions 3.5–4.0.1.
-
The most substantive change in the GOCART-WRF dust emission scheme relative to the description in Ginoux et al. (2001), however, is a revision to how the threshold wind speed required for dust emissions is calculated. In the original scheme description, the parameter was calculated according to Eqs. (2) and (3) above. Note that, at a given soil moisture content, threshold wind velocity in this formulation is always greater for larger particle diameters, a known issue with the original GOCART dust emission scheme (Colarco et al., 2003a). Well-established experimental observations instead show particles below ∼60 µm in size exhibit higher threshold wind speeds with decreasing diameter due to the increasingly dominant influence of cohesive effects on smaller particle binding (Alfaro et al., 1998; Bagnold, 1941; Iversen and White, 1982). The modified version, which has been in GOCART-WRF since it was first incorporated into WRF-Chem version 3.2 and later, replaced this method for calculating the threshold wind speed, Ut, with an equation from Marticorena and Bergametti (1995), which was derived in terms of friction velocity, u*, instead of 10 m wind speed:
where Dp is the particle diameter in bin p, g is acceleration due to gravity, ρp is the particle density in bin p, ρa is air density, x=1.56, a=1331 cm−x, and b=0.38. Note that, in the model implementation, the coefficient 0.129 is represented as 0.0013 due to rounding and due to the fact that particle diameters are initially ingested by the scheme in units of meters for consistency with other aerosol parameters handled by the WRF-Chem framework. The rounding has no material impact on the output.
The switch to this revised scheme improved the ability of the GOCART model to reproduce the known behavior of small diameter particles – specifically by requiring higher threshold wind speeds for fine-particle mobilization. The revision, therefore, produced empirically improved results. From a physical standpoint, however, motivation for the use of the MB95 equation is strained (Colarco et al., 2003a). The MB95 equation was designed to determine the threshold for initiating wind-shear-based saltation of grains – not to represent the threshold for wind-shear-based emission of finer-grained dust particles from the surface. This, as we discussed previously, is primarily caused by saltation bombardment and particle disaggregation.
The change from Ginoux et al. (2001) to MB95 methods for deriving threshold speed also resulted in what may have been an inadvertent shift from a calculation of threshold speed in terms of standard 10 m wind speed (Ut) to one in terms of friction velocity (u*t). Although Ut and u*t are both expressed in terms of speed, values of U are typically an order of magnitude, or more, greater than their equivalent u*. The revised GOCART-WRF scheme did not incorporate equations to convert resultant u* thresholds to equivalent horizontal wind speeds, an issue noted in an earlier implementation of the GOCART model (Colarco et al., 2003a). Since both the calculation of Eq. (1) and its conditional application are dependent on the relationship between threshold speed and current wind speed, the substitution of u*t where Ut had formerly been used results in emissions not being set to zero until wind speeds are below a very low threshold magnitude speed (the threshold expressed in terms of friction velocity). The result is spurious lofting of dust at low wind speeds. The substitution of u*t where Ut had formerly been used also alters modeled emissions above the threshold speed. This occurs because the Ut(Dp,θs) parameter in the GOCART-WRF dust emission scheme, represented in Eq. (1), is effectively absent (i.e., has near zero value) for larger speeds when it is determined using a threshold in terms of friction velocity (u*), as is computed from MB95. Simulated dust emission rates using the revised scheme are then effectively proportional to the cube of the wind speed over areas with dust source regions (i.e., S>0 as defined in Eq. 2). A relationship of this character cannot match observed behavior over wide ranges in wind speed but could be tuned to match emissions under narrow sets of conditions.
Modifying Ut(Dp,θs) to convert from friction velocity to near-surface wind speed in the dust emission flux equation, however, is unlikely to fully resolve observed issues, and the process of emission can likely be better represented. The logical next step in model improvements would be to continue to use the MB95 equation, but to use it in a more physically realistic manner: to represent a saltation flux threshold. The saltation flux could then be calculated, and a second function parameterization could be used to convert between saltation flux and emissions from bombardment and/or disaggregation processes. Such a dust emission function would demand the addition of more particle size bins for handling the saltating particles since particle sizes represented in the GOCART-WRF emission scheme are only representative of emitted dust particle sizes. This is the approach taken by the AFWA scheme described in this paper.
3.2 The Air Force Weather Agency (AFWA) dust emission scheme
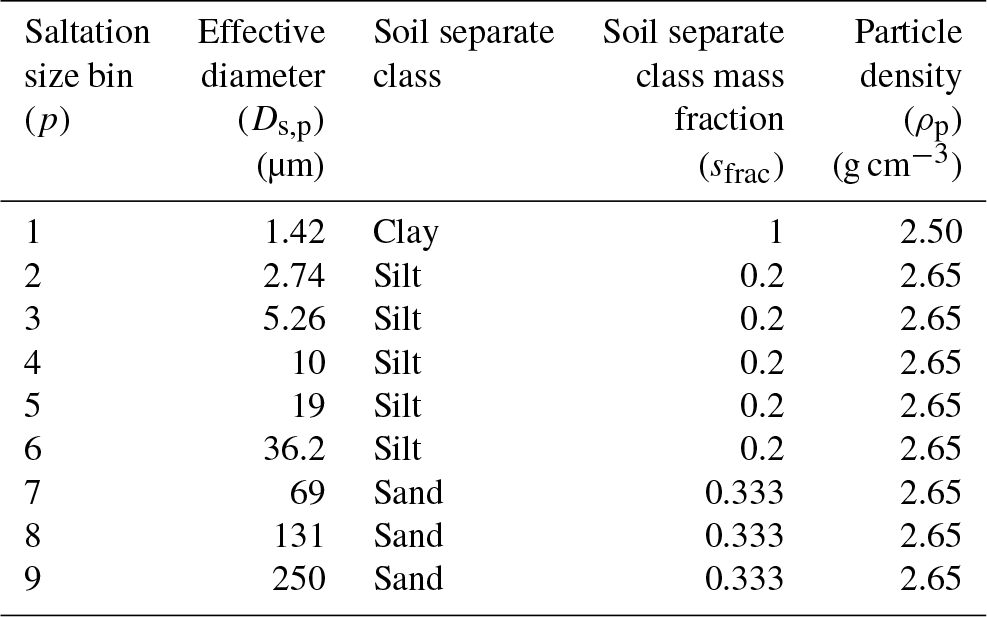
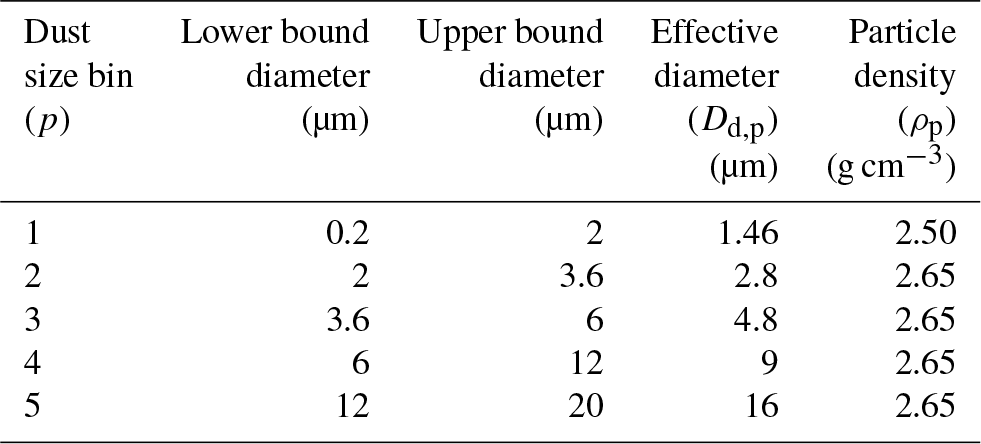
The AFWA scheme is based on a modified version of the MB95 saltation-based dust emission function. In the AFWA scheme, dust emission is handled as a two-part process, wherein large particle saltation is triggered by wind shear and leads to fine-particle emission by saltation bombardment. The equations for the AFWA scheme are derived in terms of friction velocity, u*, and include the static threshold friction velocity required for particle entrainment (u*t), the horizontal saltation flux, the resultant bulk vertical dust flux, the emitted dust particle size distribution, and the size-resolved emitted dust flux. Similar to the GOCART-WRF scheme, particles are divided into a predetermined number of bins based on their effective particle size. The AFWA scheme, however, utilizes an independent series of bins for saltation-based processes and emitted dust, allowing dust emission by saltation bombardment and particle disaggregation to be better represented (and saving the resources that would have been required to compute advection of saltation particles, which are generally too large for significant long-distance advection). Attributes associated with the nine saltation size bins and five dust size bins in WRF-Chem version 3.8.1 are given in Tables 1 and 2, respectively. Dust particle densities and effective diameters are consistent with those used in the GOCART-WRF configuration. We maintain the assumption that all clay soil particles have a density of 2.5 g cm−3 and that all non-clay soil particles have a density of 2.65 g cm−3, the particle density of quartz. Lastly, the effective diameters used in the following equations are assumed to be in units of centimeters and are denoted as Ds,p and Dd,p for the saltation and dust size bins, respectively.
Table 1Saltation particle size bins and their associated attributes. Particle sizes are presented here in µm but handled in units of centimeters within the model.
Saltation processes for a given size bin initiate and cease during the simulation as u* exceeds or falls below sized-resolved values of u*t, respectively. Semi-empirical values for u*t (in units of cm s−1) are calculated according to the expression of MB95, which is identical to the equation used in the GOCART-WRF scheme (Eq. 5) and repeated here for readers' convenience:
where g is acceleration due to gravity, ρs,p is the particle density of the saltation size bin s, ρa is air density, x=1.56, a=1331 cm−x, and b=0.38. We note that this is exactly the same equation that is used in the revised version of the GOCART-WRF scheme above, only here it is used to produce values that will be treated as friction velocities, as intended. As before, note that, in the model implementation, the coefficient 0.129 is represented as 0.0013, due to rounding and particle diameter unit conversion from meters to centimeters. Similar to the GOCART-WRF scheme, a correction function, f(θ), is applied to the threshold friction velocity to account for the effects of soil moisture on particle cohesion. The equation used for the AFWA scheme is different from that used in the GOCART-WRF scheme and was originally described by Fécan et al. (1999):
where
θg is the gravimetric soil moisture fraction, and is the fraction of soil moisture able to be absorbed before capillary forces begin to markedly influence particle detachment. As per Fécan et al. (1999), we assume
where cs is the soil clay content mass fraction determined from soil particle size information for the surface layer of soil (0–30 cm), originally derived from the global Food and Agriculture Organization digital Soil Map of the World (FAO-SMW) by Reynolds et al. (2000), available at the NASA Land Data Assimilation System (LDAS; https://ldas.gsfc.nasa.gov/gldas/GLDASsoils.php; last access: June 2017). The original 5 min grid of this data product is interpolated to a 1 km grid for use in this application.
Table 2Dust particle size bins and their associated attributes, presented here in µm but handled in units of centimeters within the model.
In order to provide the gravimetric water content (θg) terms demanded in Eqs. (6)–(8), volumetric water content (θv) soil moisture values provided by WRF-Chem are converted through the following relationship:
where ρw is water density equal to 1.0 g cm−3, ϕ is the porosity of the soil medium, and the 2.65−0.15cs term represents the soil density.
Once time-varying u*t,s,p values are known, the momentum transfer effects of wind shear and saltating grain impact shear on simulated dust emission are accounted for across varying wind speeds greater than the threshold speed via a horizontal saltation flux equation. The saltation flux is then used to calculate dust emission. First, particle-size-dependent saltation fluxes (H(Ds,p); g cm−1 s−1) are calculated following Kawamura (1951) by
where Cmb is an empirical proportionality constant set to 1.0. Note that the original MB95 study utilized a proportionality constant of 2.61 in accordance with findings by White (1979). In the WRF-Chem implementation, we have adopted Cmb of 1.0 as suggested by Marticorena et al. (1997) and Darmenova et al. (2009) based on more extensive wind tunnel measurements. The H(Ds,p) values are then integrated over particle sizes to obtain the total streamwise horizontal saltation flux (G).
Estimated contributions of each saltation size bin to total saltation flux (G) depend upon the surficial coverage of particles in each saltation particle size bin as a fraction of the total surface area of the soil bed. As with common land surface modeling practices (Mitchell, 2005; W. Wang et al., 2017), the AFWA scheme assumes that all particles comprising the soil column belong to one of three US Department of Agriculture (USDA) defined soil separate categories based on particle size: sand (50 to 2000 µm), silt (2 to 50 µm), or clay (≤2 µm). Instead of the fixed soil separate fractions used in the GOCART-WRF scheme, the makeup of soil in the AFWA scheme is set using the soil particle size information for the surface layer of soil (0–30 cm) originally derived from the global FAO-SMW soil dataset by Reynolds et al. (2000). Again, the original 5 min grid of this data product is interpolated to a 1 km grid for use in this application. Starting from mass fractions in the sand, silt, and clay soil categories, we diagnose relative weighting factors for each size bin (dSrel(Ds,p)). The mass fractions are further distributed amongst the saltation size bins following the approach of Tegen and Fung (1994). Linear mass distributions are assumed for the sand and silt categories, while a log-normal mass distribution is assumed for clay. Size-resolved basal surface coverage fractions (dSSFC(Ds,p)) are then diagnosed from the mass distribution of particles in the surface soil (dM(Ds,p)) as follows:
Bin-specific values of dM(Ds,p) are set by multiplying the bin-specific mass fraction of a size bin's corresponding soil separate class (sfrac; Table 1) by the mass fraction of the matching soil separate category at each domain grid point.
Saltation bin-specific weighting factors are then found by taking the ratio of dSSFC(Ds,p) to the total basal surface area of the soil bed (NSFC):
where
The total streamwise horizontal saltation flux is then computed via
To estimate the bulk emission flux of dust (FB; g cm−2 s−1) triggered by saltation, the AFWA scheme utilizes both the dust source strength parameterization (S; EROD in the code) from the GOCART-WRF function (Eq. 4) and a reformatted version of the sandblasting efficiency approach from MB95. Because the source strength function provided by the WRF-Chem preprocessor is stored as a two-layered variable (a simplification specific to GOCART-WRF), the source strength term is set in the AFWA scheme simply by multiplying the second layer of the EROD parameter (equal to 0.25S) by 4, resulting in a source term varying from 0 to 1. An aerodynamic roughness length (z0) conditional is also applied to limit dust emission to regions defined by the parent WRF-Chem model as grassland, sparsely vegetated, or barren.
where the sandblasting efficiency (β) is given by and has units of cm−1. As before, cs is the soil clay content mass fraction determined from the FAO-SMW data. We note that the impact of the soil in the scheme is small, since the factor β varies from only to cm−1 over clay fraction of 0–0.2, and that this may underrepresent the importance of the soil type. Even considering the full theoretical range of clay fraction of 0–1, which is rare over large domains in practice, the factor β only ranges from to cm−1.
Once total dust emission (FB) is determined, emissions are distributed amongst suspended dust size bins using the Kok (2011) brittle fragmentation theory. Following the Kok (2011) technique, we assume impacted soil aggregates will fracture in a manner similar to glass or gypsum material. Suspended dust distribution weighting factors (κd,p) are diagnosed by taking the ratio of the normalized volume distributions of each dust size bin (dVd,p) to the total normalized volume distribution of emitted dust (NV):
where
is the dust particle mass median diameter equal to cm, σs is the geometric standard deviation equal to 3.0, cv is a normalization constant equal to cm, λ is the crack propagation length equal to , erf is the error function, and Dd,p_max and Dd,p_min are the maximum and minimum effective diameters represented by the dust size bin, respectively. Resultant values for Eq. (15) are currently prescribed in the AFWA scheme since not all Fortran compilers are able to process the error function. The code, however, is still present (commented out) should a user wish to change the default dust size bin ranges. Finally, size-resolved dust emission fluxes (Fd,p; g cm−2 s−1) are obtained according to
As with the GOCART-WRF scheme, the emitted dust particles are released into the lowest atmospheric model level for dispersion according to their respective size bins.
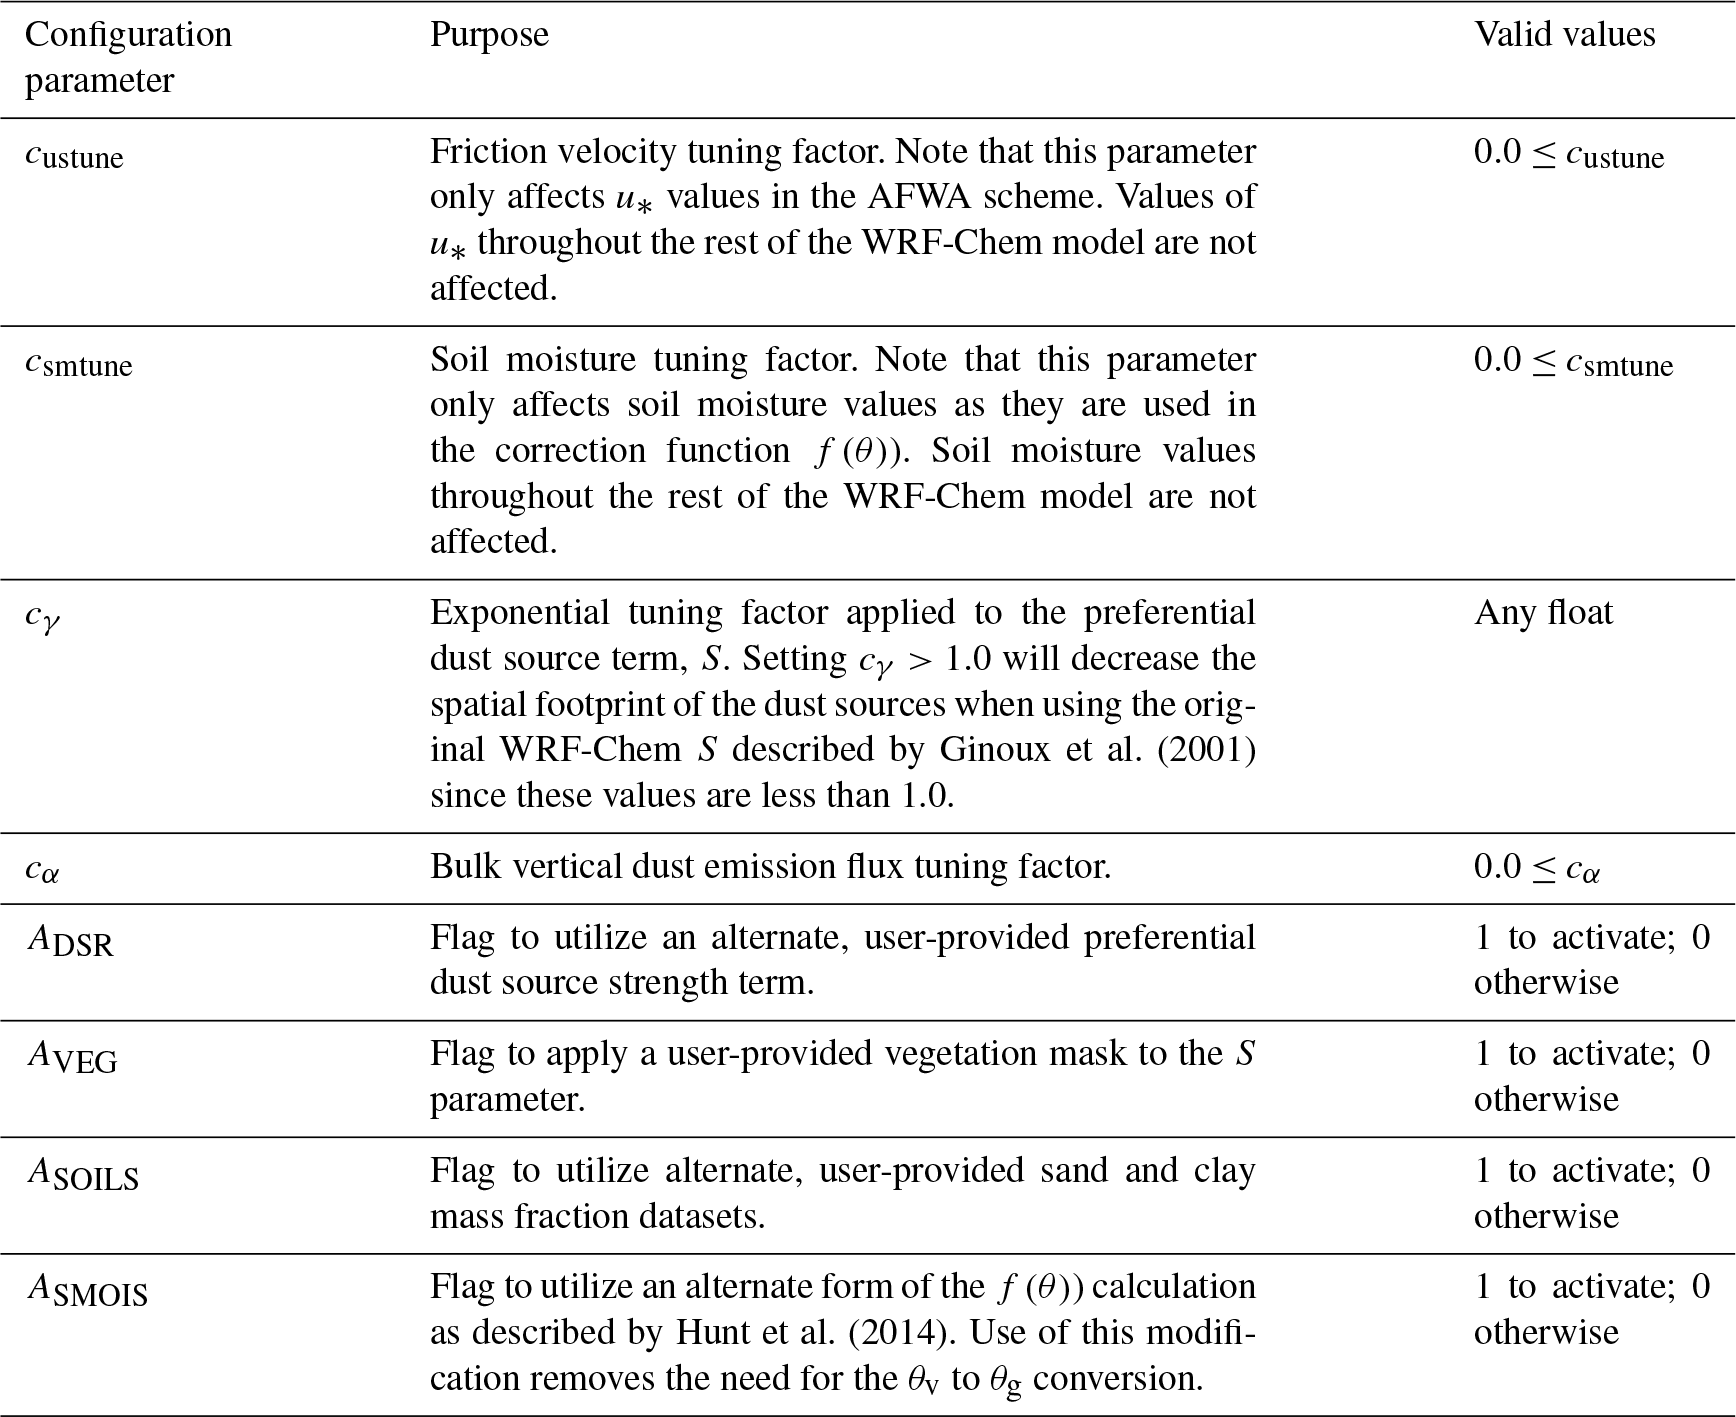
Four optional tuning parameters, three alternate input dataset channels, and an optional modification to the f(θ) calculation have been added to the AFWA scheme since its original debut in the WRF-Chem baseline. Table 3 provides a brief overview of these additions, which can be set or activated through the WRF-Chem runtime configuration file (referred to as the namelist.input file in the WRF-Chem framework), if desired. It should be noted, however, that the developers primarily added these options to facilitate perturbations when using the scheme in a multi-model ensemble mode. Rigorous testing for optimal tuning recommendations are beyond the scope of this paper, and the case study demonstrations provided in this report do not make use of these optional settings (i.e., all optional tuning parameters are set to 1.0). Figure 1 presents a schematic summary overview of the AFWA scheme, including the five major components, their required input parameters, and the configurable runtime options.
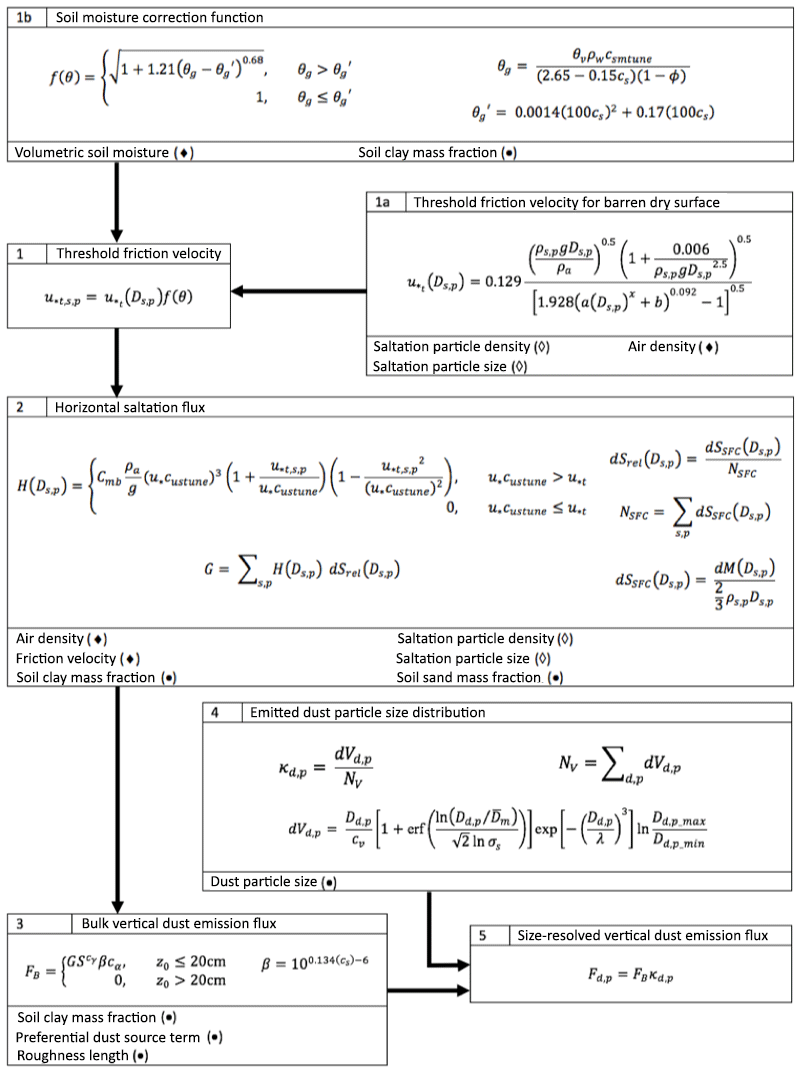
Figure 1Schematic diagram of AFWA dust emission scheme and required inputs. The black diamond marker indicates that the parameter varies spatially and temporally. The black circle marker indicates that the parameter varies spatially, and the hollow diamond marker indicates the term is related to a particle size bin. See comprehensive variable list in Appendix B for variable definitions.
Table 3Optional tuning parameters and binary configuration flags (A).
An error in the number and distribution of saltation size bins was made during the implementation of the AFWA scheme code into the WRF-Chem baseline. Current and legacy versions of the AFWA scheme (WRF-Chem versions 3.4–4.0.1) assume nine saltation size bins (Table 1), including one clay-, five silt-, and three sand-sized bins. Bins 7–9 are sand-sized bins with effective diameters of 69, 131, and 250 µm, respectively. These same bins are also configured so their combined mass fraction constitutes 100 % of the possible sand mass fraction distribution. This particular setting implies the sand portion of the soil surface is entirely composed of fine sands and increases the strength of the saltation bin-specific weighting factors (Eq. 11) for these bins. Alternate saltation bin configurations that better align with mass distributions recommended by Tegen and Fung (1994) are discussed in Appendix A.
3.3 The University of Cologne (UoC) dust emission scheme
WRF-Chem's third standard dust emission scheme, commonly referred to as the University of Cologne (UoC) scheme, is activated by using dust_opt=4 in the WRF-Chem namelist. The UoC model is documented in Shao (2001) and later papers by the same author (Shao, 2004; Shao et al., 2011) that describe sub-option sets of varying complexity. These sub-options are activated by setting the value of the variable dust_schme in the namelist.input file. We will note these sub-options and the references describing them here as S01, S04, and S11, respectively, in order from the most complex to most simplified representation of dust emission processes. Here, we describe key aspects of the implementation of the UoC scheme and make comparisons with the AFWA scheme. The comparison primes us for understanding the differences between the simulation outputs discussed in Sects. 4–6.
The UoC scheme follows the same general approach as the AFWA scheme. Both schemes simulate dust emission by first calculating a threshold friction velocity for particle saltation, then using that threshold friction velocity to determine saltation flux, and finally calculating emissions of dust particles caused by saltation processes (e.g., bombardment), capturing the general process of dust emission more fully than the GOCART-WRF scheme. Both schemes also use the same size-resolved dust emission bins to pass emitted dust fluxes to the WRF-Chem transport routines. The more sophisticated UoC sub-options also use size-resolved saltation particle bins to evaluate dust emission from saltating particles of different sizes.
The calculation of the threshold friction velocity for initiation of particle saltation used by the UoC scheme is physically based and of significantly different form, compared to the semi-empirical MB95 function used in the AFWA scheme but has similar output in terms of calculated threshold friction velocity (u*t) under a given set of forcing conditions. Equations (5) and (17) serve this equivalent function for the AFWA and UoC schemes, respectively, with
in the UoC scheme, where σp is the ratio of particle to air density, g is the gravitational constant, d is particle diameter, ρp is the particle density, and kg s−2 are constant. Equation (17) here is replicated from Eq. (24) in Shao and Lu (2000), as referenced by S01 and S11. As we will note in documenting code discrepancies below, γc is set to kg s−2 in the code (a value of γc also adopted by Darmenova et al., 2009; Park et al., 2007; Zhao et al., 2006), while it is specified as kg s−2 in Shao and Lu (2000). Note that here d is particle diameter, as opposed to Dp above. We have chosen to make this change to preserve the variable name choices in the UoC papers (S01, S04, S11) here while discussing the UoC scheme, which results in some factors being represented by two variables within this paper. Please see the variable list in Appendix B for a complete listing of variable names, as well as the schemes and equations in which they apply.
After establishing the dry soil threshold friction velocity (u*t(d)), all versions of the UoC scheme correct for the influence of soil moisture on threshold friction velocity using the approach described in Fécan et al. (1999). This soil moisture correction is similar to the approach taken in the AFWA scheme (see Eqs. 6–9). Unlike the AFWA approach, however, the UoC scheme maintains soil moisture in terms of the volumetric soil moisture (θv) and varies the empirical constants of Eq. (7) as a function of soil texture following the method described in Klose et al. (2014). In the UoC scheme, an additional correction factor, titled the roughness correction (also commonly referred to as the drag partition correction), is applied to the threshold friction velocity to account for terrain attributes that absorb wind momentum or shelter exposed soils. This factor is calculated as a function of grid-cell vegetation fraction based on Raupach (1992) as
where xf is the frontal area index, calculated from the vegetation fraction (cf) as
Vegetation fraction (cf) is set using the greenfract variable from the parent WRF-Chem model, which, as of this writing, is determined from the MODIS fraction of photosynthetically active radiation (FPAR) absorbed by green vegetation monthly climatological values in the default WRF-Chem configuration. This correction factor has a substantial impact on the threshold friction velocity. For example, a vegetation fraction of 0.2 (20 % vegetation coverage) results in a near tripling of the threshold friction velocity. We will see in our results that this correction factor is a leading cause of differences in dust emission between the AFWA and UoC schemes.
Once the corrected threshold friction velocity () is determined, the calculation of saltation fluxes for each particle size bin, based on wind speed, is very similar in the UoC and AFWA schemes, though UoC uses more size bins (100 vs. 9 as AFWA is currently implemented). The UoC scheme uses a saltation flux equation that is very similar to the one used in the AFWA scheme (Eq. 10), with minor adjustments. This is presented here as Eq. (20) (S11, Eq. 19):
Note that, until the release of WRF-Chem version 4.0, there was an error in the implementation of this equation (discussed in Sect. 3.3.2).
The two differences in comparison with the AFWA scheme are (1) an adjustment for vegetated fraction of the surface (1−cf) and (2) the factor of 2.3, which replaces the empirical proportionality constant in the AFWA scheme (Cmb). In the AFWA scheme, this constant is set to 1.0 as suggested by Marticorena et al. (1997) and Darmenova et al. (2009). The UoC value of 2.3 is closer to the value used in the original MB95 approach of 2.61 in accordance with findings by White (1979). The remainder of the equation, documented in S11, is identical to that used in the AFWA scheme. We note below, in Sect. 3.3.2, however, that the implementation of this equation and the vegetation correction factor (1−cf) in some versions of the code is not exactly the same as documented in the S11 paper, resulting in an important difference in model behavior between AFWA and UoC.
In all UoC sub-options, just as in the AFWA scheme, the saltating particle load in each size bin is also dependent on the fraction of the parent soil consisting of particles in that size bin, and on the source strength function. Source strength is again handled using the dust source strength parameterization (stored as variable EROD) from the original GOCART function (Eq. 4). Here, however, source strength is treated as a binary. The binary source function is denoted (Sb) and set to 1 anywhere source strength is greater than 0. The parent soil particle size distribution is incorporated by multiplying the uncorrected (i.e., theoretical wind-based, not source-limited) saltation flux for each bin q(d) by a term representing the availability of saltation particles. The resulting saltation flux equation is
where the calculation of the particle availability term ps(d) treats free soil particles and particles contained in aggregates as separate categories. This is in contrast to the AFWA scheme, which handles all soil particles according to a single fundamental particle size distribution (see Eqs. 11 and 12). Saltation in each bin in AFWA is also affected by the relative surficial area coverage of each particle class rather than the bulk particle fraction. The term capturing the probability density function for airborne sediment particle size distribution is calculated according to Eq. (22) (equivalent to Eq. 8 in S11):
where pm(d) and pf(d) represent the minimally and fully disturbed particle size distribution (specifically, the array of the particle size fractions represented by diameter d), and where γ is a function describing how easily released aggregated particles are. The values of pm(d) and pf(d) are set based on soil maps, as described below. In the S01 and S04 sub-options, the value for γ is calculated based on an assumption that higher wind speeds can better break up aggregates (Alfaro et al., 1997) according to
where k1 is a constant equal to 1, u* is the friction velocity, and u*t(d) is the threshold friction velocity from Eq. (17) with the corrections for soil moisture and roughness applied. Equation (23) here is replicated from Eq. (7) of S04 and Eq. (17) of S01. Field observations presented in S11 suggested the impact of wind speed on the released dust particle size is not significant, and so the S11 sub-option sets the value of γ to 1, simplifying the dust emission calculation. The S11 paper does not, however, address whether this simplification applies also in the calculation of size-resolved saltation flux. In the S11 code, γ is calculated as in Eq. (23) for all UoC sub-options, such that γ factor is the same as the S01 and S04 sub-options in calculation of saltation flux.
Once the saltation fluxes are calculated, the next major step in the scheme is calculating dust emission flux from the saltation flux, (Q(ds)). This step is comparable in function to the much simpler Eq. (14) in the AFWA scheme. The more sophisticated UoC scheme predicts dust emission in each dust size category caused by saltating particles in each saltation size category (see Eq. 52 in S01 and Eq. 6 in S04), as opposed to calculating a single bulk dust emission mass from the effects of all saltating particle classes and then apportioning this bulk emission into dust size bins with a fixed particle size distribution. Particle size distributions of both the parent soil dust and saltation particles are considered, and this calculation is where the S01, S04, and S11 sub-options differ most. Here, we briefly present each sub-option approach.
S01 derives and uses the most complex form of the process, described as Eq. (52) in S01. The parameterization includes effects of soil particle aggregation, parent soil particle size distribution, saltating particle size distribution, and soil plastic pressure, among other soil attributes.
where cy=0.00001 is a dimensionless constant, γ is evaluated as in Eq. (21), ηf,i and ηm,i are, respectively, the fully and minimally disturbed dust fraction in bin di, ρb=1000 kg m−3 is the assumed bulk density of the soil, ηc,i is the fraction of soil available for disaggregation (), , m= mass of the particle, and g is the gravitational constant in m s−2. The term Ω represents the efficiency of dust emission from bombardments or collisions and is implemented in the scheme after Lu and Shao (1999) as
where Up is the impact velocity, , ϱ is soil plastic pressure, αi is the incidence angle of the collisions, m is the particle mass, and d is the particle diameter.
S04 simplifies the scheme for estimating the dust emission from saltation collisions by fixing several of the free variables in Eq. (25) which were not readily available in measurements, including setting the collision angle to 15∘, setting , and setting the particle density to 2.6 times the soil bulk density. This allows a revised form of the equation for bombardment efficiency to be derived which is particle size independent:
where u* is the friction velocity, ρb=1000 kg m−3 is bulk soil density, and ϱ=30 000 N m−2 is the soil plastic pressure. We note, in particular, the very strong role that soil plastic pressure plays in the emission through this term, and further note that the value for soil plastic pressure is set to a constant in the WRF-Chem implementation, despite being a parameter well known to be subject to variations with soil type. Incorporating σm into the dust emission flux equation and simplifying results in Eq. (27); the revised flux equation used by S04 (S04, Eq. 6) is
S11 further simplifies the scheme by calculating dust emission based on a single integrated saltation flux, rather than based on fluxes of saltating particles in each individual saltation bin (and setting γ=1 as noted above in the discussion of Eq. 21). Dust emission is then calculated for each dust size bin according to Eq. (28) (S11, Eq. 34):
where cy=0.00001 is a dimensionless coefficient, ηm,i is the fraction of dust in size bin i that is free in minimally disturbed soil, σm is the bombardment efficiency, g is the gravitational constant, Qtotal is the saltation flux, and u* is the friction velocity. Total saltation flux Qtotal is calculated by integrating across all particle size bins using Eq. (29) (S11, Eq. 20):
This S11 approach is similar to the AFWA scheme, which integrates saltation flux across all saltation particle size bins (Eq. 13) and calculates a total dust emission from a total integrated saltation flux (Eq. 14). The two approaches differ in that the AFWA scheme sums the mass of all dust fluxes and then apportions the dust into size fractions based on a breaking function (Eq. 15). The simplified S11 sub-option, however, allows the dust particle size distribution to be based on parent soil type (Eq. 28).
In S01 and S04, the size-resolved dust emission is calculated by integrating dust emissions of each dust bin over all saltation bins. During this step, an additional factor of 1−cf is applied:
This factor does not appear in the papers that document these schemes (S01, S04, S11) and may be in error; however, since the correction effectively reduces the surface area from which both sand particles and dust particles can be emitted, application of the correction twice (i.e., once for saltation and once for dust emission) may be physically valid.
The S11 sub-option yields size-resolved dust emission F(j) directly, but the factor of 1−cf is also applied before emissions are reported to atmospheric process modules in WRF-Chem:
In all UoC schemes, the total dust emission, Ftotal, is calculated by integrating over all emissions bins:
3.3.1 Impact of soil data on the UoC scheme
The effect of the more sophisticated approach in the UoC scheme is to make both the saltating and emitted dust particle size distributions sensitive to parent soil particle size distribution in S01 and S04 and to make the emitted dust particle size distribution sensitive to parent soil particle size distribution in S11. The approach makes the UoC scheme the most physically based of the WRF-Chem dust emission schemes. Input data limitations restrict the benefit of these sophisticated options, however. Measurements of these soil characteristics are generally unavailable, particularly over mesoscale domains (on the order of 10 km grid spacing), an issue noted in the Shao publications. For example, the degree of soil aggregation, used in the UoC scheme as the fully disturbed and minimally disturbed soil particle size distribution, is not widely measured or widely available in soil databases, nor is the soil plastic pressure. Within WRF-Chem, the soil plastic pressure is simply set to a constant and must be tuned to match local soil conditions. The particle size distributions are derived based on a conversion between the soil particle size information for the surface layer of soil (0–30 cm) originally derived from the FAO-SMW soil dataset by Reynolds et al. (2000) and a series of 12 soil texture classes described in S04. As per the AFWA scheme approach, the original 5 min grid of the FAO-SMW map is interpolated to a 1 km grid for use in this application. The soil type indicated in the FAO-SMW map is converted to its fully disturbed and minimally disturbed particle size distributions by compositing the soil classes, each containing log-normal particle distributions with differing coefficients (e.g., see S01, Eq. 54; S04, Eq. 15; and S11, Eq. 21). We note that the number and character of the soil classes being composited varies in the Shao publications from 3 (S01, Table 2) to 12 (S04, Table 1) to 4 (S11, Table 2). All three UoC sub-options, however, are implemented using 12 soil texture classes.
Dependence on the other key soil parameter, soil plastic pressure, controls the mass ejected during bombardment collisions. In the Shao papers, test cases are run to determine the best fit for the soil plastic strength based on observational dust emission data, along with a dimensionless tuning coefficient, cy. Data presented in S04 indicate that soil plastic pressure varies over roughly 2 orders of magnitude from 500 to 50 000 Pa for sandy to clay-rich soils, respectively (see S04, Table 3). Similarly, the tuning constant cy is found to vary from to (it is set to by default in the model). A serious limitation in terms of running the UoC scheme at mesoscale is that the value of the soil plastic pressure is set to a single value domain-wide and does not vary with soil type. Given that the value varies so widely over various soil types, mismatch in part of the domain is likely. The default for this value in WRF-Chem versions 3.6.1–4.0.1 is set to 30 000 Pa, appropriate for clay-rich soils according to S04.
3.3.2 Differences between UoC literature documentation and code
Similar to the GOCART-WRF scheme, we note that there are several discrepancies between the code realization in WRF-Chem and the documentation published in the literature in S01, S04, and S11. Again, we document these here for the benefit of the community:
-
The equation used to calculate the saltation flux Q implemented in the WRF-Chem versions 3.6.1–3.9.1 was subtly, but significantly, different from the equation documented in S11, Eq. (19). This error was identified in early 2018 and corrected in WRF-Chem versions 4.0 (disseminated in June 2018) and newer. Specifically, the equation provided in S11 computes the saltation flux for each saltation particle size bin, qi, as
where cf is the vegetation fraction, g is gravity, u* is the friction velocity, and ρa is air density. We noted above that the form of this equation is nearly identical to the equation used in the AFWA scheme (Eq. 10), with both ultimately derived from work by Kawamura (1951). Notably, the implementation in all UoC code versions implemented in WRF-Chem prior to version 4.0 treats the final term as
Changing the order of operations from how it is documented in S11,
Given reasonable friction velocities, the effect could change the saltation flux by a factor of 2 or more, resulting in substantial impacts on output.
-
The equation used to calculate the threshold friction velocity for particles in each saltation bin size, u*t(ds), is referenced as originating from Eq. (21) in Shao and Lu (2000) by S01 and S11. The equation given in Shao and Lu (2000) is
where AN=0.0123, σp= the ratio of particle to air density, g is the gravitational constant, d is particle diameter, and ρp is the particle density. The coefficient γc is set to kg s−2 in the code, while it is specified as kg s−2 in Shao and Lu (2000). Our mention of this discrepancy, however, is only to bring awareness to the model user. As discussed by Darmenova et al. (2009), γc can be thought of as a tuning parameter for adjusting the onset and magnitude of modeled dust emission.
-
The implementation of the code appears to include the vegetation coverage correction factor, 1−cf, used twice in the saltation flux calculation above (in addition to the use of this term in calculating the surface roughness correction factor). The first time it is included is directly in the calculation of the saltation flux, which is carried out using Eq. (20). The factor is again applied during the integration of the dust emissions across the dust and saltation size bins (Eqs. 30 and 31). This discrepancy between the code and literature, however, does not necessarily imply the WRF-Chem implementation is physically invalid since the presence of vegetation can affect both saltation and dust emission processes.
-
The documentation for the earlier UoC models (S01 and S04) indicates they use different equations for calculating saltation flux based on current wind speed and threshold velocity than those used in S11. These equations are of similar form and would produce similar saltation flux output to what would be produced by the equation described in S11 (see S01, Eq. 23, which is derived from Owen, 1964). We find no evidence, however, that these separate means of calculating saltation flux are actually implemented in the S01 and S04 sub-options of the model code. It appears that all three sub-options are currently using the saltation flux presented in Eq. (20) and described above.
-
We note that the number and character of the soil classes being composited to determine the free dust fraction at particle sizes vary in the Shao publications from 3 (S01, Table 2) to 12 (S04, Table 1) to 4 (S11, Table 2). As implemented in the WRF-Chem model, the 12 soil texture classes of S04 are applied to all three UoC sub-options.
-
We also note a change in the number of dust size bins used to pass emitted dust from the UoC scheme to the WRF-Chem transport routines between versions. Four size bins with diameter ranges of <2.5, 2.5–5, 5–10, and 10–20 µm are used in versions 3.6.1–3.7.1. These size bins were reconfigured to match the five bins used in the GOCART-WRF and AFWA schemes (0.2–2, 2–3.6, 3.6–6, 6–12, 12–20 µm), starting with version 3.8.
3.4 Synopsis of key differences between UoC and AFWA schemes
-
The original derivation of the UoC model handled saltation bombardment and aggregate disintegration mechanisms separately (see derivation of Eq. 52 in S01, Sect. 5), as opposed to handling all dust emission in a single bombardment-like process as is done in the AFWA scheme.
-
The UoC scheme for calculating dust emission flux from saltation flux (e.g., captured by Eq. 52 in S01, Eqs. 6, 7, and 11 in S04, and Eqs. 11 and 34 in S11) depends on relatively sophisticated knowledge of the parent soil, including the soil particle size distribution (the only term which the AFWA scheme also depends on), measures of the degree of soil disturbance (e.g., captured in σp, as defined by S04), and the soil bonding, presented as the soil plastic pressure, which controls the mass ejection caused by saltation bombardment (e.g., captured in Ω in S01 and in σm in S04 and S11). The degree of this dependence on sophisticated soil properties decreases in the more simplified S04 and S11 sub-options. For example, part of the dependence of aggregate breakdown on wind speed is removed in the S11 simplification based on field observations that indicated no wind speed dependence. The dependence of emission on soil plastic pressure and on the free soil particle size distribution, however, is common to all three sub-options, and the values of these parameters have substantial influence over model output.
-
The UoC scheme incorporates a correction factor in the calculation of saltation flux for soil vegetation coverage. This factor has modest impacts on results, and our test case indicates its utility may suffer from low-quality input data.
-
The UoC scheme incorporates a second correction factor in the calculation of threshold friction velocity for non-erodible roughness elements (i.e., a drag partition correction), which is determined from the vegetation coverage layer.
4.1 Model and domain setup
We use WRF-Chem version 3.8.1 (Fast et al., 2006; Grell et al., 2005; Skamarock et al., 2008) to simulate the emission and transport of dust in our test cases with each of the three default dust emission schemes. The model domain for this test is bounded by corner points at approximately SW (7.9∘ N, 16.5∘ E), NW (51.8∘ N, 11.6∘ W), SE (10.0∘ N, 62.4∘ W), and NE (56.8∘ N, 85.2∘ E), is configured with 484×417 grid points on a horizontal grid spacing of 12 km, and is shown in Fig. 2. The vertical grid contained 48 levels and followed a stretched sigma coordinate that favored higher vertical resolution near the surface. Initial and lateral boundary conditions were forced using the Global Forecast System Final Analysis (GFS-FNL) 6-hourly, 1∘ resolution reanalysis product (NOAA/NCEP, 2000). The simulation was performed over the 5-day period between 22 January 2010 and 27 January 2010, but the first 36 h of the simulation were disregarded as spin-up to allow the model to adjust to the initial and lateral boundary conditions.
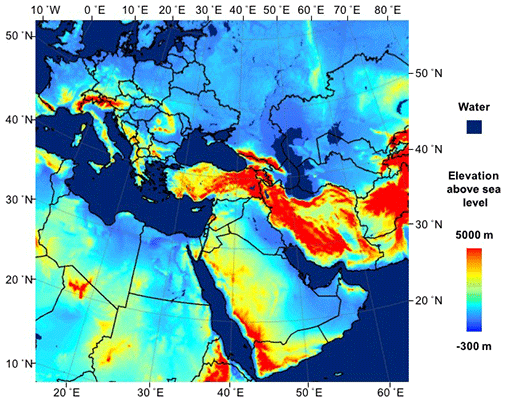
Figure 2Domain map for the WRF-Chem simulations with color shading showing the waterbodies and elevation as indicated by the color bar. The region of dust emissions we focus on is just right of center in the Syrian Desert on both sides of the Iraq–Syria border.
Atmospheric dust was initialized using a “cold start” approach (i.e., the dust concentration in the atmosphere was initialized as zero everywhere). The model background chemistry for other aerosol species was generated using the GOCART simple option in WRF-Chem. Background sea salt emissions were based on the lowest model level wind speeds over the oceans (Gong, 2003), and the other background non-dust aerosol emissions within the domain were set using the PREP-CHEM-SRC preprocessing software (Freitas et al., 2011) using the GOCART climatological emission datasets. No aerosols were transported into the domain across the lateral boundaries during the simulations – a reasonable approximation given that we were primarily concerned with large localized dust emission events far from the domain boundaries. Importantly, the aerosol radiative feedbacks were turned off. Therefore, modeled aerosol concentrations had no impact on the model meteorology, ensuring a simple comparison of dust emission schemes under identical forcing. A full description of the model configuration, including scheme settings for chemistry and physics, is presented in Table 4.
(Kain, 2004)(Tewari et al., 2004)(Beljaars, 1994)(Nakanishi and Niino, 2006)(Iacono et al., 2008)(Thompson et al., 2008)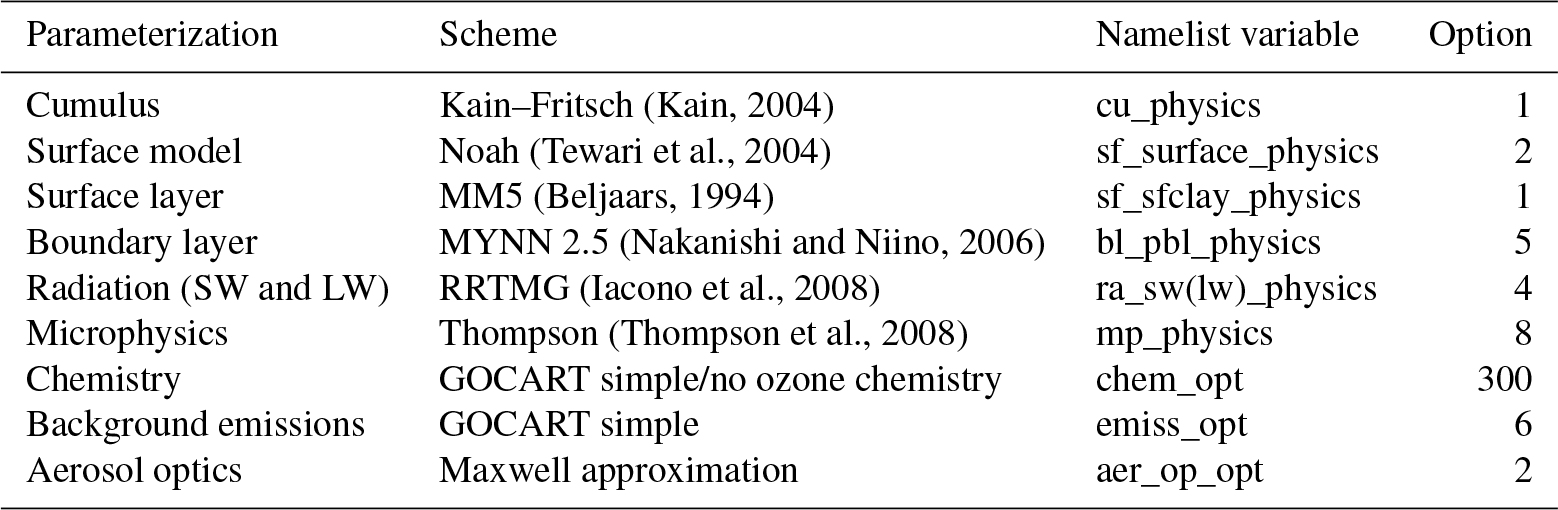
Three schemes for deriving dust emissions in WRF-Chem (GOCART-WRF, AFWA, and UoC – discussed separately in Sect. 3) are tested, and we compare the results below. All three dust emission schemes tested were run in the “default” configuration supplied with WRF-Chem version 3.8.1 release to permit the most straightforward comparison, with all constants set as supplied in the code release and described above in documentation for each scheme. For the purposes of this paper, we chose to make comparisons to the moderately simplified version of the UoC scheme described in S04.
For intercomparison of model results with remote sensing data, simulated atmospheric extinction coefficients are calculated for the 550 nm wavelength using the WRF-Chem optics routines (Barnard et al., 2010). Simulated AOD is then calculated by vertically summing the extinction coefficient throughout the atmospheric column:
where k is the model vertical level, μ550 is the extinction coefficient at 550 nm, and Δz is the physical depth of each vertical level.
Integrated column AOD is sampled from the model for comparison with satellite remote sensing observations collected from the Cloud-Aerosol Lidar with Orthogonal Polarization (CALIOP) instrument at the grid point nearest to observational geographic coordinates (lat/long). For comparison with CALIOP data, coordinates used represent the midpoint of the 15 along-track samples that are averaged to produce a single AOD estimate. Since samples are collected every 333 m by CALIOP, actual observations extend 2.5 km from the midpoint in each direction along track.
4.2 Description of selected test event
The test event selected for our emission scheme intercomparison was a dust storm in southwest Asia forced by a large-scale synoptic event. We chose this location because we expect that the conditions the AFWA scheme was created for frequently prevail there. Specifically, spurious dust lofting under light wind conditions has been noted in this region in WRF-Chem runs with the GOCART-WRF dust emission scheme activated, as discussed in Sect. 3.1. The atmospheric dust plumes observed by MODIS AOD satellite remote sensing during this event appeared to originate in western Iraq and Syria, qualitatively indicating a large, possibly dominant, role for dust emission from this region during the event.
While we compare remote sensing and simulation results throughout the event, we focus most of our analysis on the time period between 06:00 and 23:00 UTC on 25 January when a classic wintertime shamal moved across the analysis domain, causing emission and lofting of dust from the Syrian Desert. During a shamal, a cold front sweeps across the Arabian Peninsula allowing a high pressure to build in from the northwest and strengthen across Saudi Arabia. The synoptic pattern forces strong northwesterly surface winds to blow across the Syrian Desert and often lofts large quantities of dust into the atmosphere.
We characterize the synoptic evolution and evaluate the meteorology of the WRF-Chem simulation using the Climate Forecast System Reanalysis (Saha et al., 2010) product. The CFSR product combines the Climate Forecast System coupled ocean–atmosphere model reforecast data with an assimilation of available observations, including data from surface, radiosonde, aircraft, and satellite observations. Critically, this reanalysis dataset is independent of the GFS-FNL reanalysis dataset used to force the WRF-Chem model, increasing the independence of this evaluation. We specifically utilize 700 hPa geopotential height, 850 hPa temperature, and 925 hPa winds for the comparison. These variables provide a good visualization of the synoptic forcing, identify frontal boundaries, and illustrate large-scale low-level wind patterns. Figure 3 shows snapshot images of these variables over the analysis domain. Prior to the event, at 00:00 UTC on 24 January 2010, low-level southerly winds were present across much of the Arabian Peninsula, advecting warm air from the south, and a mid-level trough of low pressure was present to the northwest of the region (Fig. 3a). By 00:00 UTC on 25 January 2010, the mid-level trough dropped south onto the Syria–Turkey border, and a cold front moved into Iraq initiating the dust event (Fig. 3b). By 12:00 UTC on 25 January 2010, the front entered Iran, and strong westerly winds covered much of the Syrian Desert (Fig. 3c). It was at this time that a large dust plume was visible across the Syrian Desert centered along the Iraq–Saudi Arabia border in remotely sensed imagery (Fig. 4). At 00:00 UTC on 26 January 2010, the front was weakening as it pushed south across Saudi Arabia, and a secondary cold front was moving south into northern Iraq and Syria (Fig. 3d).
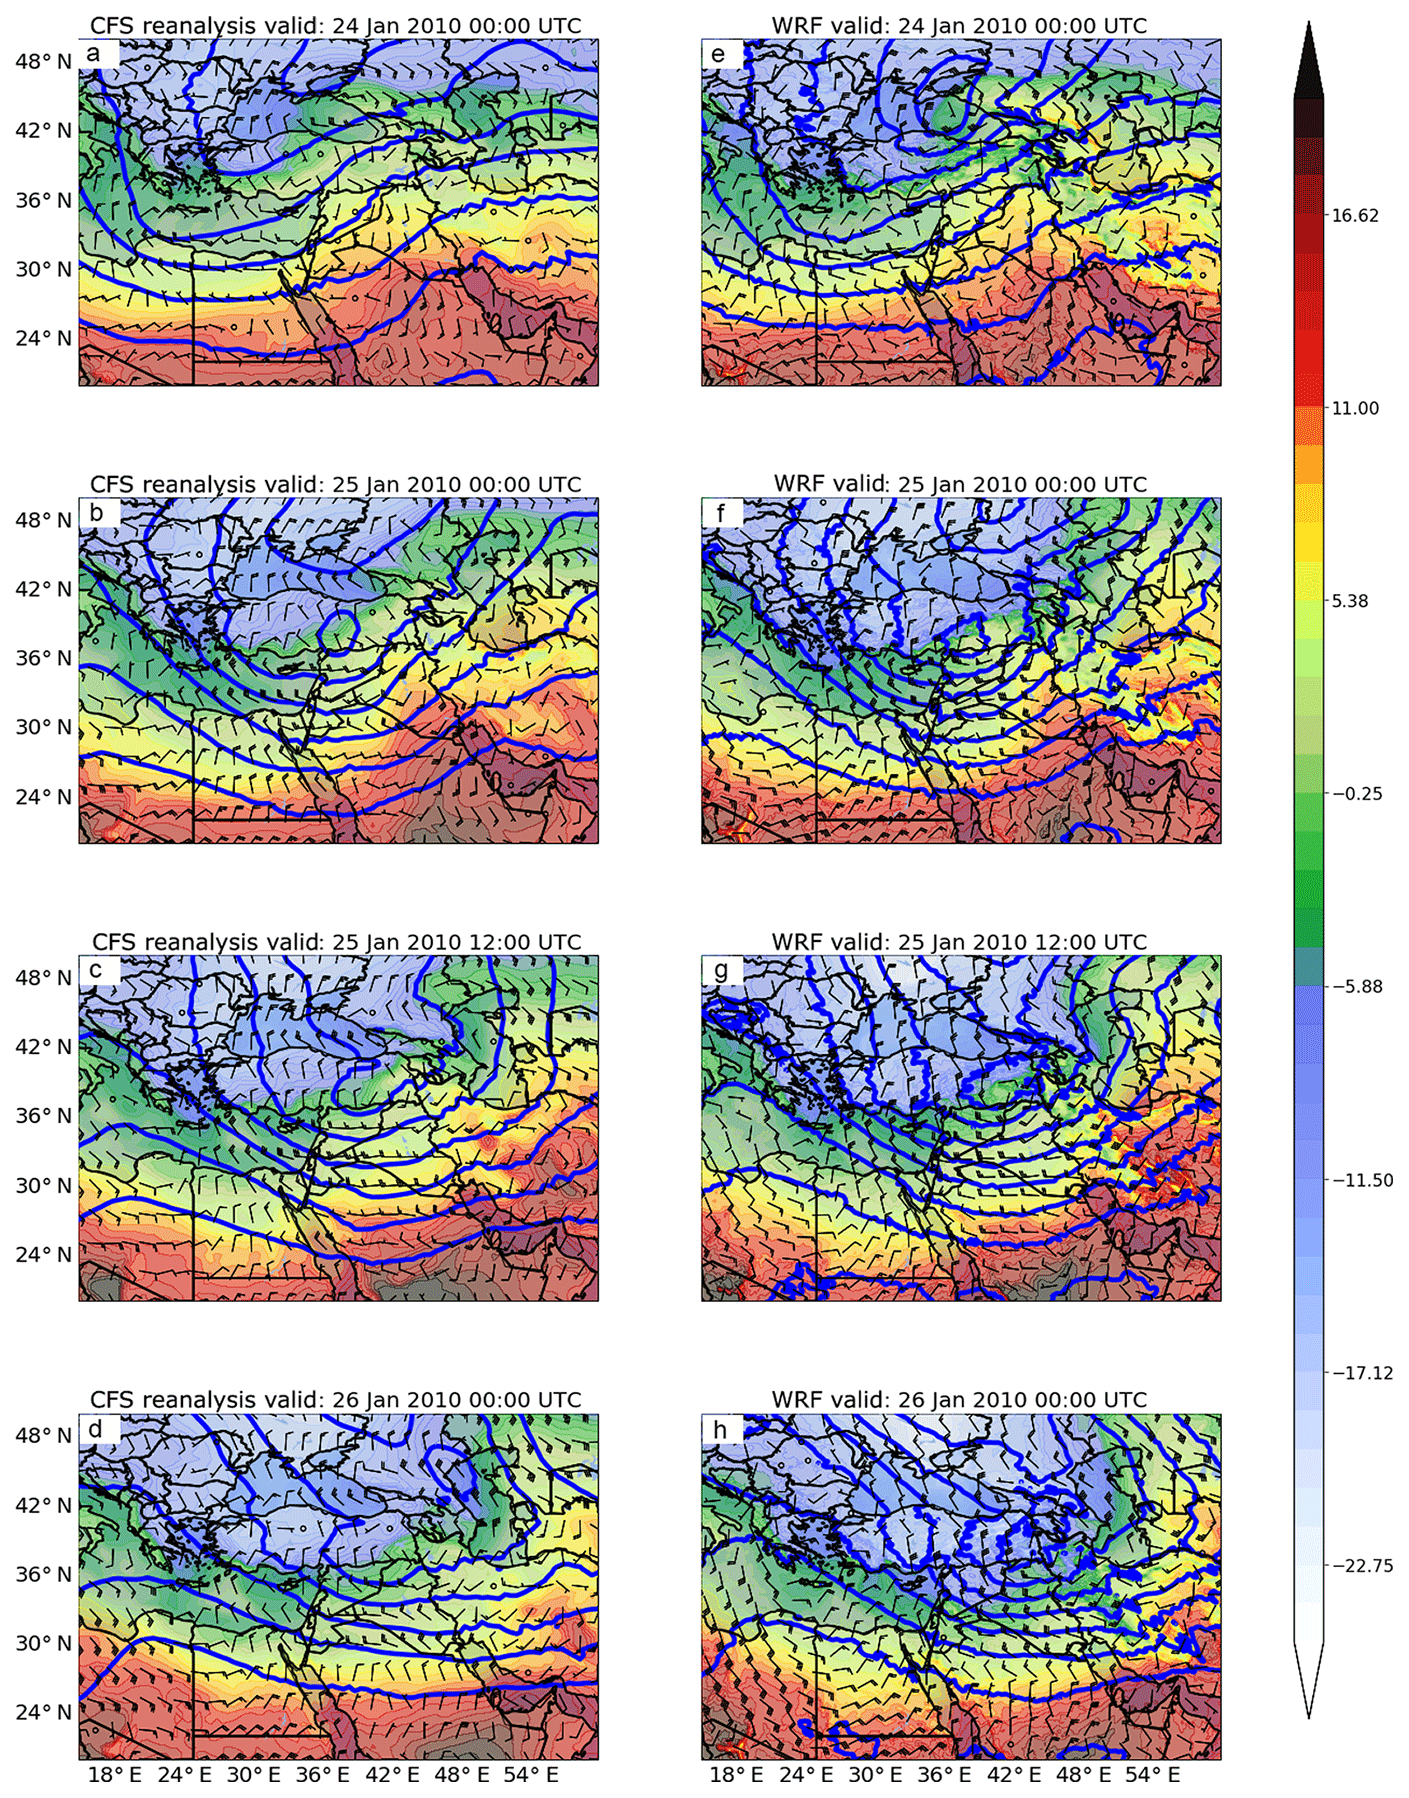
Figure 3The synoptic environment during the time period surrounding the dust emission event. Blue lines represent 700 hPa geopotential height, shading represents 850 hPa temperature, and vectors represent 925 hPa winds. Panels (a)–(d) show independent CFSR data. Panels (e)–(h) show WRF-Chem modeled conditions.
To evaluate the realism of the modeled synoptic evolution, we compared the variables used to characterize the synoptic environment from WRF-Chem (Fig. 3a–d) with the independent CFSR data (Fig. 3e–h). The synoptic evolution produced by the WRF-Chem model was very similar to the one in the CFSR, indicating that WRF-Chem performed adequately in simulating the meteorology. Further comparisons to radiosonde data (not shown) indicated WRF-Chem was able to adequately reproduce the observed atmospheric wind and temperature profiles (Letcher and LeGrand, 2018). Importantly, WRF-Chem was able to reproduce the observed boundary layer winds quite well over the dust source region, a critical requirement to accurately simulate dust emission. The general consistency of the modeled and observed meteorology indicates that discrepancies between modeled and observed dust in the atmosphere are largely attributable to the simulated dust emissions, rather than to the simulated meteorology. Additionally, each of the three simulations experience the same meteorology, such that differences between the modeled dust emissions can be entirely attributed to the emission schemes.
5.1 MODIS imagery (AOD, true-color, and dust-enhanced products)
We utilize 1 km resolution true-color and dust-enhanced satellite imagery derived from MODIS data to qualitatively assess the general origin and extent of the dust plumes. Image dust enhancement was performed using a processing algorithm by Miller (2003), in which atmospheric dust is distinguished from the underlying background terrain using visible, near-infrared, thermal infrared, and water vapor channels. The script used for acquiring MODIS granules and generating imagery in GeoTiff format is available in Sinclair and Jones (2017). We also use the 1 km resolution MODIS MCD19A2 daily AOD product (Lyapustin and Wang, 2018) provided by the NASA Land Processes Distributed Active Archive Center (LP DAAC), USGS/Earth Resources Observation and Science (EROS) Center, Sioux Falls, South Dakota (https://lpdaac.usgs.gov/data_access/data_pool, last access: June 2017) to evaluate the simulated AOD.
5.2 CALIOP data
We use version 4 (V4) of the level 2 (L2) vertical feature mask data product (CAL_LID_L2_VFM-Standard-V4-1) from CALIOP on board the Cloud-Aerosol Lidar and Infrared Pathfinder Satellite Observation (CALIPSO) mission to identify atmospheric aerosol observed in the modeled domain (Winker, 2009). These data provide an along-track record of cloud and aerosol layers observed by the CALIOP lidar averaged over 5 km bins (15 profiles at 333 m spacing), which classifies observations as clean air, clouds, aerosols, stratospheric features, surface, subsurface, and totally attenuated backscatter (no signal). In addition, nine aerosol subtypes (clean marine, dust, polluted continental/smoke, clean continental, polluted dust, elevated smoke, dusty marine, volcanic ash, and others) are derived in the V4 L2 aerosol layer product (CAL_LID_L2_05kmAPro-Standard-V4-10). These are used to verify that aerosol clouds being investigated in this study are primarily dust. We obtain observations of aerosol extinction profiles from the V4 L2 aerosol profile product (CAL_LID_L2_05kmAPro-Standard-V4-10; Young et al., 2009), which are compared directly to the modeled atmospheric extinction profiles. CALIOP AOD is obtained by integrating over the vertical extinction column. All products are available through the NASA data portal at https://search.earthdata.nasa.gov/ (last access: June 2017).
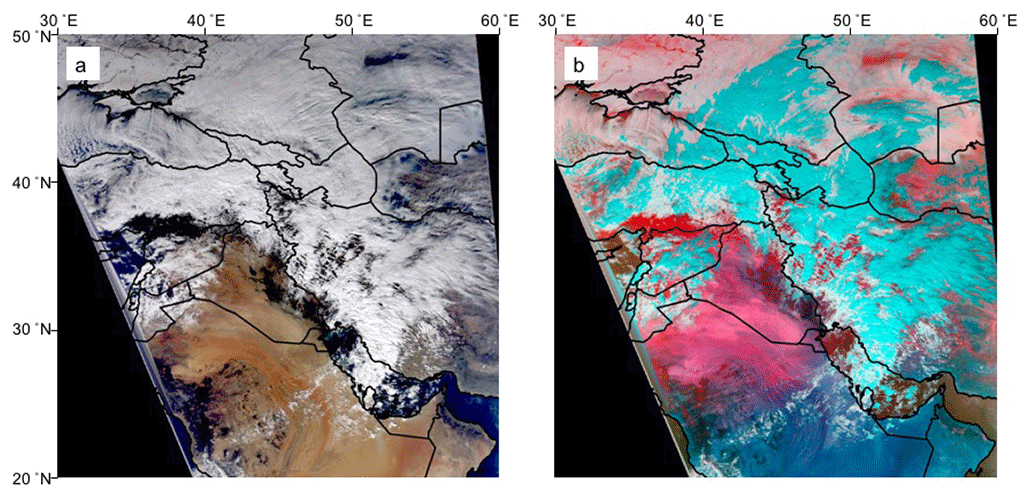
Figure 4Observations of the lofted dust plume collected at 10:00 UTC on 25 January 2010 by the MODIS sensor including the (a) true-color composite and (b) dust-enhanced image produced using the Miller (2003) algorithm, where lofted dust appears pink, landscapes have blue and green hues, and water and steep terrain are red.
Results from the three simulations (Figs. 5–7) demonstrate substantial differences in outcomes between the GOCART-WRF scheme (dust_opt=1), and the other two schemes (AFWA and UoC). Smaller, but still substantial, differences exist between the AFWA and UoC schemes (dust_opt=3 and dust_opt=4, respectively). Figure 4 shows MODIS true-color and dust-enhanced imagery of the peak dust emissions. The extent of the dust cloud can be seen to imply emissions encompassing the Syrian Desert region in Jordan, Syria, and western Iraq. Figure 5 shows modeled aerosol optical depth at 550 nm for each of the three dust schemes, at six snapshots in time during the event, coinciding with CALIOP overpasses. CALIOP-derived AOD transects (left-most line) are overlain on the plots adjacent to equivalent model-derived AOD transects for comparison (right-most line). A representation of CALIOP-observed clouds is also shown to indicate pixels with suspect AOD observations (center line). Figure 6 shows full vertical curtains of aerosol extinction profiles along the CALIOP transects for each of the six overpasses from CALIOP observations (row 1) and the simulated outputs (rows 2–4). Finally, Fig. 7 shows the dust emissions derived for each of the emission schemes, at time snapshots representing three CALIOP overpass times and three other times during the dust emission event.
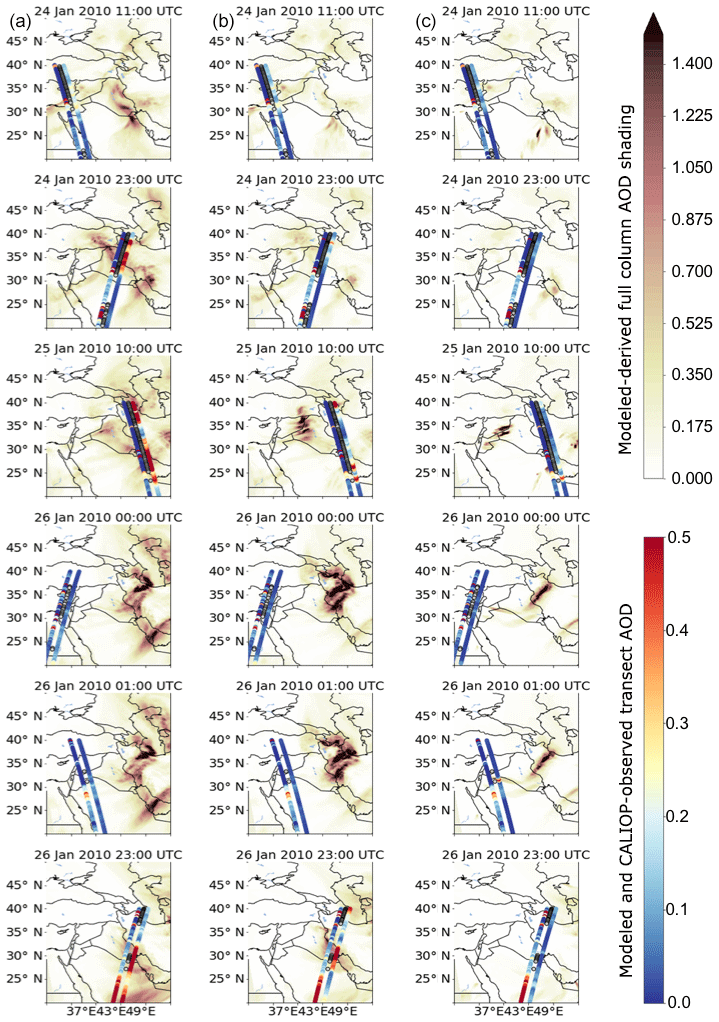
Figure 5Shaded maps of modeled AOD for the GOCART-WRF (column a), AFWA (column b), and UoC (column c) schemes. Timestamps are indicated at the top of each image and are the same across the rows. Transects of AOD are also placed as overlays on each plot, with the three adjacent transects representing observed AOD from the CALIOP data (left transect line), locations along the transect where CALIOP observations are heavily impacted by cloud cover and retrieval does not represent full column AOD (center transect line), and modeled full-column AOD along the transect (right transect line).
The collection of these simulations clearly demonstrates that the GOCART-WRF scheme produces the largest atmospheric dust content, and that the dust lofts from across the widest area, including intense emissions from the Syrian Desert in eastern Syria, Jordan, and western Iraq and lower intensity emissions in the northern Arabian Desert areas of southern and western Iraq and northern Saudi Arabia (Fig. 7). The dust emissions occur over a wider area and continue temporally longer than they do in the other schemes, including in areas experiencing lower wind speeds. This outcome is consistent with the spurious dust lofting noted by earlier works. The result of these large-scale emissions is substantial AOD over large areas of the model domain (Fig. 5). The excessive area experiencing dust lofting is largely expected given the treatment of the threshold wind speed discussed in Sect. 3.1.
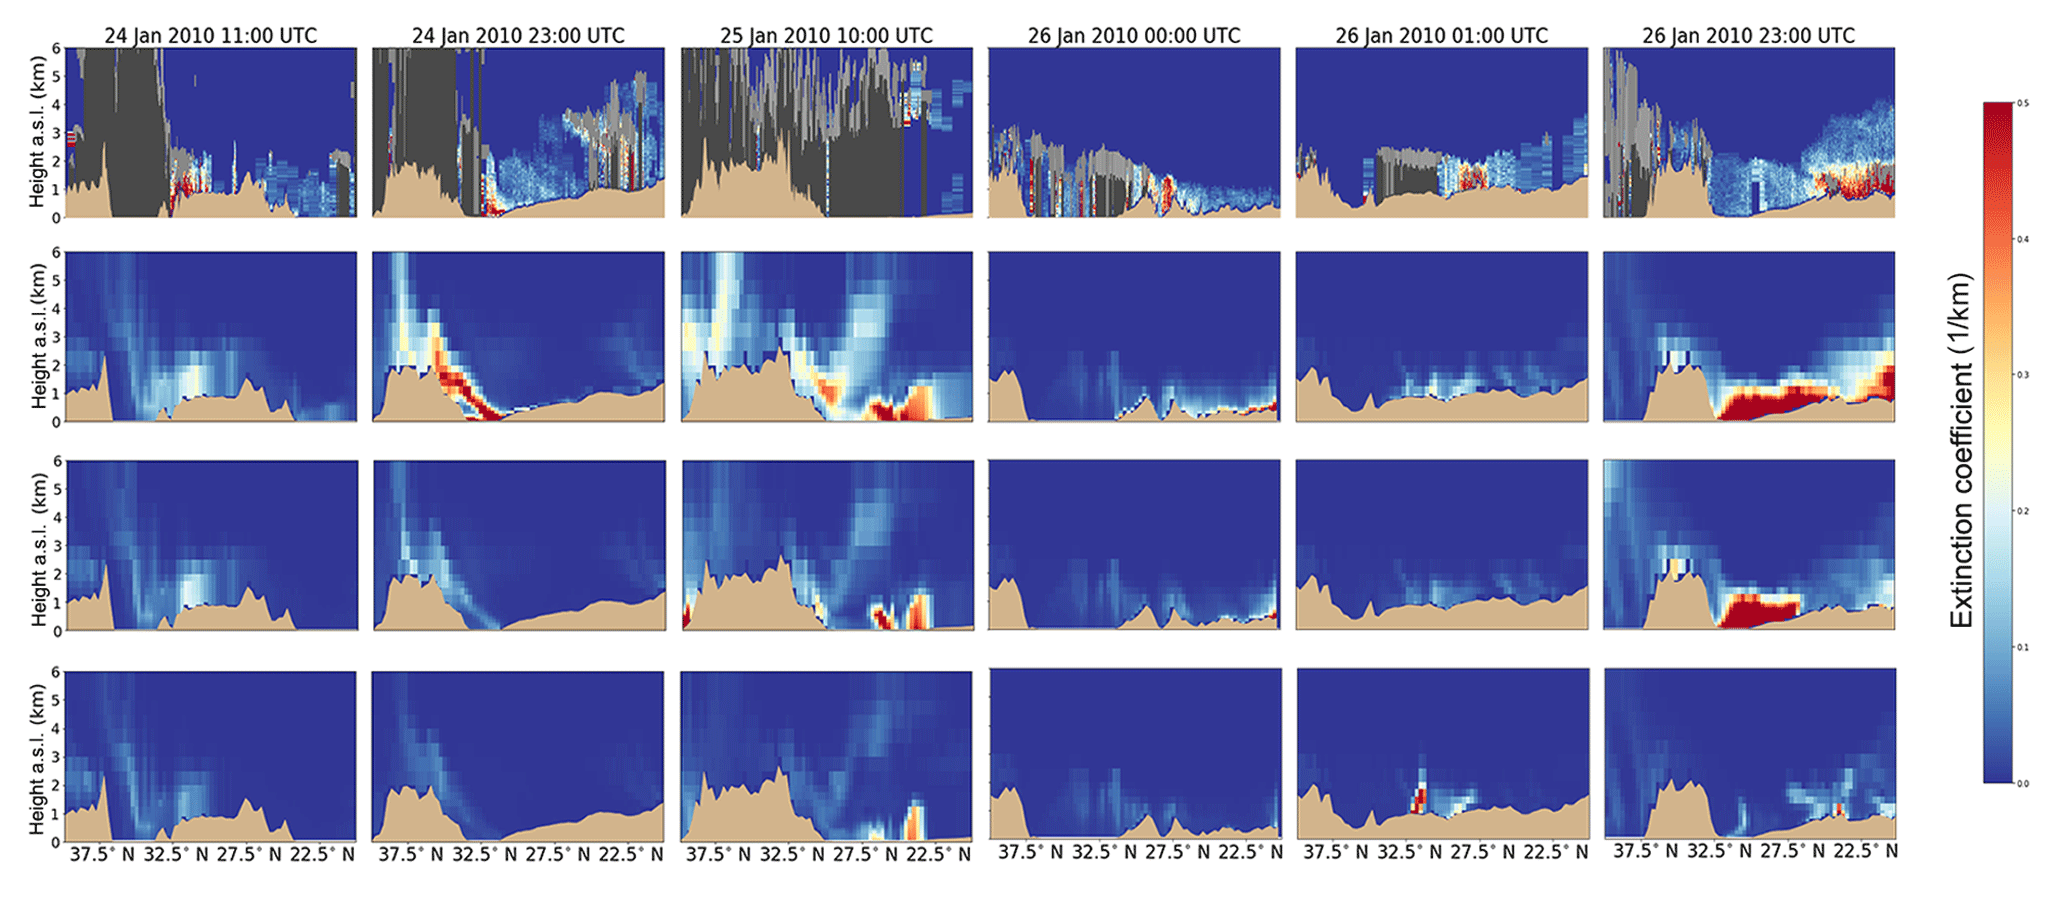
Figure 6Aerosol extinction profiles at 550 nm along the CALIOP transects for each of the six overpasses shown as integrated AOD in Fig. 5. Row 1 represents observed CALIOP data, with light gray indicating clouds, and dark gray indicating areas beneath clouds where no data are available. The remaining three rows represent modeled data, with GOCART-WRF in row 2, AFWA in row 3, and UoC in row 4.

Figure 7Modeled dust emissions from the GOCART-WRF (a), AFWA (b), and UoC (c) schemes with time advancing from top to bottom. Here, we provide simulation results for times that align with three CALIOP transect collections and three other times selected to show the evolution of the event. Emissions during the remainder of the time period represented in Figs. 5 and 6 are minimal.
The AFWA and UoC schemes both produce much more localized emissions and emit dust only under the higher wind conditions present early on 25 January (Fig. 7). Emissions in the AFWA scheme originate from the Syrian Desert in southern and eastern Syria, western Iraq, and eastern Jordan but are limited beyond this domain and of much lower intensity than seen in the GOCART-WRF scheme. These result in AOD patterns consistent with a “pulse” of dust emission as the front passes over the Syrian Desert. The pulse is then advected eastward and northward out of the model domain (Fig. 5). The spatial configuration of emissions is still more localized for the UoC scheme, restricted to intense emission sites in the Syrian Desert, primarily in southern Syria, but also in extreme eastern Jordan and extreme western Iraq. The modeled AOD resulting from the highly localized emission of the UoC scheme is then an intense pulse with relatively hard boundaries. Similar to the AFWA scheme, this is advected east and northward out of the domain but covers a much smaller spatial extent during this time.
Compared to the spatial extent of the dust plume seen in the dust-enhanced MODIS observations (Fig. 4), the modeled AOD in the AFWA scheme (Fig. 5) produces the best match to the AOD seen in the cloud-free region within the MODIS observations, in this particular test case. Modeled AOD shows too small a spatial extent in the UoC scheme and too large a spatial extent in the GOCART-WRF scheme (Fig. 5). This single test case comparison does not imply that any of the three dust emission schemes is superior in all cases. This result, however, provides the basis for investigating the reasons for the particular model behavior in the discussion that follows.
More detailed comparisons of simulated and observed dust in the atmosphere are presented using the CALIOP lidar data. Total column AOD is presented along the CALIOP tracks in Fig. 5. The parallel transects represent the observed (left) and simulated AOD (right) with cloud cover that restricts CALIOP retrieval of full-column AOD indicated in the center transect. Note that observed and simulated AOD should only be compared in areas not impacted by cloud cover. Unfortunately, high observed AOD frequently occurs in close proximity to cloud cover, and none of the available CALIOP transects directly sample the main dust plume of this event near the time of peak emissions. While these limitations hinder a robust comparison, a general result is that the GOCART-WRF scheme tends to produce higher AOD along the CALIOP transect than observations show (e.g., Fig. 5, row 3), while the AFWA and UoC schemes both show more limited AOD along the transects which appear smaller in extent than suggested by observations. All schemes appear to under predict the highest values of observed AOD. Closer examination of this in profile format is needed to better assess agreement.
Modeled and observed aerosol extinction profiles are presented in Fig. 6. A combined plot representing several CALIOP observations is presented in the first row. The plot is based on vertical feature mask data (to show clouds) and extinction profiles, where available. Optically thick clouds are masked in light gray and the area underneath optically thick clouds (no data) is masked in dark gray. This more clearly shows the substantial limitations on available data in the lower atmosphere imposed by cloud cover and the reason for limited observations of high total column AOD in the transects shown in Fig. 5. The extinction coefficients presented, both in these observed data and in the model profiles below, may be reasonably thought of as being caused entirely by dust because aerosol extinction is overwhelmingly attributed to mineral dust in both CALIOP aerosol layer product and in modeled data.
The modeled extinction profiles presented in rows 2–4 indicate that the location of dust in the atmosphere is largely consistent between the three dust emission scheme configurations but that the amount of dust in the atmosphere differs substantially, with the most dust produced by the GOCART-WRF scheme and the least dust by the UoC scheme. The altitude and spatial placement of the modeled atmospheric dust (as indicated by extinction coefficients) along CALIOP passes collected at 11:00 UTC on 24 January 2010, 23:00 UTC on 24 January 2010, 00:00 UTC on 26 January 2010, and 01:00 UTC on 26 January 2010 all appear consistent with observations, though the observed atmospheric extinction is higher than the amount present in all simulations. In these, the overall dust entrained into the atmosphere in the GOCART-WRF scheme, even though it is emitted from far too large a spatial area, is the best match for observed extinction profiles, in terms of magnitude. Limited observations due to cloud cover make the 10:00 UTC on 25 January 2010 pass challenging to assess. Modeled dust at 23:00 UTC on 26 January 2010 is consistent with the other four time steps, in that altitude and spatial placement of the model dust (extinction coefficients) along the southern end of the transect broadly matches observations but differs in that the GOCART-WRF and AFWA schemes exhibit much stronger extinction profiles in the central part of the transect from 32.5 to 27.5∘ N than are shown in observations. We summarize these results by noting that the overall amount of entrained dust appears to be too low in all three simulations, and that the spatial extent of the emissions is too large in the GOCART-WRF scheme configuration, too small in the UoC scheme configuration, and broadly similar to observations in the AFWA scheme configuration.

Figure 8The (a) MCD19A2 MODIS AOD product for 25 January 2010 and simulated 8 h average 550 nm AOD centered at 10:00 UTC on 25 January 2010 for (b) AFWA, (c) GOCART-WRF, and (d) UoC.
Figure 8 compares simulated 8 h average 550 nm AOD centered at 10:00 UTC on 25 January 2010 to the MCD19A2 MODIS AOD product from 25 January 2010. The effect of clouds on the MODIS AOD retrieval is evident, as much of the AOD in the image is masked out. A regional peak in AOD is observed near the border of Iraq and Saudi Arabia. The general patterns of average AOD simulated for the same time period by the GOCART-WRF scheme are broadly consistent with the MODIS AOD product in the southern part of Iraq and over the Persian Gulf. An area of high AOD in northern Iraq is challenging to compare to observations due to a lack of data in much of that region. Simulated AFWA scheme AOD is too strong over eastern Iraq and also appears to be placed west of the observed plume, perhaps due to a mismatch in timing of emission and therefore less downwind transport, but still captures the extent of the plume across the southern half of Iraq towards Kuwait. Again, high AOD in northern Iraq is difficult to assess. There is a mismatch between the high AOD modeled by the AFWA scheme in northwestern Iraq and observations, but a lack of data just east of the simulated plume location prohibits assessing whether there is simply a small temporal mismatch. There is less agreement with the UoC scheme, which produces several localized, high AOD values over Syria, Jordan, and western Iraq instead of the broader AOD patterns generated by the other two schemes.
We primarily intend our test case data to be a tool for discussing differences between the three WRF-Chem dust emission schemes. We therefore explore the reasons for the differences between these emission schemes in greater detail and plot several static and intermediate model variables as diagnostics to illuminate the various sources of the large differences in the spatial extent and intensity of the modeled dust emissions and to identify highly sensitive model parameters. Relevant terrain attributes, including S, z0, and cf, are provided in Fig. 9, 10 m wind speeds and friction velocities are shown in Fig. 10, and the intermediate model variables are shown in Figs. 11 and 12 for the model state on 25 January 2010 at 11:00 UTC, when simulated dust emissions were at their peak for the event.
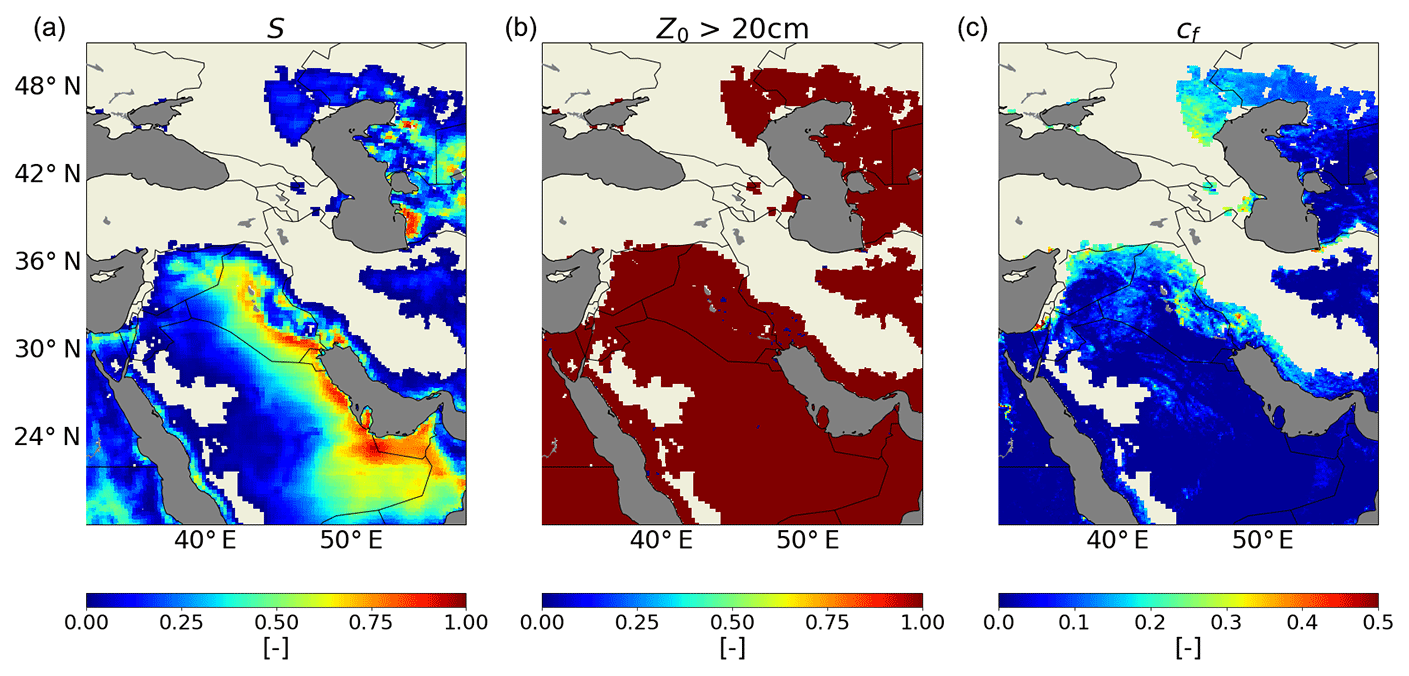
Figure 9Relevant test domain terrain attributes, including source strength (S, a), roughness length greater than 20 cm (z0>20 cm, b), and vegetation fraction (cf, c). Areas where S=0 (i.e., areas identified as vegetated by AVHRR data) are masked in all plots to highlight attributes of grid cells capable of producing dust in the simulation. Areas of dark gray are water bodies.
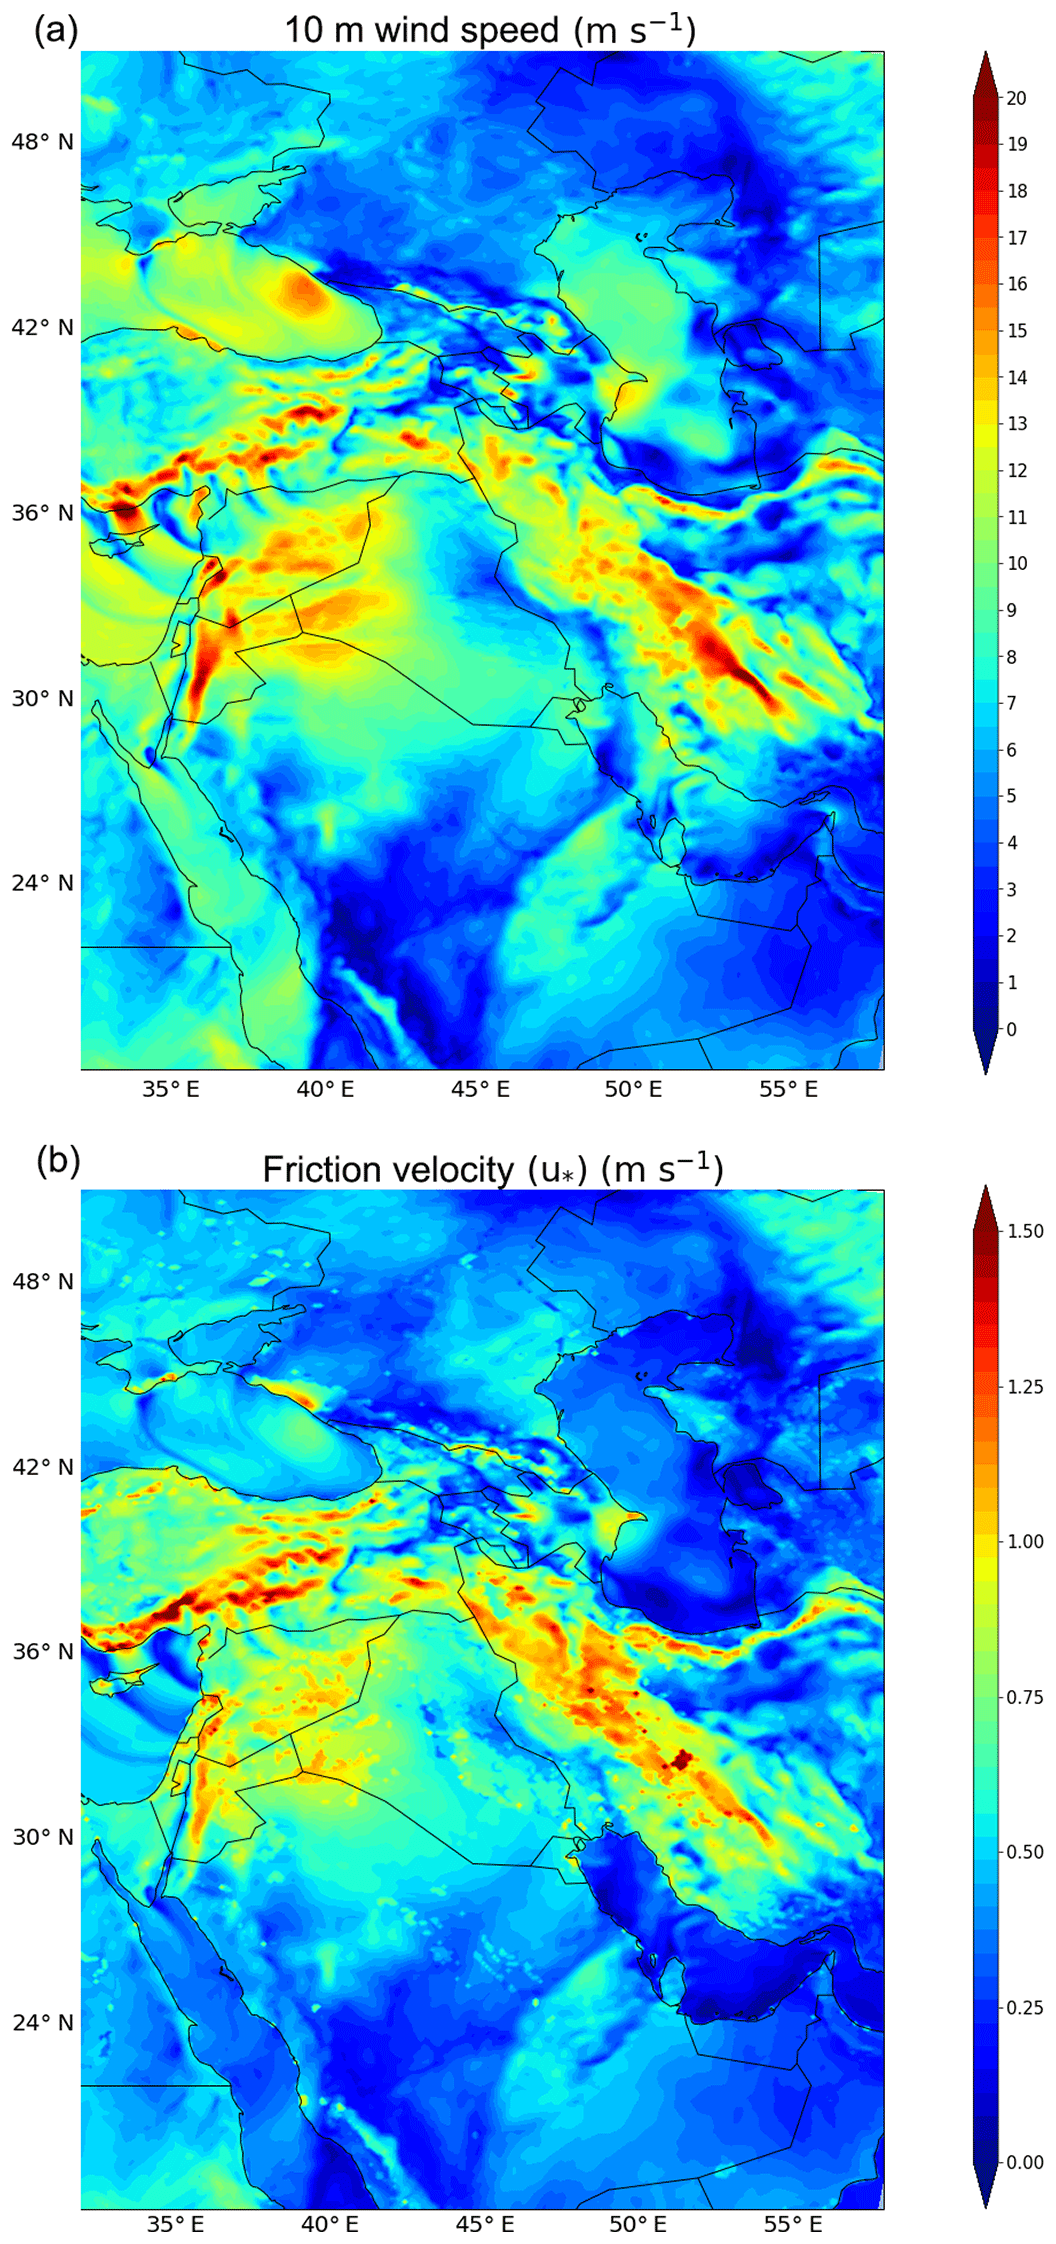
Figure 10Simulated wind speed (a) and friction velocity (b) at 11:00 UTC on 25 January 2010.
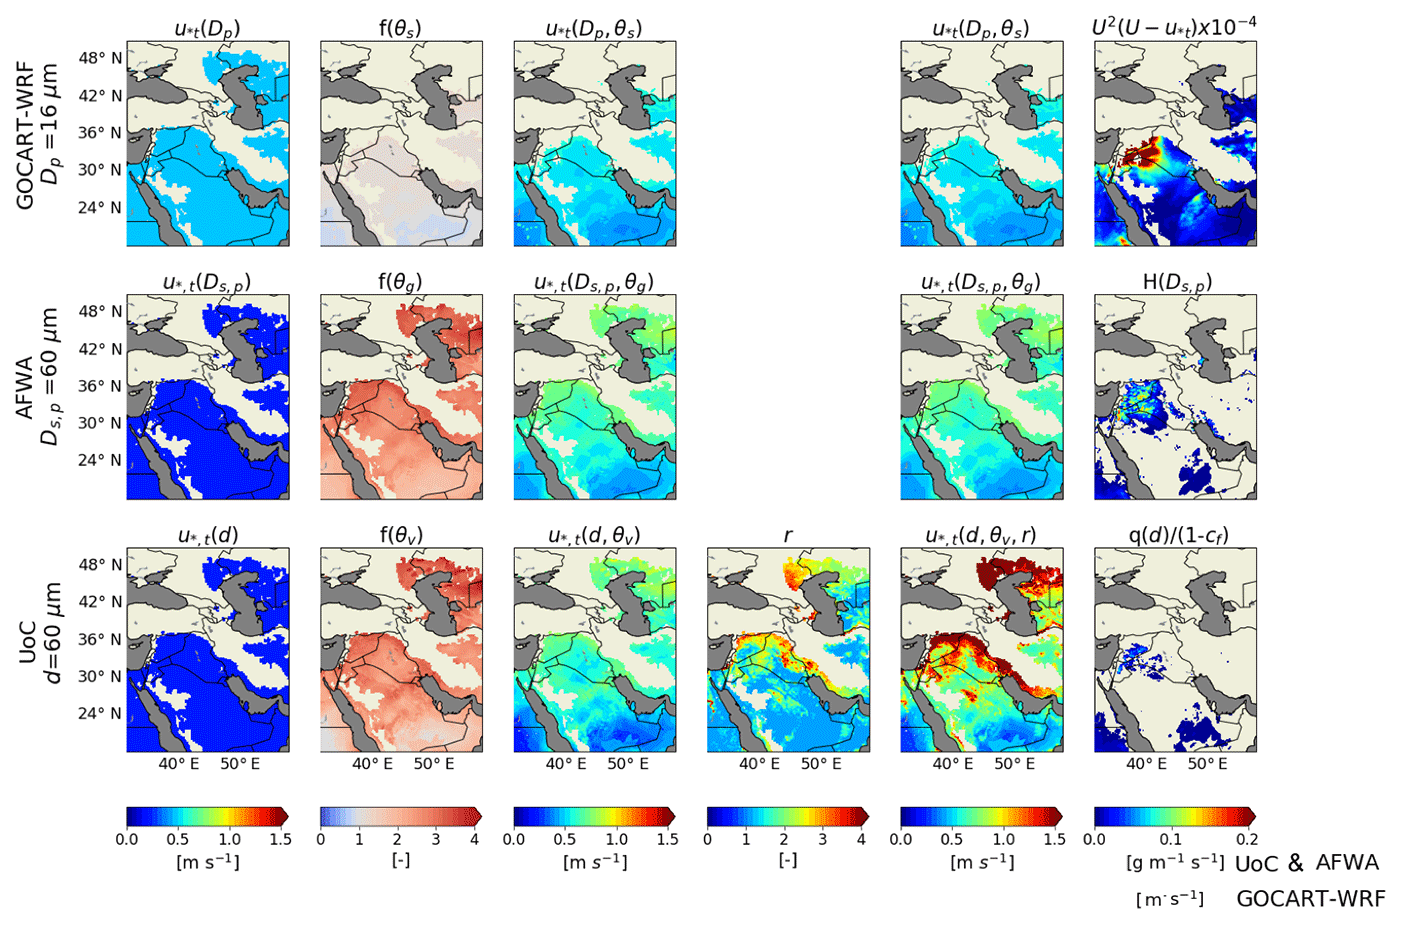
Figure 11Values of intermediate variables used in the calculation of dust emissions by the three different emission schemes, with the GOCART-WRF scheme in the top row, the AFWA scheme in the middle row, and the UoC scheme in the bottom row. All images reflect model state at 11:00 UTC on 25 January 2010. The theoretical dry soil friction velocity threshold for saltation of grains having diameter 60 µm (16 µm for GOCART-WRF) is shown in column 1, the soil moisture correction factor applied is shown in column 2, and the moisture-corrected threshold is shown in column 3. The surface roughness correction, which only exists in the UoC scheme, is presented in column 4, and the threshold friction velocity after all corrections have been applied is shown in column 5. Column 6 shows the saltation flux of 60 µm particles for the AFWA and UoC schemes, as well as a scaled plot of the wind component of the GOCART-WRF emission flux equation for a 16 µm particle. Areas of dark gray are water bodies, and areas void of color are areas masked out for vegetation in the source strength function.
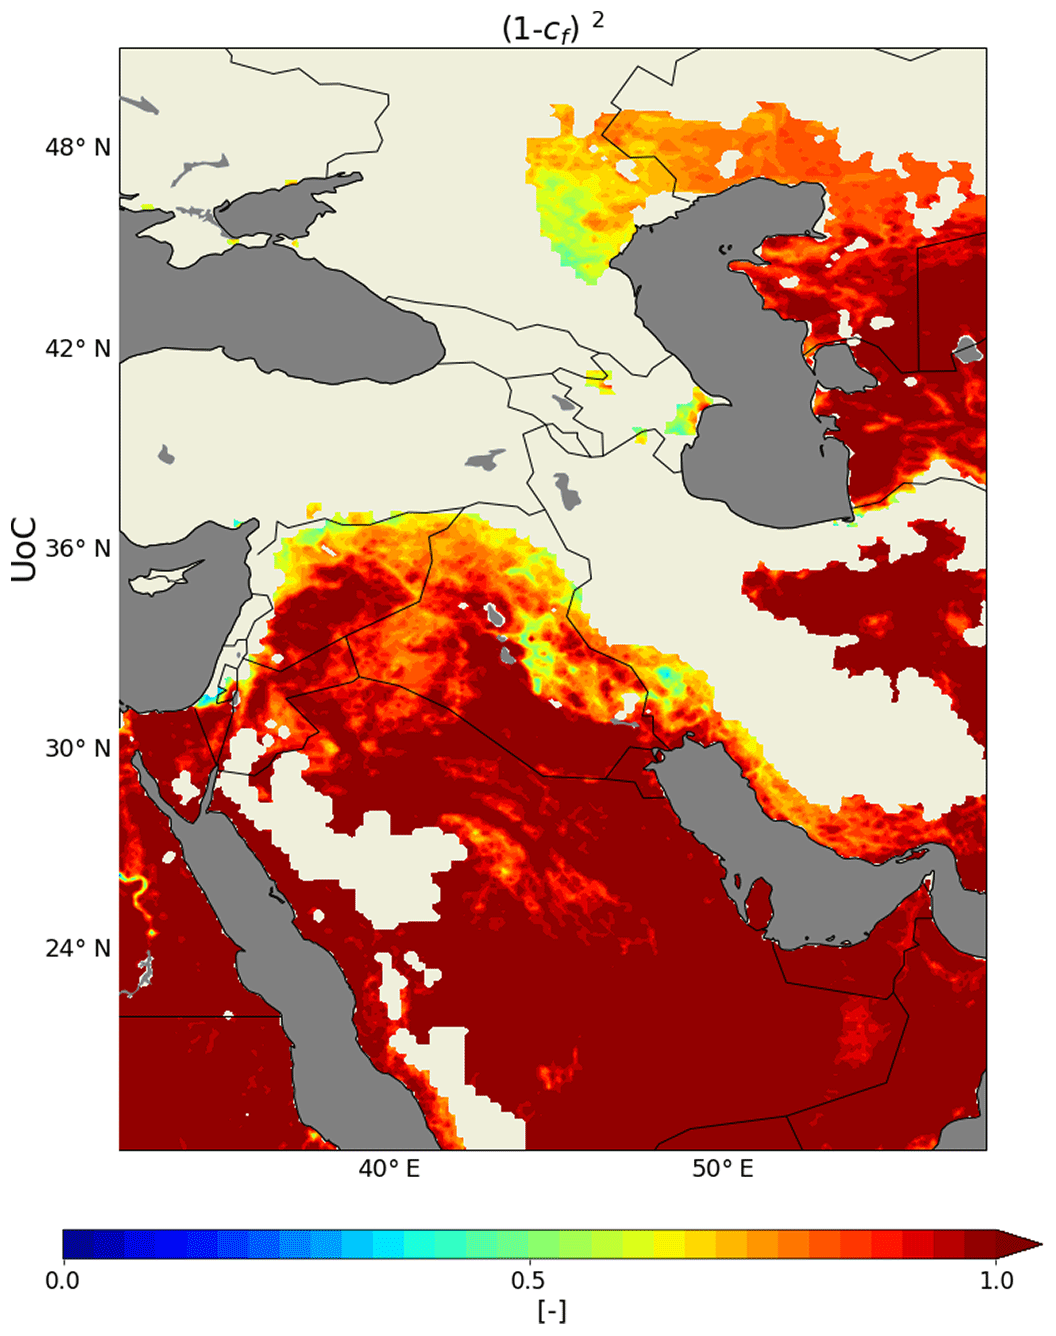
Figure 12The UoC vegetation correction function, squared to account for the application of the multiplier in both the saltation and emission flux calculations. Areas of dark gray are water bodies, and areas void of color are areas masked out for vegetation in the source strength function.
Here, we are particularly interested in explaining the reasons for the differences in spatial coverage of dust emission in the UoC scheme, relative to the AFWA scheme. Reasons for spurious dust lofting at low wind speeds in the GOCART-WRF scheme are well documented in Sect. 3.1 and by earlier papers (Colarco et al., 2003a), and require little further investigation. In considering the UoC–AFWA differences, we first note that z0-based emission restrictions associated with the AFWA scheme (Eq. 14) are minimal in areas with S>0 (Fig. 9) and thus have little effect on simulated dust emission differences for the test domain. We also note that winds are high across the region where dust lofts in the AFWA scheme (Fig. 10) – and largely equivalent in western Iraq and southern Syria, even though dust is only emitted in the Syrian portion of this area in the UoC scheme. The equivalent wind forcing across areas that do, and do not, emit dust within UoC suggests the difference is a fundamental part of the dust emission scheme. We hypothesized that this could be due to (1) differences in calculated threshold friction velocity, especially related to the soil moisture correction and the roughness correction factor (which is applied only in UoC), and (2) the dependence of both saltation flux and dust emission calculations on the factor 1−cf in UoC, a factor which is not present in AFWA. We tested these hypotheses by following the dust emission calculations through each of the three simulations (visually showing intermediate variables from these calculations in Figs. 11 and 12) and ultimately found that the restricted area of emissions is primarily due to the roughness correction factor (the second part of hypothesis 1), though a coding error, the 1−cf vegetation correction factor, and the S parameter also play a role in the differences. Our analysis includes the GOCART-WRF scheme for completeness, though we acknowledge the attempt to make a step-by-step comparison is imperfect because the GOCART-WRF scheme operates based on a direct relationship between wind speed and dust emission and does not track saltation-sized particles separately.
We begin our analysis by calculating dry soil threshold friction velocity required for initiating particle mobilization for each of the three dust emission schemes. The dry soil threshold parameter for these schemes only varies as a function of particle size (i.e., it does not vary spatially); however, we provide results in mapped display (Fig. 11, column 1) for ease of discussion with respect to the soil moisture and roughness correction factors. Resultant dry soil thresholds for given particle sizes are shaded everywhere the dust source function is non-zero.
Direct comparison between the GOCART-WRF scheme and the other two schemes is not possible since the GOCART-WRF scheme only considers dust-sized particles, but for completeness we determine the dry soil threshold velocity for a grain diameter of 16 µm (the effective diameter of the largest dust bin) to be equal to 0.48 m s−1 using the GOCART-WRF implementation of Eq. (5). The AFWA and UoC schemes determine the dry soil threshold friction velocity based on Eqs. (5) and (17), respectively. Though the calculations are different, we note that the resultant threshold for a 60 µm particle (i.e., a relatively small, easy to mobilize sand-sized particle; Bagnold, 1941) is 0.24 m s−1 in both the UoC and AFWA schemes (as shown in Fig. 11, column 1). We therefore conclude that minor differences in these threshold friction velocities are not a major cause of differences in the AFWA and UoC dust emissions.
All three dust emission schemes include a correction for the threshold friction velocity parameter based on the soil moisture. This correction factor is shown in Fig. 11, column 2. The general equation for calculating this correction in the AFWA and UoC schemes is identical (Fécan et al., 1999), but we see slightly different output, presumably due to differences in coefficients assumed for each soil class considered in the UoC scheme. As expected, these minor differences do not drive a significant difference in emitted dust mass. However, in comparing AFWA and UoC, a somewhat higher soil moisture correction is present across north central Saudi Arabia in the UoC scheme. This might cause a difference in dust lofting from that region under certain circumstances. In this case, neither model configuration emits dust from this region (Fig. 7). The similarity in moisture correction factors leads to similar moisture-corrected threshold friction velocities for the UoC and AFWA schemes (Fig. 11, column 3), leading us to reject the first part of hypothesis 1 and conclude that differences in moisture correction are not the principle cause of differences in emissions between the AFWA and UoC schemes in this case study.
The soil moisture correction in the GOCART-WRF scheme is quite different, and its value varies from 0 to 1.2, with values near zero for soils of very low moisture content. The values <1 effectively adjust the threshold velocity determined from the MB95 relationship downward, and thus this scheme treats the MB95-based threshold velocity as if it were valid for soil of moisture content 0.1, rather than as if it were for dry soil. In contrast, the adjustment in the AFWA scheme assumes MB95 velocities represent dry soil and adjusts the threshold friction velocity upward for higher moisture content. The behavior of the GOCART-WRF scheme, further reducing threshold velocities under dry soil conditions, is challenging to defend and likely further contributes to spurious low-wind dust lofting seen in the GOCART-WRF scheme (though the substitution of an equation intended for threshold friction velocities for 10 m wind speeds discussed in Sect. 3.1 is a more important factor).
In the UoC scheme, the moisture-corrected threshold friction velocity is further modified by a roughness correction (Eq. 18), calculated based on vegetation coverage (Eq. 19). Vegetation fraction, cf, for the domain is shown in Fig. 9, and the resultant roughness correction is shown in Fig. 11, column 4, in the UoC row. Ranging in value from 1 to 4, the roughness correction factor substantially raises the threshold friction velocity over large parts of the domain. We note, in particular, that it is a strong candidate for being the primary cause of emission reductions in western Iraq, relative to those predicted by the AFWA scheme because it increases threshold friction velocity in western Iraq by a factor of 2 or more, while southern Syria remains near 1. There is no step in the AFWA or GOCART-WRF schemes that is broadly comparable to the roughness correction in UoC. We note that there is an optional runtime flag in the AFWA scheme that would allow a user to feed in a vegetation mask through an auxiliary channel, but this is not used as part of the default configuration.
Threshold friction velocities with all corrections applied are then shown in Fig. 11, column 5. These fields, which can be compared against the values from column 3 that have only the moisture correction applied, clearly show that the roughness correction increases the threshold friction velocity across the western Iraq area in the UoC scheme, while leaving the threshold friction velocity similar to the AFWA scheme in southern Syria.
Next, saltation flux for the denoted saltation particle size is calculated from the WRF-Chem simulated wind speed or friction velocity and the threshold friction velocity. This is shown in Fig. 11, column 6, for particles of 60 µm size (AFWA and UoC) and 16 µm size (GOCART-WRF). UoC and AFWA use the same equation to derive saltation flux, with minor modifications of factors (Eqs. 10 and 20) and a code implementation error in the UoC scheme (see Sect. 3.3.2 for discussion). For the sake of discussion, we ignore the vegetation correction component (1−cf) of Eq. (20) for now. The minor difference of the constant factor from 1 to 2.3 in UoC relative to AFWA should generally result in increased saltation flux in UoC for locations having equivalent corrected threshold friction velocities in Fig. 11, column 5, but by no more than a factor of 2.3. The UoC code implementation error in Eq. (20), however, more than counteracts this, and results in substantially lower saltation flux than would be expected (by about 1 order of magnitude). The result is that UoC saltation fluxes within the (limited) areas having similar threshold friction velocities are lower relative to the AFWA scheme. Correcting the saltation function error should be expected to produce slightly higher emissions from the UoC scheme relative to the AFWA scheme under conditions where both models produce similar threshold friction velocities. This would help improve the overall emission of dust in the UoC scheme (which was too low) but would not impact the limited spatial extent of dust emissions which we seek to understand. We demonstrate the impact of this code correction, including the lack of effect on the limited spatial extent of dust emissions, in Appendix A.
Values from Fig. 11, column 6 (calculated for all relevant particle sizes associated with a given scheme), are converted to predicted emission fluxes by considering the availability of erodible substrate, which is captured in all schemes in some form by the topographically derived source function (S, Eq. 4), which ranges from 0 to 1 (Fig. 9), though the manifestation of the source function varies according to each scheme. In the GOCART-WRF scheme, layers representing the fixed fractions of sand (50 %), silt (25 %), and clay (25 %) are multiplied by S. Since sand is excluded from the size fractions eligible for lofting, the sum of the fractions effectively varies from 0 to 0.5, halving the effective emissions. The UoC scheme uses the S factor as a binary dust source mask (i.e., if S>0, dust emission is enabled; if S=0, no dust emission is allowed). The AFWA scheme treats the dust emission flux as the theoretical flux multiplied by the S factor, which varies from 0 to 1. In areas where S is low, this may result in low emissions for the AFWA scheme compared to the UoC scheme, particularly in portions of western Iraq and Syria where values of S range from 0 to 0.5.
The 1−cf vegetation correction is also part of the overall source correction for the UoC scheme. Domain values of this component, squared to account for the application of the multiplier in both the saltation and emission flux calculations, are shown in Fig. 12. We see that the UoC factor remains between 0.5 and 1.0 over the region of emissions such that, while it affects the magnitude of emissions, it is not causing the limited spatial extent of emissions in the UoC results.
The final dust fluxes presented in Fig. 7, row 2, incorporate additional factors. The GOCART-WRF and AFWA schemes amount to simple multiplications of the source terms and theoretical fluxes, with different methods for handling the parent soil particle size distribution and a small additional correction factor (β) in AFWA. The UoC conversion, with its consideration of soil makeup and bombardment efficiency, is quite different and more complex. Line-by-line comparison is not possible through these steps, but we note that the dust emissions in Fig. 7, row 2, are much higher in UoC than in AFWA for the (limited) locations having the same threshold friction velocity and source strength. For the purposes of explaining the limited spatial extent of the UoC emissions, the series of steps converting between saltation and dust emission in UoC favor higher dust emission and thus are not the cause of limited emission extent in UoC.
We conclude from this analysis that the primary cause of the differences in dust emissions between the AFWA and UoC schemes is the combined effect of multiple terms. Emissions in western Iraq for the UoC scheme are primarily restricted by the roughness correction applied to the threshold friction velocity (Eqs. 18 and 19) with influence from the saltation flux coding error and the vegetation correction on the overall emission magnitude. These roughness and vegetation effects ultimately trace back to the vegetation fraction, cf. Through these corrections, the effect of small amounts of vegetation, which are apparently indicated in western Iraq within the source dataset for cf (Fig. 9), are dominant in decreasing the erodibility of western Iraq and effectively shutting down emissions there. Emissions from portions of Syria and western Iraq are also reduced in the AFWA scheme due to low values of the S parameter.
The finding that the vegetation layer is essentially controlling the spatial extent of dust emissions in the UoC scheme highlights an important fact – dust emission models are highly sensitive to terrain condition data inputs, which are determined from notoriously sparse datasets and (as discussed by Darmenova et al., 2009) can have a strong dependency on horizontal model resolution. Though, in this case, the AFWA scheme appears to produce dust emissions over a spatial domain in better agreement with observations, it would be challenging to conclude that this was related to superior model physics. Instead, the primary cause of the UoC scheme's disagreement with observations appears to be spurious detection of vegetation coverage in western Iraq from the parent WRF-Chem model combined with a correction factor that permits vegetation coverage to strongly impact dust emissions. It is likely, though not investigated in this work, that changes in soil grain size data, which originate from similarly sparse datasets with limited validation, will have similarly large impacts.
Aside from improving vegetation coverage or soil composition data, we note that several parameters could be tuned to attempt to better match behavior between the schemes or better match model behavior to observations. The UoC scheme is particularly sensitive to the soil plastic pressure, and this variable is set to a constant for the entire model domain. Tuning this variable can result in matching the dust emissions of select regions but not across the entire model domain, suggesting this parameter should be dependent on soil type and set using a spatially varying input dataset.
The AFWA dust emission scheme for WRF-Chem is fully documented in the literature for the first time here. This emission scheme represents a substantial advance in the physical realism of dust emission modeling over the GOCART-WRF emission scheme. Key improvements to model algorithms permit saltation flux, caused by aerodynamic entrainment, to be modeled separately from dust emission, largely caused by bombardment and disaggregation processes. Output from the model in a test case is shown to broadly match the spatial distribution and intensity of dust emissions during a wintertime shamal event in southwest Asia.
Analysis of the code and documentation available for the other dust emission schemes highlights several discrepancies between documentation and code implementation, as well as several changes in code implementation across WRF-Chem versions that had not previously been documented. In particular, a recently corrected error in the implementation of the UoC scheme (see Sect. 3.3.2) may have resulted in emissions from the implementation present in WRF-Chem prior to version 4.0 that were approximately an order of magnitude lower than would be expected from the parameterization that should have been included.
Comparing the parameterization approach of the AFWA scheme to the UoC scheme, as implemented in WRF-Chem version 3.8.1, highlights that the two models are similar in many ways. Though the processes included in the UoC dust emission scheme are potentially more physically complete, the AFWA model may have an advantage in mesoscale development due to its lower sensitivity to sparse and challenging-to-obtain soil and vegetation data. The most important future opportunities for improving both AFWA and UoC schemes appear to be related to the fixed input data on terrain properties. First and foremost, both schemes would benefit greatly from replacing the soil particle size distribution dataset and erodibility function with better observational data. UoC would also benefit from improved soil and vegetation coverage data and from a function to make soil plastic pressure tied to soil type or particle size distribution. A focus on collecting and synthesizing such wide-ranging data on Earth surface characteristics, however, will require a substantial, coordinated community effort.
The code used in this study (WRF-Chem version 3.8.1) is included in the chemistry package of the WRF model, currently available through http://www2.mmm.ucar.edu/wrf/users/download/get_sources.html (last access: June 2018). Users can select from the three dust emission schemes discussed by setting dust_opt=1 for GOCART-WRF, dust_opt=3 for AFWA, or dust_opt=4 for UoC in the namelist.input configuration file. If the UoC scheme is selected, the user must also choose one of the UoC sub-options by setting dust_schme=1 for S01, dust_schme=2 for S04, or dust_schme=3 for S11 in the namelist.input configuration file.
The results and discussion presented in our study explore use of the three currently available WRF-Chem dust emission schemes as they are presented in version 3.8.1; however, as highlighted in the text, there are some relatively easy-to-correct errors in the AFWA and UoC code that are worth examining further. Here, we assess the effects of the UoC saltation function order of operations error described in Sect. 3.3.2 (i.e., Eqs. 34 and 35) and use of an alternate configuration for the AFWA scheme saltation bins by rerunning our simulation with bug fixes applied for comparison.
For the UoC scheme, we correct the order of operations error in the UoC saltation flux calculation (i.e., Eqs. 34 and 35). While this error was corrected in WRF-Chem version 4.0 (released June 2018), the bug remains in all previously released versions of WRF-Chem, including version 3.8.1. For the AFWA scheme, we reran our simulation using an alternate saltation bin configuration described in Table (A1) that better aligns with the mass distributions recommended by Tegen and Fung (1994). These bin configuration changes were implemented in the existing version 3.8.1 AFWA code by altering the settings for the ngsalt, reff_salt, den_salt, spoint, and frac_salt parameters in the module_data_gocart_dust.F file according to Table A1.
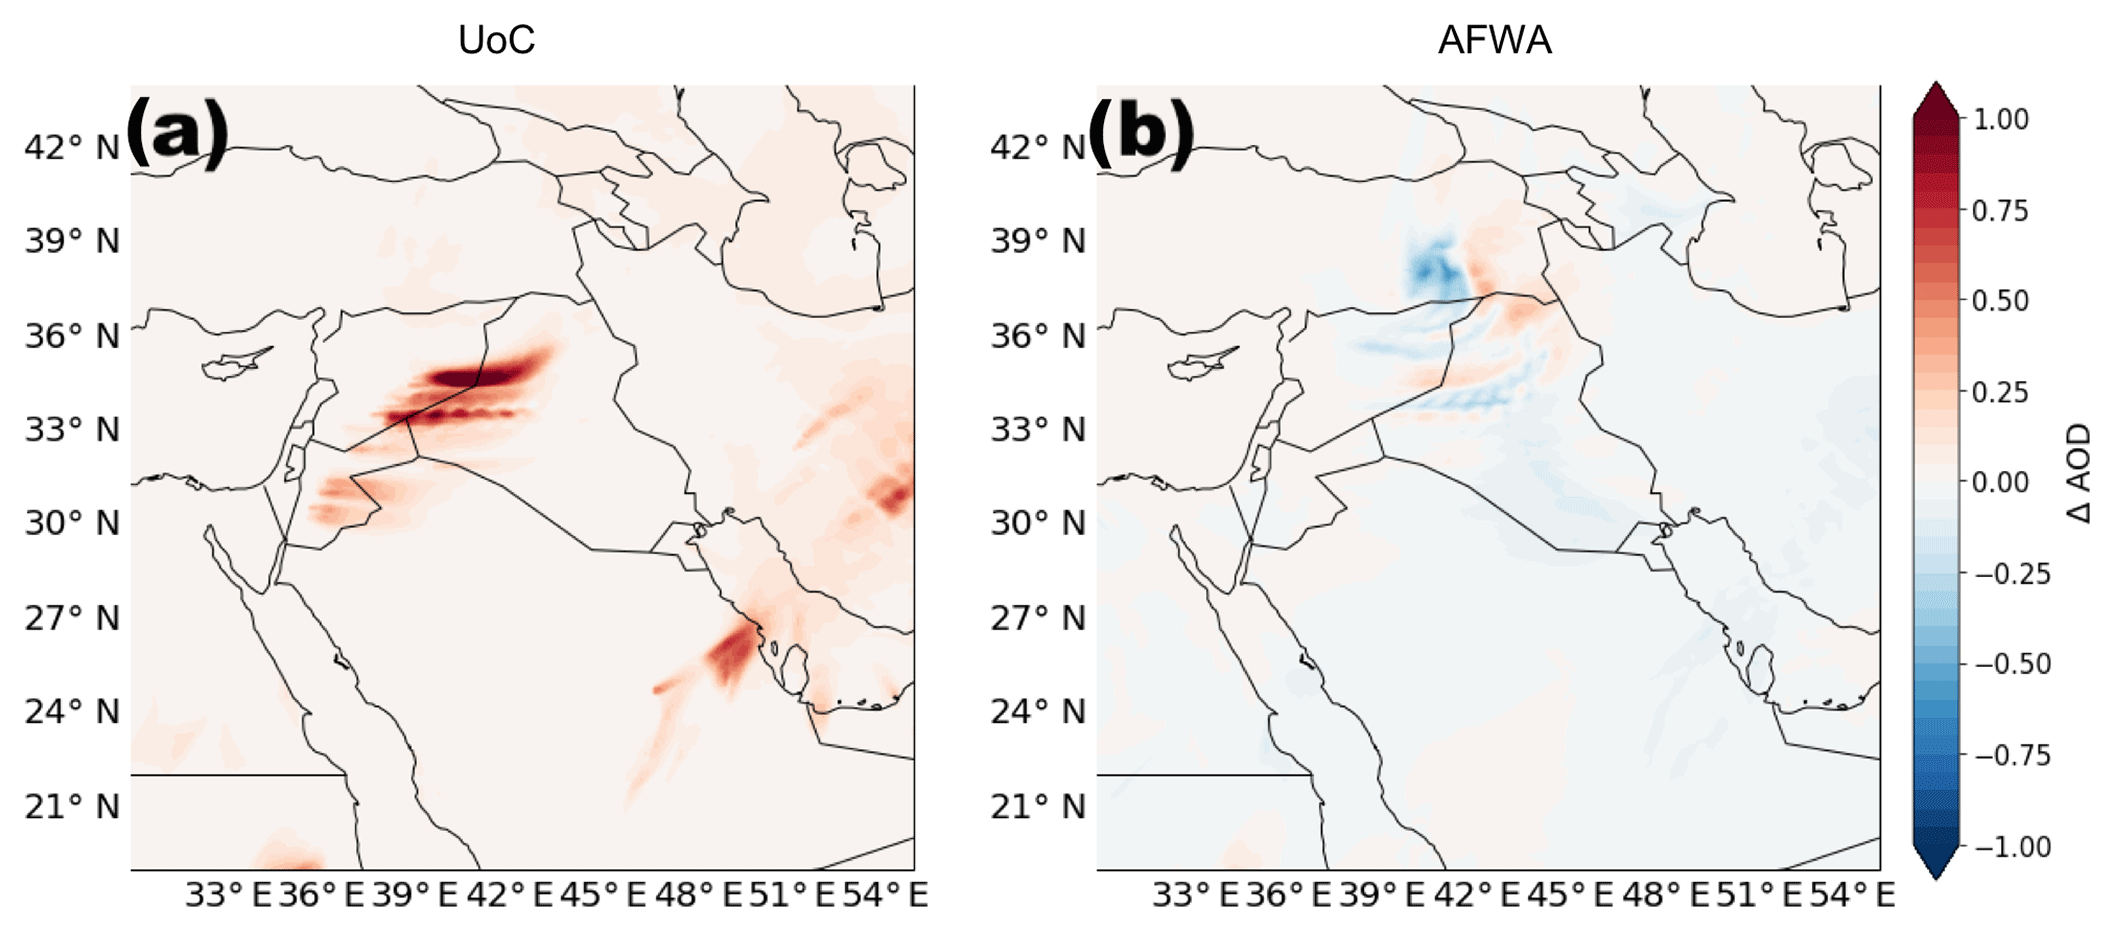
Figure A1Difference in simulated 8 h mean AOD (centered at 10:00 UTC on 25 January 2010) produced by the modified and original versions of (a) UoC and (b) AFWA version 3.8.1 code.
Simulated 8 h mean AODs (centered on 25 January 2010 at 10:00 UTC) from the original and altered UoC and AFWA version 3.8.1 codes were used to illustrate the effects of these changes. Figure A1 shows the calculated difference in 8 h mean AOD between the corrected and uncorrected versions of each scheme. The UoC scheme correction has little effect on the spatial extent of the dust plume but essentially doubles the AOD magnitude in regions where dust is present. Similarly, the use of the alternate saltation bins in the AFWA scheme has a relatively negligible effect on the location and extent of the simulated dust plume. However, in contrast to the UoC correction, the AFWA AOD differences are smaller and of mixed sign.
Based on these results, we recommend that model users consider the impact of the UoC saltation flux error when assessing published results from studies performed using the UoC scheme prior to the release of WRF-Chem version 4.0. The effects of the alternate saltation bin configuration on overall AFWA scheme performance are less clear. Optimal settings for the saltation arrays may be region dependent. Further analyses beyond the scope of this paper are still needed.
Table A1Alternate saltation particle size bin configuration and associated attributes recommended for use with the AFWA scheme. Values are presented here in µm but handled in units of centimeters within the model.
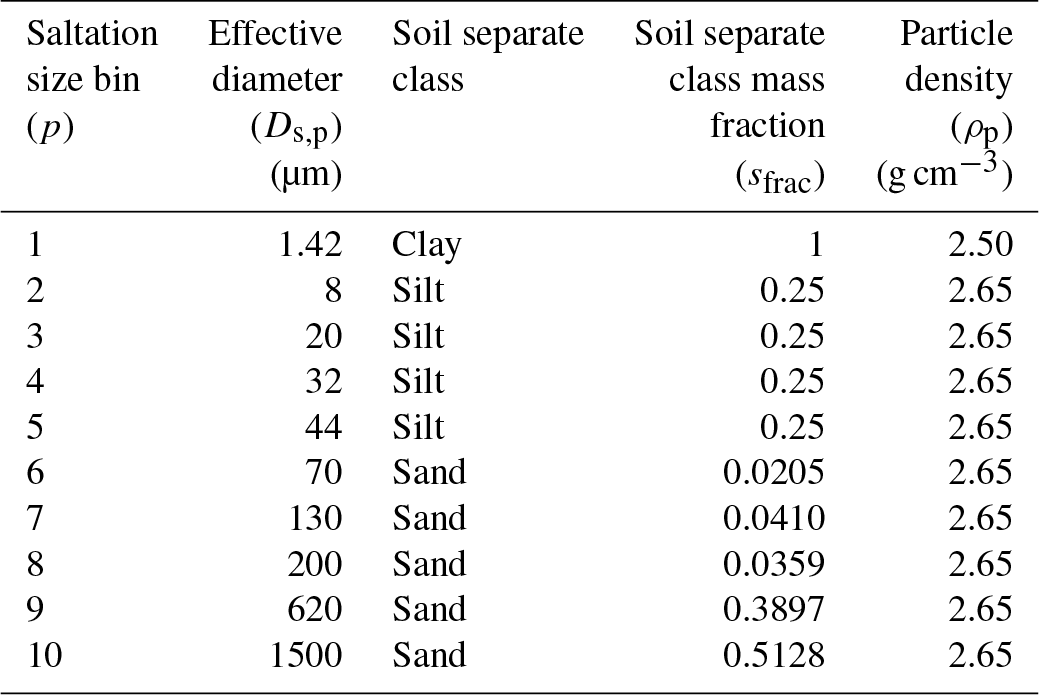

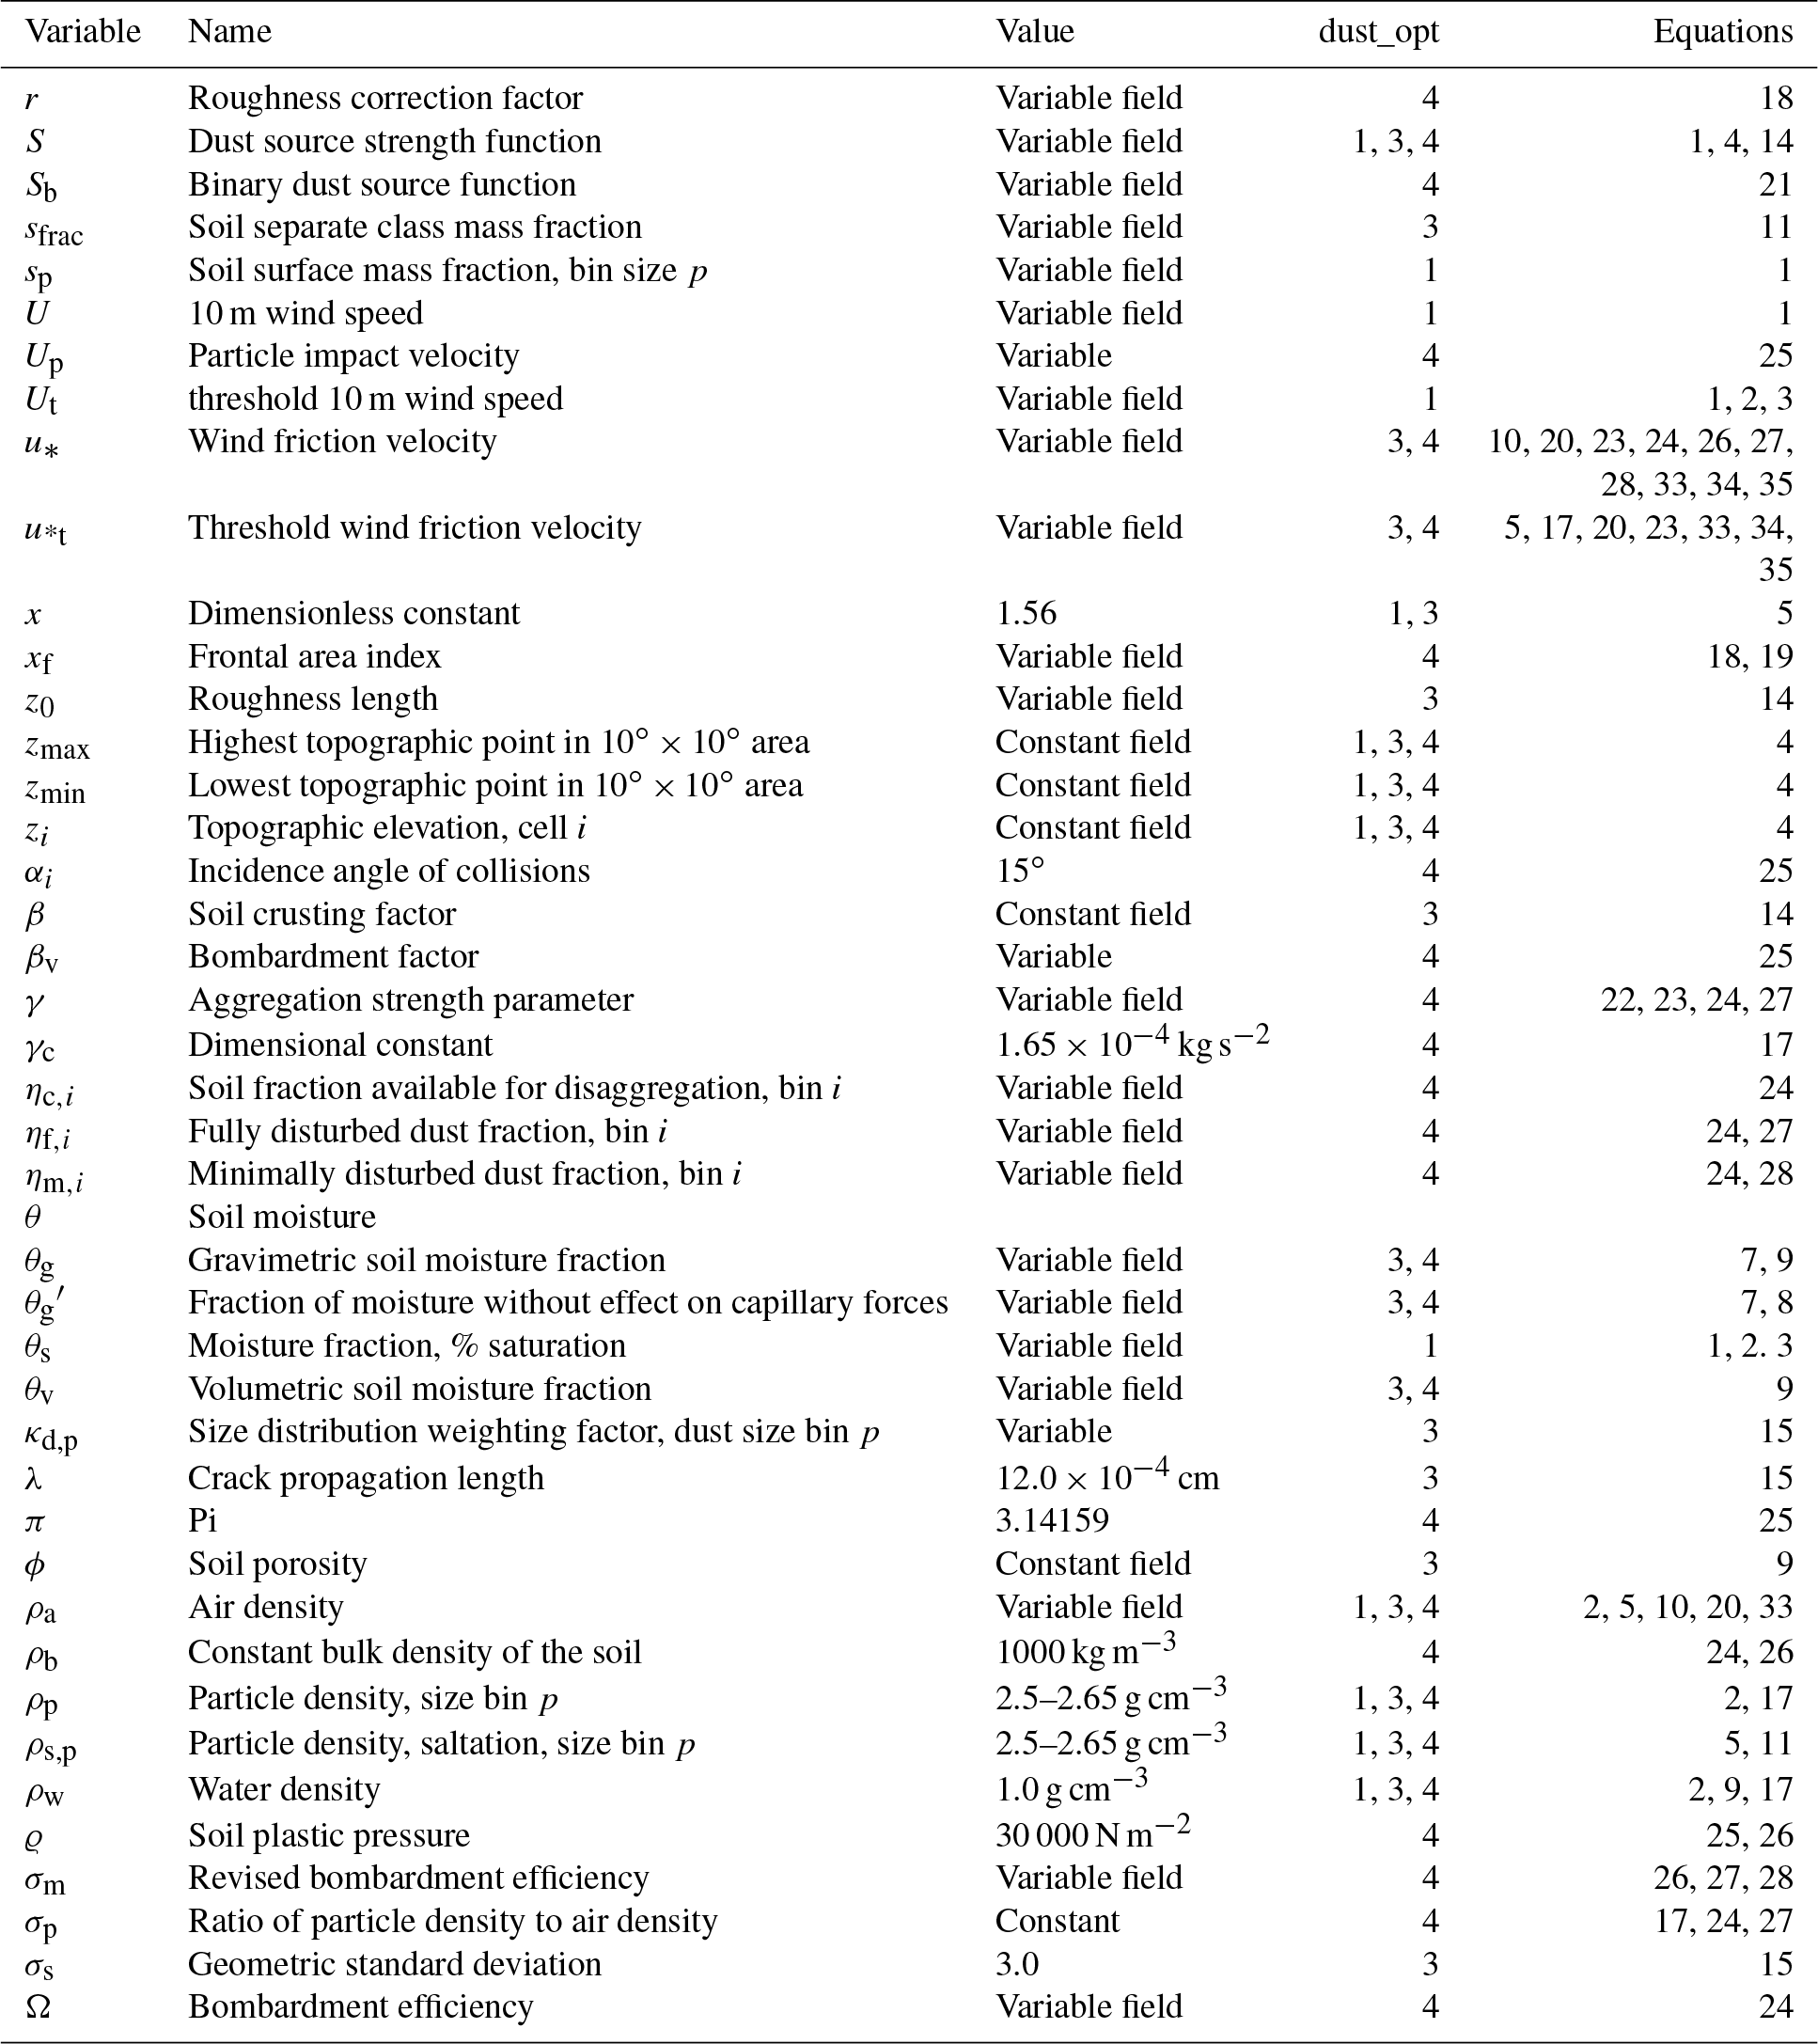
SLL and GAC developed the AFWA dust emission scheme. JDC supervised project execution of the AFWA scheme code development. GAC and SEP implemented the AFWA scheme code into the WRF-Chem framework. TWL conducted and post-processed the WRF-Chem case study simulations. SLL, CP, and TWL analyzed data and primarily wrote the manuscript. All co-authors critically reviewed the manuscript.
The authors declare that they have no conflict of interest.
Funding support for this project was provided by the U.S. Army Terrestrial
Environmental Modeling & Intelligence System Science Technology
Objective–Research (ARTEMIS STO-R) 053HJ0/FAN U4357509, “Dynamic Undisturbed
Soils Testbed to Characterize Local Origins and Uncertainties of Dust
(DUST-CLOUD)”, applied science research program sponsored by the Assistant
Secretary of the Army for Acquisition, Logistics, and Technology (ASA-ALT).
Access to CALIOP and MODIS data was provided by the NASA Earth Data Portal at
https://search.earthdata.nasa.gov/ (last access: June 2017).
Edited by: Olaf Morgenstern
Reviewed by: two anonymous referees
Alfaro, S. C., Gaudichet, A., Gomes, L., and Maillé, M.: Modeling the size distribution of a soil aerosol produced by sandblasting, J. Geophys. Res.-Atmos., 102, 11239–11249, https://doi.org/10.1029/97JD00403, 1997. a, b
Alfaro, S. C., Gaudichet, A., Gomes, L., and Maillé, M.: Mineral aerosol production by wind erosion: aerosol particle sizes and binding energies, Geophys. Res. Lett., 25, 991–994, https://doi.org/10.1029/98GL00502, 1998. a
Al-Hemoud, A., Al-Sudairawi, M., Neelamanai, S., Naseeb, A., and Behbehani, W.: Socioeconomic effect of dust storms in Kuwait, Arab. J. Geosci., 10, 18, doi:10.1007/s12517-016-2816-9, 2017. a
Alizadeh Choobari, O., Zawar-Reza, P., and Sturman, A.: Low level jet intensification by mineral dust aerosols, Ann. Geophys., 31, 625–632, https://doi.org/10.5194/angeo-31-625-2013, 2013. a
Bagnold, R. A.: The physics of blown sand and desert dunes, Chapmann and Hall, Methuen, London, 265 pp., 1941. a, b, c, d
Barnard, J. C., Fast, J. D., Paredes-Miranda, G., Arnott, W. P., and Laskin, A.: Technical Note: Evaluation of the WRF-Chem “Aerosol Chemical to Aerosol Optical Properties” Module using data from the MILAGRO campaign, Atmos. Chem. Phys., 10, 7325–7340, https://doi.org/10.5194/acp-10-7325-2010, 2010. a
Barnum, B. H., Winstead, N. S., Wesely, J., Hakola, A., Colarco, P. R., Toon, O. B., Ginoux, P., Brooks, G., Hasselbarth, L., and Toth, B.: Forecasting dust storms using the CARMA-Dust Model and MM5 weather data, Environ. Model. Softw., 19, 129–140, https://doi.org/10.1016/S1364-8152(03)00115-4, 2004. a, b
Beljaars, A. C. M.: The parameterization of surface fluxes in large-scale models under free convection, Q. J. Roy. Meteor. Soc., 121, 255–270, https://doi.org/10.1002/qj.49712152203, 1994. a
Bian, H., Tie, X., Cao, J., Ying, Z., Han, S., and Xue, Y.: Analysis of a severe dust storm event over China: Application of the WRF-Dust model, Aerosol Air Qual. Res., 11, 419–428, https://doi.org/10.4209/aaqr.2011.04.0053, 2011. a
Boucher, O., Randall, D., Artaxo, P., Bretherton, C., Feingold, G., Forster, P., Kerminen, V. M., Kondo, Y., Liao, H., Lohmann, U., and Rasch, P.: Clouds and aerosols, in: Climate Change 2013: The Physical Science Basis. Contribution of Working Group I to the Fifth Assessment Report of the Intergovernmental Panel on Climate Change, edited by: Stocker, T. F., Qin, D., Plattner, G.-K., Tignor, M., Allen, S. K., Boschung, J., Nauels, A., Xia, Y., Bex, V., and Midgley, P. M., Cambridge University Press, Cambridge, United Kingdom and New York, NY, USA, 571–657, 2013. a
Bullard, J. E., McTainsh, G. H., and Pudmenzky, C.: Factors affecting the nature and rate of dust production from natural dune sands, Sedimentology, 54, 169–182, https://doi.org/10.1111/j.1365-3091.2006.00827.x, 2007. a
Chappell, A., Warren, A., O'Donoghue, A., Robinson, A., Thomas, A., and Bristow, C.: The implications for dust emission modeling of spatial and vertical variations in horizontal dust flux and particle size in the Bodélé Depression, Northern Chad, J. Geophys. Res.-Atmos., 113, D04214, https://doi.org/10.1029/2007JD009032, 2008. a
Chen, S., Zhao, C., Qian, Y., Leung, L. R., Huang, J., Huang, Z., Bi, J., Zhang, W., Shi, J., Yang, L., and Li, D.: Regional modeling of dust mass balance and radiative forcing over East Asia using WRF-Chem, Aeolian Res., 15, 15–30, https://doi.org/10.1016/j.aeolia.2014.02.001, 2014. a
Chepil, W. S.: Dynamics of wind erosion: I. Nature of movement of soil by wind, Soil Sci., 60, 305–320, 1945. a
Chin, M., Savoie, D. L., Huebert, B. J., Bandy, A. R., Thornton, D. C., Bates, T. S., Quinn, P. K., Saltzman, E. S., and De Bruyn, W. J.: Atmospheric sulfur cycle simulated in the global model GOCART: Comparison with field observations and regional budgets, J. Geophys. Res.-Atmos., 105, 24689–24712, https://doi.org/10.1029/2000JD900385, 2000. a, b
Colarco, P., da Silva, A., Chin, M., and Diehl, T.: Online simulations of global aerosol distributions in the NASA GEOS-4 model and comparisons to satellite and ground-based aerosol optical depth, J. Geophys. Res.-Atmos. 115, D14207, https://doi.org/10.1029/2009JD012820, 2010. a
Colarco, P. R., Toon, O. B., and Holben, B. N.: Saharan dust transport to the Caribbean during PRIDE: 1. Influence of dust sources and removal mechanisms on the timing and magnitude of downwind aerosol optical depth events from simulations of in situ and remote sensing observations, J. Geophys. Res.-Atmos., 108, 8589, https://doi.org/10.1029/2002JD002658, 2003a. a, b, c, d, e
Colarco, P. R., Toon, O. B., Reid, J. S., Livingston, J. M., Russell, P. B., Redemann, J., Schmid, B., Maring, H. B., Savoie, D., Welton, E. J., and Campbell, J. R.: Saharan dust transport to the Caribbean during PRIDE: 2. Transport, vertical profiles, and deposition in simulations of in situ and remote sensing observations, J. Geophys. Res.-Atmos., 108, 8590, https://doi.org/10.1029/2002JD002659, 2003b. a
Cremades, P. G., Fernández, R. P., Alllende, D. G., Mulena, G. C., and Puliafito, S. E.: High resolution satellite derived erodibility factors for WRF/Chem windblown dust simulations in Argentina, Atmósfera, 30, 11–25, https://doi.org/10.20937/atm.2017.30.01.02, 2017. a
Darmenova, K., Sokolik, I. N., Shao, Y., Marticorena, B., and Bergametti, G.: Development of a physically based dust emission module within the Weather Research and Forecasting (WRF) model: Assessment of dust emission parameterizations and input parameters for source regions in Central and East Asia, J. Geophys. Res.-Atmos., 114, D14201, https://doi.org/10.1029/2008JD011236, 2009. a, b, c, d, e
Defries, R. S. and Townshend, J. R. G.: Global land cover characterization from satellite data: from research to operational implementation?, Global Ecol. Biogeogr., 8, 367–379, https://doi.org/10.1046/j.1365-2699.1999.00139.x, 1999. a
De Longueville, F., Hountondji, Y.-C., Henry, S., and Ozer, P.: What do we know about effects of desert dust on air quality and human health in West Africa compared to other regions?, Sci. Total Environ., 409, 1–8, https://doi.org/10.1016/j.scitotenv.2010.09.025, 2010. a
DeMott, P. J., Prenni, A. J., Liu, X., Kreidenweis, S. M., Petters, M. D., Twohy, C. H., Richardson, M. S., Eidhammer, T., and Rogers, D. C.: Predicting global atmospheric ice nuclei distributions and their impacts on climate, Proc. Natl. Acad. Sci. USA, 107, 11217–11222, https://doi.org/10.1073/pnas.0910818107, 2010. a
Dipu, S., Prabha, T. V., Pandithurai, G., Dudhia, J., Pfister, G., Rajesh, K., and Goswami, B. N.: Impact of elevated aerosol layer on the cloud macrophysical properties prior to monsoon onset, Atmos. Environ., 70, 454–467, https://doi.org/10.1016/j.atmosenv.2012.12.036, 2013. a
Fast, J. D., Gustafson Jr., W. I., Easter, R. C., Zaveri, R. A., Barnard, J. C., Chapman, E. G., Grell, G. A., and Peckham, S. E.: Evolution of ozone, particulates, and aerosol direct forcing in an urban area using a new fully-coupled meteorology, chemistry, and aerosol model, J. Geophys. Res., 111, D21305, https://doi.org/10.1029/2005JD006721, 2006. a, b
Fécan, F., Marticorena, B., and Bergametti, G.: Parametrization of the increase of the aeolian erosion threshold wind friction velocity due to soil moisture for arid and semi-arid areas, Ann. Geophys., 17, 149–157, https://doi.org/10.1007/s00585-999-0149-7, 1999. a, b, c, d
Flaounas, E., Kotroni, V., Lagouvardos, K., Klose, M., Flamant, C., and Giannaros, T. M.: Assessing atmospheric dust modelling performance of WRF-Chem over the semi-arid and arid regions around the Mediterranean, Atmos. Chem. Phys. Discuss., https://doi.org/10.5194/acp-2016-307, 2016. a
Fountoukis, C., Ackermann, L., Ayoub, M. A., Gladich, I., Hoehn, R. D., and Skillern, A.: Impact of atmospheric dust emission schemes on dust production and concentration over the Arabian Peninsula, Model. Earth Syst. Environ., 2, 115, https://doi.org/10.1007/s40808-016-0181-z, 2016. a
Freitas, S. R., Longo, K. M., Alonso, M. F., Pirre, M., Marecal, V., Grell, G., Stockler, R., Mello, R. F., and Sánchez Gácita, M.: PREP-CHEM-SRC – 1.0: a preprocessor of trace gas and aerosol emission fields for regional and global atmospheric chemistry models, Geosci. Model Dev., 4, 419–433, https://doi.org/10.5194/gmd-4-419-2011, 2011. a
Gillette, D. A. and Passi, R.: Modeling dust emission caused by wind erosion, J. Geophys. Res.-Atmos., 93, 14233–14242, https://doi.org/10.1029/JD093iD11p14233, 1988. a, b
Gillette, D. A.: Production of dust that may be carried great distances, in: Desert Dust: Origin, Characteristics, and Effect on Man, edited by: Pewe, T. L., Spec. Pap. Geol. Soc. Am., 86, 11–26, 1981. a
Ginoux, P., Chin, M., Tegen, I., Prospero, J. M., Holben, B., Dubovik, O., and Lin, S. J.: Sources and distributions of dust aerosols simulated with the GOCART model. J. Geophys. Res.-Atmos., 106, 20255–20273, https://doi.org/10.1029/2000JD000053, 2001. a, b, c, d, e, f, g, h, i, j, k, l, m, n, o, p, q, r, s
Ginoux, P., Prospero, J. M., Torres, O., and Chin, M.: Long-term simulation of global dust distribution with the GOCART model: correlation with North Atlantic Oscillation, Environ. Modell. Softw., 19, 113–128, https://doi.org/10.1016/S1364-8152(03)00114-2, 2004. a
Gong, S. L.: A parameterization of sea-salt aerosol source function for sub-and super-micron particles, Global Biogeochem. Cy., 17, 1097–1104, https://doi.org/10.1029/2003GB002079, 2003. a, b
Gong, S. L., Zhang, X. Y., Zhao, T. L., McKendry, I. G., Jaffe, D. A., and Lu, N. M.: Characterization of soil dust aerosol in China and its transport and distribution during 2001 ACE-Asia: 2. Model simulation and validation, J. Geophys. Res.-Atmos., 108, 4262, https://doi.org/10.1029/2002JD002633, 2003.
Goudie, A. S. and Middleton, N. J.: Desert Dust in the Global System, Springer, Berlin, 2006. a
Grell, G. A., Peckham, S. E., Schmitz, R., McKeen, S. A., Frost, G., Skamarock, W. C., and Eder, B.: Fully coupled “online” chemistry within the WRF model, Atmos. Environ., 39, 6957–6975, https://doi.org/10.1016/j.atmosenv.2005.04.027, 2005. a, b
Huang, J., Wang, T., Wang, W., Li, Z., and Yan, H.: Climate effects of dust aerosols over East Asian arid and semiarid regions, J. Geophys. Res.-Atmos., 119, 11398–11416, https://doi.org/10.1002/2014JD021796, 2014. a
Hunt, E., Adams-Selin, R. Jones, S. L., and Creighton G.: Using a modified Fécan soil moisture calculation to predict dust emissions over semi-arid and arid regions, paper presented at the 15th Annual WRF Users Workshop, National Center for Atmospheric Research, Boulder, CO, June 2014, available at: http://www2.mmm.ucar.edu/wrf/users/workshops/WS2014/ppts/5B.4.pdf (last access: May 2018), 2014. a
Iacono, M. J., Delamere, J. S., Mlawer, E. J., Shephard, M. W., Clough, S. A., and Collins, W. D.: Radiative forcing by long-lived greenhouse gases: Calculations with the AER radiative transfer models, J. Geophys. Res.-Atmos., 113, D13103, https://doi.org/10.1029/2008JD009944, 2008. a
In, H. J. and Park, S. U.: A simulation of long-range transport of Yellow Sand observed in April 1998 in Korea, Atmos. Environ., 36, 4173–4187, https://doi.org/10.1016/S1352-2310(02)00361-8, 2002. a
Iversen, J. D. and White, B. R.: Saltation threshold on Earth, Mars and Venus, Sedimentology, 29, 111–119, https://doi.org/10.1111/j.1365-3091.1982.tb01713.x, 1982. a
Jish Prakash, P., Stenchikov, G., Kalenderski, S., Osipov, S., and Bangalath, H.: The impact of dust storms on the Arabian Peninsula and the Red Sea, Atmos. Chem. Phys., 15, 199–222, https://doi.org/10.5194/acp-15-199-2015, 2015. a
Kain, J. S.: The Kain-Fritsch convective parameterization: an update, J. Appl. Meteorol., 43, 170–181, https://doi.org/10.1175/1520-0450(2004)043<0170:TKCPAU>2.0.CO;2, 2004. a
Kalenderski, S., Stenchikov, G. L., and Zhao, C.: Modeling a typical winter-time dust event over the Arabian Peninsula and the Red Sea, Atmos. Chem. Phys., 13, 1999–2013, https://doi.org/10.5194/acp-13-1999-2013, 2013. a
Kalenderski, S. and Stenchikov, G.: High-resolution regional modeling of summertime transport and impact of African dust over the Red Sea and Arabian Peninsula, J. Geophys. Res.-Atmos., 121, 6435–6458, https://doi.org/10.1002/2015JD024480, 2016. a
Kawamura, R.: Study on sand movement by wind, Inst. Sci. Technol., Rep. 5, 95–112, Tokyo, 1951. a, b
Klose, M. and Shao, Y.: Stochastic parameterization of dust emission and application to convective atmospheric conditions, Atmos. Chem. Phys., 12, 7309–7320, https://doi.org/10.5194/acp-12-7309-2012, 2012. a
Klose, M. and Shao, Y.: Large-eddy simulation of turbulent dust emission, Aeolian Res., 8, 49–58, https://doi.org/10.1016/j.aeolia.2012.10.010, 2013. a
Klose, M., Shao, Y., Li, X., Zhang, H., Ishizuka, M., Mikami, M., and Leys, J. F.: Further development of a parameterization for convective turbulent dust emission and evaluation based on field observations, J. Geophys. Res.-Atmos., 119, 10441–10457, https://doi.org/10.1002/2014JD021688, 2014. a
Knippertz, P. and Stuut, J.-B. W. (Eds.): Mineral Dust: A Key Player in the Earth System, Springer Dordrecht Heidelberg New York London, https://doi.org/10.1007/978-94-017-8978-3, 2014. a, b
Kok, J. F.: A scaling theory for the size distribution of emitted dust aerosols suggests climate models underestimate the size of the global dust cycle, Proc. Natl. Acad. Sci. USA, 108, 1016–1021, https://doi.org/10.1073/pnas.1014798108, 2011. a, b
Kok, J. F., Parteli, E. J., Michaels, T. I., and Karam, D. B.: The physics of wind-blown sand and dust, Rep. Prog. Phys., 75, 106901, https://doi.org/10.1088/0034-4885/75/10/106901, 2012. a
Kumar, R., Barth, M. C., Pfister, G. G., Naja, M., and Brasseur, G. P.: WRF-Chem simulations of a typical pre-monsoon dust storm in northern India: influences on aerosol optical properties and radiation budget, Atmos. Chem. Phys., 14, 2431–2446, https://doi.org/10.5194/acp-14-2431-2014, 2014. a
Letcher, T. W. and LeGrand, S. L.: A comparison of simulated dust produced by three dust-emission schemes in WRF-Chem, ERDC/CRREL TR-18-13, U.S. Army Engineer Research and Development Center, Hanover, New Hampshire, USA, 2018. a
Liu, M., Westphal, D. L., Wang, S., Shimizu, A., Sugimoto, N., Zhou, J., and Chen, Y.: A high-resolution numerical study of the Asian dust storms of April 2001, J. Geophys. Res.-Atmos., 108, 8653, https://doi.org/10.1029/2002JD003178, 2003. a
Liu, M., Westphal, D. L., Walker, A. L., Holt, T. R., Richardson, K. A., and Miller, S. D.: COAMPS real-time dust storm forecasting during Operation Iraqi Freedom, Weather Forecast., 22, 192–206, https://doi.org/10.1175/WAF971.1, 2007. a
Liu, Z., Liu, Q., Lin, H.-C., Schwartz, C. S., Lee, Y.-H., and Wang, T.: Three?dimensional variational assimilation of MODIS aerosol optical depth: Implementation and application to a dust storm over East Asia, J. Geophys. Res.-Atmos., 116, D23206, https://doi.org/10.1029/2011JD016159, 2011. a
Lu, H. and Shao, Y.: A new model for dust emission by saltation bombardment, J. Geophys. Res.-Atmos., 104, 16827–16842, https://doi.org/10.1029/1999JD900169, 1999. a
Lu, S., da Silva, A. M., Chin, M., Wang, J., Moorthi, S., Juang, H., Chuang, H.-Y., Tang, Y., Jones, L., Iredell, M., and McQueen, J. T.: The NEMS GFS aerosol component; NCEP's global aerosol forecast system, NCEP Office Note 472, 2013. a
Lyapustin, A. and Wang, Y.: MCD19A2 MODIS/Terra+Aqua Land Aerosol Optical Depth Daily L2G Global 1km SIN Grid V006, distributed by NASA EOSDIS Land Processes DAAC, https://doi.org/10.5067/MODIS/MCD19A2.006, 2018. a
Mahowald, N., Albani, S., Kok, J. F., Engelstaeder, S., Scanza, R., Ward, D. S., and Flanner M. G.: The size distribution of desert dust aerosols and its impact on the Earth system, Aeolian Res., 15, 53–71, https://doi.org/10.1016/j.aeolia.2013.09.002, 2014. a
Mahowald, N. M., Baker, A. R., Bergametti, G., Brooks, N., Duce, R. A., Jickells, T. D., Kubilay, N., Prospero, J. M., and Tegen, I.: Atmospheric global dust cycle and iron inputs to the ocean, Global Biogeochem. Cy., 19, GB4025, https://doi.org/10.1029/2004GB002402, 2005. a
Mahowald, N. M., Kloster, S., Engelstaedter, S., Moore, J. K., Mukhopadhyay, S., McConnell, J. R., Albani, S., Doney, S. C., Bhattacharya, A., Curran, M. A. J., Flanner, M. G., Hoffman, F. M., Lawrence, D. M., Lindsay, K., Mayewski, P. A., Neff, J., Rothenberg, D., Thomas, E., Thornton, P. E., and Zender, C. S.: Observed 20th century desert dust variability: impact on climate and biogeochemistry, Atmos. Chem. Phys., 10, 10875–10893, https://doi.org/10.5194/acp-10-10875-2010, 2010. a
Marticorena, B. and Bergametti, G.: Modeling the atmospheric dust cycle: 1. Design of a soil-derived dust emission scheme, J. Geophys. Res.-Atmos., 100, 16415–16430, https://doi.org/10.1029/95JD00690, 1995. a
Marticorena, B., Bergametti, G., Aumont, B., Callot, Y., N'doumé, C., and Legrand, M.: Modeling the atmospheric dust cycle: 2. Simulation of Saharan dust sources, J. Geophys. Res.-Atmos., 102, 4387–4404, https://doi.org/10.1029/96JD02964, 1997. a, b
McDonald, E. V. and Caldwell, T. G.: Geochemical characteristics of Iraqi dust and soil samples and related impacts to weapon malfunctions, in: Military Geography and Geology: History and Technology, edited by: Nathanail, C. P., Abrahart, R. J., and Bradshaw, R. P., Land Quality Press, Nottingham, 258–265, 2008. a
Middleton, N. J.: Desert dust hazards: A global review, Aeolian Res., 24, 53–63, https://doi.org/10.1016/j.aeolia.2016.12.001, 2017. a
Miller, S. D.: A consolidated technique for enhancing desert dust storms with MODIS, Geophys. Res. Lett., 30, 2071, https://doi.org/10.1029/2003GL018279, 2003. a, b
Mitchell, K.: The community Noah land surface model (LSM), User's Guide, available at: ftp://ftp.emc.ncep.noaa.gov/mmb/gcp/ldas/noahlsm/ver_2.7.1 (last access: May 2018), 2005. a
Nabavi, S. O., Haimberger, L., and Samimi, C.: Sensitivity of WRF-chem predictions to dust source function specification in West Asia, Aeolian Res., 24, 115–131, https://doi.org/10.1016/j.aeolia.2016.12.005, 2017. a
Nakanishi, M. and Niino, H.: An improved Mellor-Yamada level-3 model: Its numerical stability and application to a regional prediction of advection fog, Bound.-Layer Meteor., 119, 397–407, https://doi.org/10.1007/s10546-005-9030-8, 2006. a
Nickovic, S., Kallos, G., Papadopoulos, A., and Kakaliagou, O.: A model for prediction of desert dust cycle in the atmosphere, J. Geophys. Res.-Atmos., 106, 18113–18129, https://doi.org/10.1029/2000JD900794, 2001. a
NOAA/NCEP (National Centers for Environmental Prediction/National Weather Service/NOAA/U.S. Department of Commerce): NCEP FNL Operational Model Global Tropospheric Analyses, continuing from July 1999, Research data archive at the National Center for Atmospheric Research, Computational and Information Systems Laboratory, Boulder, CO, https://doi.org/10.5065/D6M043C6 (last access: July 2017), 2000. a
Okin, G. S., Bullard, J. E., Reynolds, R. L., Ballantine, J. A. C., Schepanski, K., Todd, M. C., Belnap, J., Baddock, M. C., Gill, T. E., and Miller, M. E.: Dust: Small-scale processes with global consequences. Eos, Trans. Amer. Geophys. Union, 92, 241–242, https://doi.org/10.1029/2011EO290001, 2011. a
Owen, P. R.: Saltation of uniform grains in air, J. Fluid Mech., 20, 225–242, 1964. a
Park, S. H., Gong, S. L., Zhao, T. L., Vet, R. J., Bouchet, V. S., Gong, W., Makar, P. A., Moran, M. D., Stroud, C., and Zhang, J.: Simulation of entrainment and transport of dust particles within North America in April 2001 (“Red Dust Episode”), J. Geophys. Res., 112, D20209, https://doi.org/10.1029/2007JD008443, 2007. a
Peckham, S. E., Fast, J., Schmitz, R., Grell, G. A., Gustafson, W. I., McKeen, S. A., Ghan, S. J., Zaveri, R., Easter, R. C., Barnard, J., and Chapman, E.: WRF/Chem Version 3.3 User's Guide, NOAA Technical Memo, 2011. a, b
Peters-Lidard, C. D., Kemp, E. M., Matsui, T., Santanello Jr., J. A., Kumar, S. V., Jacob, J. P., Clune, T., Tao, W.-K., Chin, M., Hou, A., Case, J. L., Kim, D., Kim, K.-M., Lau, W., Liu, Y., Shi, J., Starr, D., Tan, Q., Tao, Z., Zaitchik, B. F., Zavodsky, B., Zhang, S. Q., and Zupanski, M.: Integrated modeling of aerosol, cloud, precipitation and land processes at satellite-resolved scales, Environ. Model. Softw., 67, 149–159, https://doi.org/10.1016/j.envsoft.2015.01.007, 2015. a
Raupach, M.: Drag and drag partition on rough surfaces, Bound.-Lay. Meteor., 60, 375–395, https://doi.org/10.1007/BF00155203, 1992. a
Ravi, S., D'odorico, P., Breshears, D. D., Field, J. P., Goudie, A. S., Huxman, T. E., Li, J., Okin, G. S., Swap, R. J., Thomas, A. D., Van Pelt, S., Whicker, J. J., and Zobeck, T.: Aeolian processes and the biosphere, Rev. Geophys., 49, RG3001, https://doi.org/10.1029/2010RG000328, 2011. a
Reynolds, C. A., Jackson, T. J., and Rawls, W. J.: Estimating soil water-holding capacities by linking the Food and Agriculture Organization soil map of the world with global pedon databases and continuous pedotransfer functions, Water Resour. Res., 36, 3653–3662, https://doi.org/10.1029/2000WR900130, 2000. a, b, c
Rizza, U., Anabor, V., Mangia, C., Miglietta, M. M., Degrazia, G. A., and Passerini, G.: WRF-Chem simulation of a saharan dust outbreak over the mediterranean regions, Ciência e Natura, 38, 330–336, https://doi.org/10.5902/2179460X20249, 2016. a
Rushing, J. F., Harrison, J. A., and Tingle, J., S.: Evaluation of application methods and products for mitigating dust for lines-of-communication and base camp operations, ERDC/GSL TR-05-9, U.S. Army Engineer Research and Development Center, Waterways Experiment Station, Vicksburg, Mississippi, USA, 2005. a
Saha, S., Moorthi, S., Pan, H.-L., Wu, X., Wang, J., Nadiga, S., Tripp, P., Kistler, R., Woollen, J., Behringer, D., Liu, H., Stokes, D., Grumbine, R., Gayno, G., Wang, J., Hou, Y.-T., Chuang, H., Juang, H.-M. H., Sela, J., Iredell, M., Treadon, R., Kleist, D., Van Delst., P., Keyser, D., Derber, J., Ek., M., Meng, J., Wei., H., Yang, R., Lord, S., van den Dool, H., Kumar, A., Wang, W., Long, C., Chelliah, M., Xue, Y., Huang, B., Schemm, J.-K., Ebisuzaki, W., Lin, R., Xie, P., Chen, M., Zhou, S., Higgins, W., Zou, C.-Z., Liu, Q., Chen, Y., Han, Y., Cucurull, L., Reynolds., R. W., Rutledge, G., and Goldberg, M.: The NCEP climate forecast system reanalysis, B. Am. Meteorol. Soc., 91, 1015–1058, https://doi.org/10.1175/2010BAMS3001.1, 2010. a
Shao, Y.: A model for mineral dust emission, J. Geophys. Res.-Atmos., 106, 20239–20254, https://doi.org/10.1029/2001JD900171, 2001. a, b, c, d
Shao, Y.: Simplification of a dust emission scheme and comparison with data, J. Geophys. Res.-Atmos., 109, D10202, https://doi.org/10.1029/2003JD004372, 2004. a, b
Shao, Y. P.: Physics and Modelling of Wind Erosion, Springer, Heidelberg, 2008. a
Shao, Y. and Lu, H.: A simple expression for wind erosion threshold friction velocity, J. Geophys. Res.-Atmos., 105, 22437–22443, https://doi.org/10.1029/2000JD900304, 2000. a, b, c, d, e
Shao, Y., Ishizuka, M., Mikami, M., and Leys, J. F.: Parameterization of size-resolved dust emission and validation with measurements, J. Geophys. Res.-Atmos., 116, D08203, https://doi.org/10.1029/2010JD014527, 2011 a, b
Shepherd, G., Terradellas, E., Baklanov, A., Kang, U., Sprigg, W., Nickovic, S., Boloorani, A. D., Al-Dousari, A., Basart, S., Benedetti, A., and Sealy, A.: Global assessment of sand and dust storms, United Nations Environment Programme, Nairobi, 2016. a
Shinn, E. A., Smith, G. W., Prospero, J. M., Betzer, P., Hayes, M. L., Garrison, V., and Barber, R. T.: African dust and the demise of Caribbean coral reefs, Geophys. Res. Lett., 27, 3029–3032, https://doi.org/10.1029/2000GL011599, 2000. a
Sinclair, S. N. and Jones, S. L.: Subjective mapping of dust emission sources by using MODIS imagery: Reproducibility assessment, ERDC/CRREL TR-17-8, U.S. Army Engineer Research and Development Center, Hanover, New Hampshire, USA, 2017. a
Skamarock, W. C., Klemp, J. B., Dudhia, J., Gill, D. O., Barker, D. M., Duda, M. G., Huang, X.-Y., Wang, W., and Powers, J. G.: A description of the Advanced Research WRF Version 3, NCAR technical note, Mesoscale and Microscale Meteorology Division, National Center for Atmospheric Research, Boulder, Colorado, USA, 2008. a
Skiles, S. M., Painter, T. H., Belnap, J., Holland, L., Reynolds, R. L., Goldstein, H. L., and Lin, J.: Regional variability in dust-on-snow processes and impacts in the Upper Colorado River Basin, Hydrol. Process., 29, 5397–5413, https://doi.org/10.1002/hyp.10569, 2015. a
Sprigg, W. A., Nickovic, S., Galgiani, J. N., Pejanovic, G., Petkovic, S., Vujadinovic, M., Vukovic, A., Dacic, M., DiBiase, S., Prasad, A., and El-Askary, H.: Regional dust storm modeling for health services: the case of valley fever, Aeolian Res., 14, 53–73, https://doi.org/10.1016/j.aeolia.2014.03.001, 2014. a, b
Su, L. and Fung, J. C. H.: Sensitivities of WRF-Chem to dust emission schemes and land surface properties in simulating dust cycles during springtime over East Asia, J. Geophys. Res.-Atmos., 120, 11215–11230, https://doi.org/10.1002/2015JD023446, 2015. a
Tanaka, T. Y. and Chiba, M.: Global simulation of dust aerosol with a chemical transport model, MASINGAR, J. Meteor. Soc. Japan, 83, 255–278, https://doi.org/10.2151/jmsj.83A.255, 2005. a
Tegen, I. and Fung, I.: Modeling of mineral dust in the atmosphere: Sources, transport, and optical thickness, J. Geophys. Res.-Atmos., 99, 22897–22914, https://doi.org/10.1029/94JD01928, 1994. a, b, c, d, e
Teixeira, J. C., Carvalho, A. C., Tuccella, P., Curci, G., and Rocha, A.: WRF-chem sensitivity to vertical resolution during a saharan dust event, Phys. Chem. Earth, Parts A/B/C, 94, 188–195, https://doi.org/10.1016/j.pce.2015.04.002, 2016. a
Tewari, M., Chen, F., Wang, W., Dudhia, J., LeMone, M. A., Mitchell, K., Ek, M., Gayno, G., Wegiel, J., and Cuenca, R. H.: Implementation and verification of the unified NOAH land surface model, 20th Conference on Weather Analysis and Forecasting/16th Conference on Numerical Weather Prediction, Seattle, WA, American Meteorological Society, 10–15 January, 2004. a
Thompson, G., Field, P. R., Rasmussen, R. M., and Hall, W. D.: Explicit forecasts of winter precipitation using an improved bulk microphysics scheme. Part II: Implementation of a new snow parameterization, Mon. Weather Rev., 136, 5095–5115, https://doi.org/10.1175/2008MWR2387.1, 2008. a
Uzan, L., Egert, S., and Alpert, P.: Ceilometer evaluation of the eastern Mediterranean summer boundary layer height – first study of two Israeli sites, Atmos. Meas. Tech., 9, 4387–4398, https://doi.org/10.5194/amt-9-4387-2016, 2016. a
Wang, F., Zhao, X., Gerlein-Safdi, C., Mu, Y., Wang, D., and Lu, Q.: Global sources, emissions, transport and deposition of dust and sand and their effects on the climate and environment: a review, Front. Environ. Sci. Eng., 11, 13, https://doi.org/10.1007/s11783-017-0904-z, 2017. a
Wang, K., Zhang, Y., Yahya, K., Wu, S. Y., and Grell, G.: Implementation and initial application of new chemistry-aerosol options in WRF/Chem for simulating secondary organic aerosols and aerosol indirect effects for regional air quality, Atmos. Environ., 115, 716–732, https://doi.org/10.1016/j.atmosenv.2014.12.007, 2015. a
Wang, W., Bruyère, C., Duda, M., Dudhia, J., Gill, D., Michael, K., Keene, K., Chen, M., Lin, H.-C., Michalakes, J., Rizvi, S., Zhang, X., Berner, J., Soyoung, H., and Fossell, K.: Guide for the Advanced Research WRF (ARW) Modeling System Version 3.9, NCAR technical note, Mesoscale and Microscale Meteorology Division, National Center for Atmospheric Research, Boulder, Colorado, USA, 2017. a
Wang, Z., Ueda, H., and Huang, M., Y.: A deflation module for use in modeling long-range transport of yellow sand over East Asia, J. Geophys. Res., 105, 26947–26959, https://doi.org/10.1029/2000JD900370, 2000. a
Webb, N. P., Chappell, A., Strong, C. L., Marx, S. K., and McTainsh, G. H.: The significance of carbon-enriched dust for global carbon accounting, Global Change Biol., 18, 3275–3278, https://doi.org/10.1111/j.1365-2486.2012.02780.x, 2012. a
White, B. R.: Soil transport by winds on Mars, J. Geophys. Res.-Solid Earth, 84, 4643–4651, https://doi.org/10.1029/JB084iB09p04643, 1979. a, b
Winker, D. M., Vaughan, M. A., Omar, A., Hu, Y., Powell, K. A., Liu, Z., Hunt, W. H., and Young, S. A.: Overview of the CALIPSO mission and CALIOP data processing algorithms, J. Atmos. Ocean. Technol., 26, 2310–2323, https://doi.org/10.1175/2009JTECHA1281.1, 2009. a
Woodward, S.: Modeling the atmospheric life cycle and radiative impact of mineral dust in the Hadley Centre climate model, J. Geophys. Res., 106, 18155–18166, https://doi.org/10.1029/2000JD900795, 2001. a
Young, S. A. and Vaughan, M. A.: The retrieval of profiles of particulate extinction from Cloud–Aerosol Lidar and Infrared Pathfinder Satellite Observations (CALIPSO) data: Algorithm Description. J. Atmos. Ocean. Technol., 26, 1105–1119, https://doi.org/10.1175/2008JTECHA1221.1, 2009. a
Zender, C. S.: Mineral Dust Entrainment and Deposition (DEAD) Model: Description and 1990s dust climatology, J. Geophys. Res., 108, 4416, https://doi.org/10.1029/2002JD002775, 2003. a
Zhang, Y., Liu, Y., Kucera, P. A., Alharbi, B. H., Pan, L., and Ghulam, A.: Dust modeling over Saudi Arabia using WRF-Chem: March 2009 severe dust case, Atmos. Environ., 119, 118–130, https://doi.org/10.1016/j.atmosenv.2015.08.032, 2015. a
Zhao, C., Liu, X., Leung, L. R., Johnson, B., McFarlane, S. A., Gustafson Jr., W. I., Fast, J. D., and Easter, R.: The spatial distribution of mineral dust and its shortwave radiative forcing over North Africa: modeling sensitivities to dust emissions and aerosol size treatments, Atmos. Chem. Phys., 10, 8821–8838, https://doi.org/10.5194/acp-10-8821-2010, 2010. a
Zhao, C., Liu, X., Ruby Leung, L., and Hagos, S.: Radiative impact of mineral dust on monsoon precipitation variability over West Africa, Atmos. Chem. Phys., 11, 1879-1893, https://doi.org/10.5194/acp-11-1879-2011, 2011. a
Zhao, C., Chen, S., Leung, L. R., Qian, Y., Kok, J. F., Zaveri, R. A., and Huang, J.: Uncertainty in modeling dust mass balance and radiative forcing from size parameterization, Atmos. Chem. Phys., 13, 10733–10753, https://doi.org/10.5194/acp-13-10733-2013, 2013. a
Zhao, T. L., Gong, S. L., Zhang, X. Y., Abdel-Mawgoud, A., and Shao, Y. P.: An assessment of dust emission schemes in modeling east Asian dust storms, J. Geophys. Res., 111, D05S90, https://doi.org/10.1029/2004JD005746, 2006. a
- Abstract
- Introduction
- Background: the physics of the emission of dust
- Model description: the dust emission modeling schemes in WRF-Chem GOCART
- Test case model configuration
- Validation data access and processing
- Results
- Discussion
- Conclusions
- Code availability
- Appendix A: Recommended code alterations
- Appendix B: Variable list
- Author contributions
- Competing interests
- Acknowledgements
- References