the Creative Commons Attribution 4.0 License.
the Creative Commons Attribution 4.0 License.
 | 09 May 2019
RTTOV-gb v1.0 – updates on sensors, absorption models, uncertainty, and availability
Domenico Cimini
James Hocking
Francesco De Angelis
Angela Cersosimo
Francesco Di Paola
Donatello Gallucci
Sabrina Gentile
Edoardo Geraldi
Salvatore Larosa
Saverio Nilo
Filomena Romano
Elisabetta Ricciardelli
Ermann Ripepi
Mariassunta Viggiano
Lorenzo Luini
Carlo Riva
Frank S. Marzano
Pauline Martinet
Yun Young Song
Myoung Hwan Ahn
Philip W. Rosenkranz
This paper describes the first official release (v1.0) of RTTOV-gb. RTTOV-gb is a FORTRAN 90 code developed by adapting the atmospheric radiative transfer code RTTOV, focused on satellite-observing geometry, to the ground-based observing geometry. RTTOV-gb is designed to simulate ground-based upward-looking microwave radiometer (MWR) observations of atmospheric downwelling natural radiation in the frequency range from 22 to 150 GHz. Given an atmospheric profile of temperature, water vapor, and, optionally, cloud liquid water content, and together with a viewing geometry, RTTOV-gb computes downwelling radiances and brightness temperatures leaving the bottom of the atmosphere in each of the channels of the sensor being simulated. In addition, it provides the sensitivity of observations to the atmospheric thermodynamical state, i.e., the Jacobians. Therefore, RTTOV-gb represents the forward model needed to assimilate ground-based MWR data into numerical weather prediction models, which is currently pursued internationally by several weather services. RTTOV-gb is fully described in a previous paper (De Angelis et al., 2016), while several updates are described here. In particular, two new MWR types and a new parameterization for the atmospheric absorption model have been introduced since the first paper. In addition, estimates of the uncertainty associated with the absorption model and with the fast parameterization are given here. Brightness temperatures (TB) computed with RTTOV-gb v1.0 from radiosonde profiles have been compared with ground-based MWR observations in six channels (23.8, 31.4, 72.5, 82.5, 90.0, and 150.0 GHz). The comparison shows statistics within the expected accuracy. RTTOV-gb is now available to licensed users free of charge from the Numerical Weather Prediction Satellite Application Facility (NWP SAF) website, after registration. Coefficients for four MWR instrument types and two absorption model parameterizations are also freely available from the RTTOV-gb support website.
- Article
(3205 KB) -
Supplement
(61 KB) - BibTeX
- EndNote


RTTOV-gb is a fast radiative transfer code, designed to simulate ground-based upward-looking microwave radiometer (MWR) observations of atmospheric downwelling natural radiation (i.e., radiances). RTTOV-gb consists of the FORTRAN 90 code described by De Angelis et al. (2016), developed by adapting version 11.2 of RTTOV, the Radiative Transfer for the TIROS Operational Vertical Sounder (TOVS), which is designed to simulate the satellite observation perspective only. From its first implementation (Eyre, 1991) through to its current version (Saunders et al., 2018), RTTOV simulates radiances from spaceborne passive sensors and also computes the Jacobians, i.e., the gradient of the radiances with respect to the atmospheric state vector. RTTOV is widely used by many national and international meteorological services for assimilating down-looking observations from visible, infrared, and microwave radiometers, spectrometers, and interferometers aboard satellite platforms. For this reason, RTTOV is maintained and continuously developed by the Numerical Weather Prediction (NWP) Satellite Application Facility (SAF) of the European Organization for the Exploitation of Meteorological Satellites (EUMETSAT). However, satellite passive observations are known to lack accuracy and resolution in the planetary boundary layer (PBL), leaving a so-called observational gap between the surface and upper troposphere (National Research Council, 2008). Therefore, in the last decade there has been increasing interest in ground-based sensors that could help bridge the PBL observational gap (Illingworth et al., 2015, 2019), including ground-based microwave radiometers (MWR). Ground-based MWR observations are also widely used for radio propagation studies and the characterization of atmospheric attenuation for telecommunication channels (Riva et al., 2014).
Data assimilation of MWR observations into NWP models may be particularly important in forecasting weather and atmospheric attenuation. In order to assimilate ground-based radiometric observations, namely brightness temperatures (TB), a fast radiative transfer forward model is needed. This model allows rapid simulations of TB at selected radiometer channels based on the NWP model state vector, i.e., atmospheric temperature and humidity profiles, similar to what RTTOV does for satellite sensors. Therefore, in the framework of the COST (European Cooperation in Science and Technology) Actions EG-CLIMET (European Ground-Based Observations of Essential Variables for Climate and Operational Meteorology) and TOPROF (Towards operational ground based profiling with ceilometers, doppler lidars and microwave radiometers for improving weather), there have been continuous activities to develop a ground-based version of RTTOV: RTTOV-gb (De Angelis et al., 2016). RTTOV-gb is a one-dimensional radiative transfer model: for any given location, it takes vertical profiles of atmospheric temperature, water vapor, and cloud liquid water specified on an arbitrary set of pressure levels, and from them it simulates TB as well as the Jacobians (i.e., the sensitivity of TB to atmospheric thermodynamical profiles) corresponding to ground-based upward-looking microwave radiometers. The radiative transfer extends to the top of the atmosphere, and it includes an extra-terrestrial contribution, i.e., the cosmic background radiation. The availability of RTTOV-gb is fostering wider use of MWR observations in NWP models, as demonstrated by the current use at some of the most relevant meteorological services in Europe as well as outside, such as Météo-France, the German Meteorological Service (Deutscher Wetterdienst, DWD), and the Korean Meteorological Administration (KMA).
This paper introduces several updates of RTTOV-gb since its first development (De Angelis et al., 2016). In Sect. 2 we introduce a new absorption model parameterization and two new sensors that have been added among the setting options. Section 3 presents the evaluation of RTTOV-gb against the reference line-by-line radiative transfer model and real radiometric ground-based observations. Section 4 summarizes the findings while the code and data availability section provides instructions for code and data access and use.
2.1 New sensors
Similar to RTTOV, RTTOV-gb was designed to simulate observations and Jacobians for a suite of instruments, in this case ground-based instead of satellite-borne sensors. While introducing RTTOV-gb, De Angelis et al. (2016) presented results for two sensors, among the most common ground-based MWRs worldwide: the Humidity And Temperature PROfiler (HATPRO), manufactured by RPG, and the MP3000A, manufactured by Radiometrics. In the current version (v1.0), two more sensors have been added to the suite: the microwave temperature radiometer TEMPERA (Stähli et al., 2013; Navas-Guzmán et al., 2017) and the liquid water path (LWP) K-to-W-band radiometer (LWP_ K2W). Note that LWP_K2W is a virtual instrument which includes all the channels offered by the LWP family of ground-based radiometers (LWP, LWP-U90, LWP-U72-82, LWP-U150, LWP-90-150) manufactured by RPG (https://www.radiometer-physics.de/products/microwave-remote-sensing-instruments/radiometers/lwp-radiometers/, last access: 14 November 2018).
The RTTOV-gb optical depth calculation is a parameterization which requires precomputed coefficients. These coefficients are specific to each instrument and are stored in coefficient files (see also Sect. 2.2). Every time a new sensor is added to the sensor suite, a dedicated coefficient file must be generated. The coefficient file contains the regression coefficients to estimate the optical depth for each atmospheric layer and each sensor channel from the thermodynamical properties of the layer through a set of predictors. The predictors are derived from the input state vector profile and depend on the elevation angle θ and pressure P, temperature T, and specific humidity Q at the considered and surrounding levels. The regression coefficients are trained on a set of diverse profiles which covers the atmospheric conditions of different climate zones. Pressure levels and regression limits for T and Q are reported in Table 1. The coefficients are based on a set of 101 pressure levels specifically created for RTTOV-gb which are denser in the lower atmosphere than the RTTOV coefficient levels usually used for spaceborne sensors.
Table 1A selection of the 101 pressure levels adopted for RTTOV-gb (De Angelis et al., 2016). The table also reports the limits for temperature (T) and specific humidity (Q) at each level representing the range of values used when training the regression coefficients. Note that Q is in part per million in volume over dry air. The full matrix is provided as a Supplement to this paper and freely available online (http://cetemps.aquila.infn.it/mwrnet/main_files/DAT/RTTOVgb_101_pressure_levels_and_regression_limits.xlsx, last access: 14 November 2018).
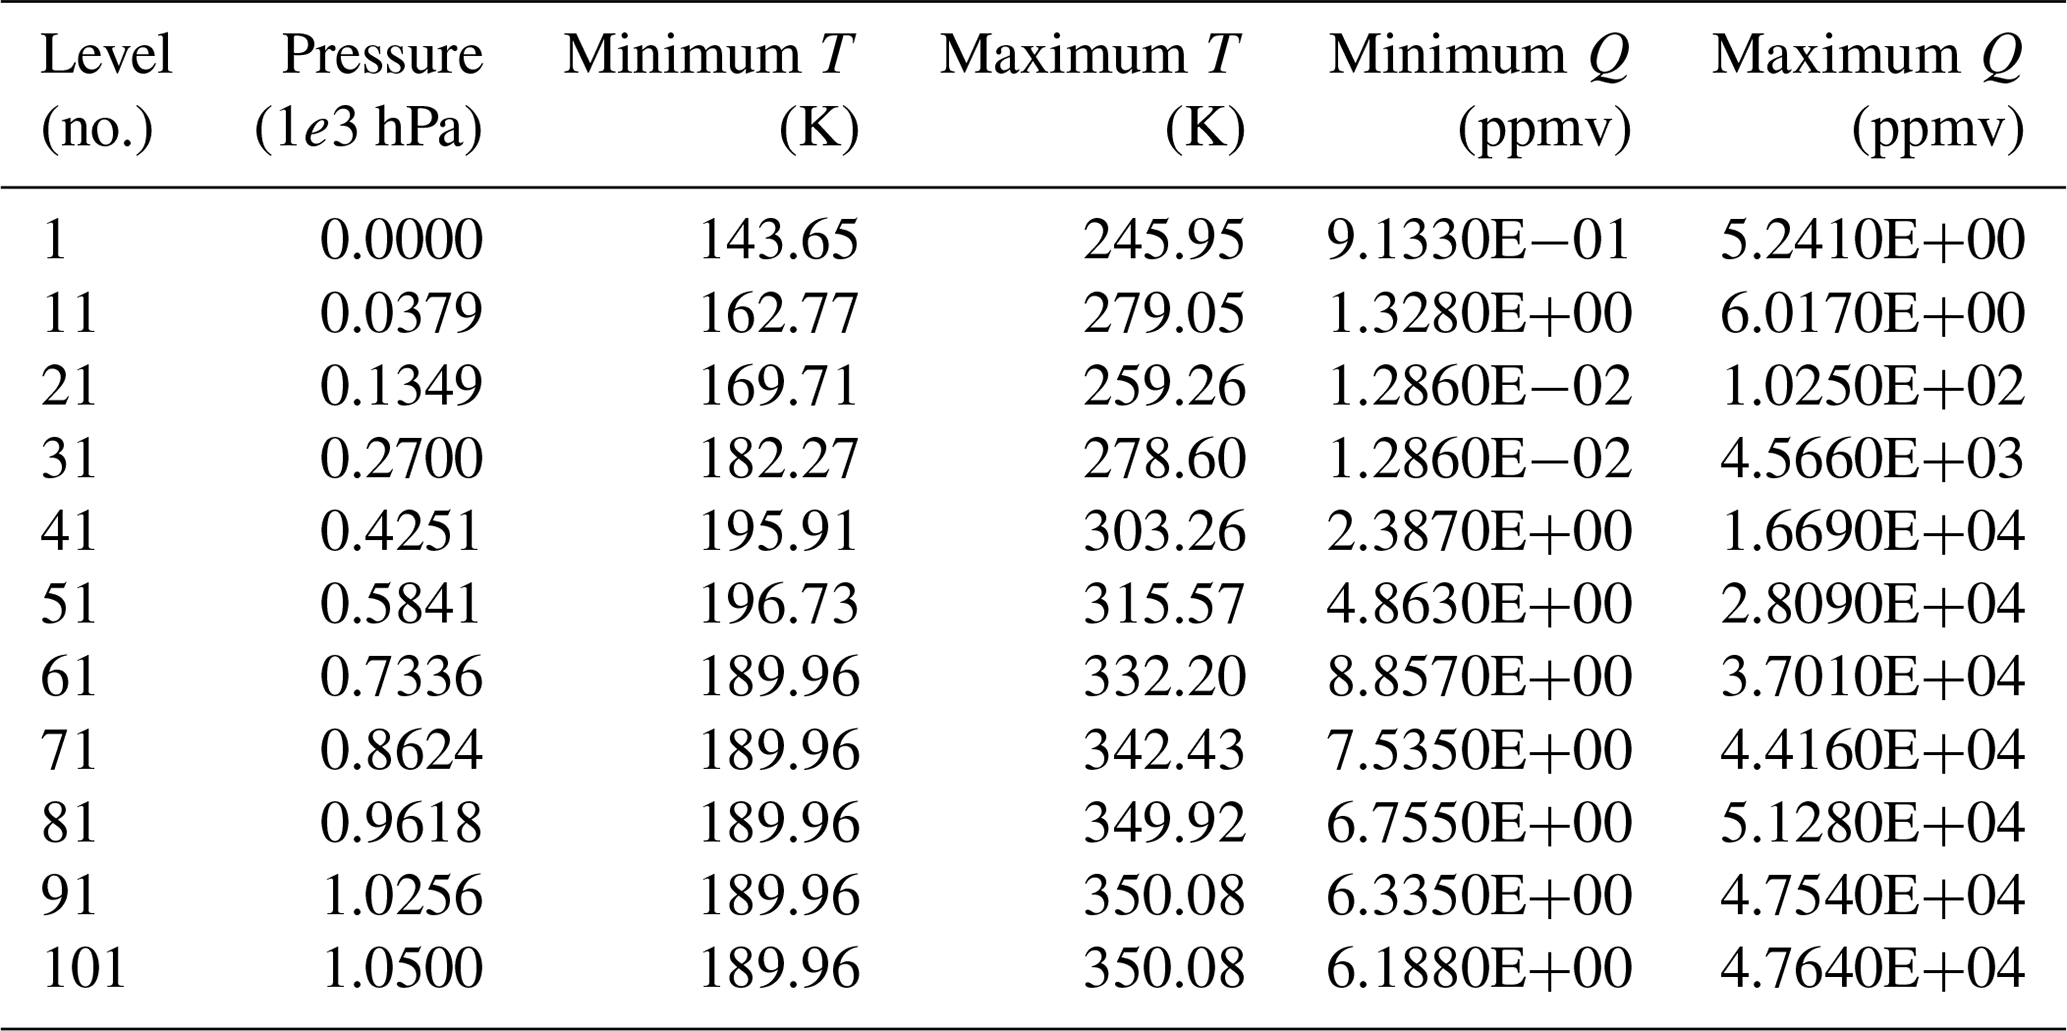
Table 2Sensors supported by RTTOV-gb as for October 2018 (v1.0) with the corresponding number of channels and their central frequency.
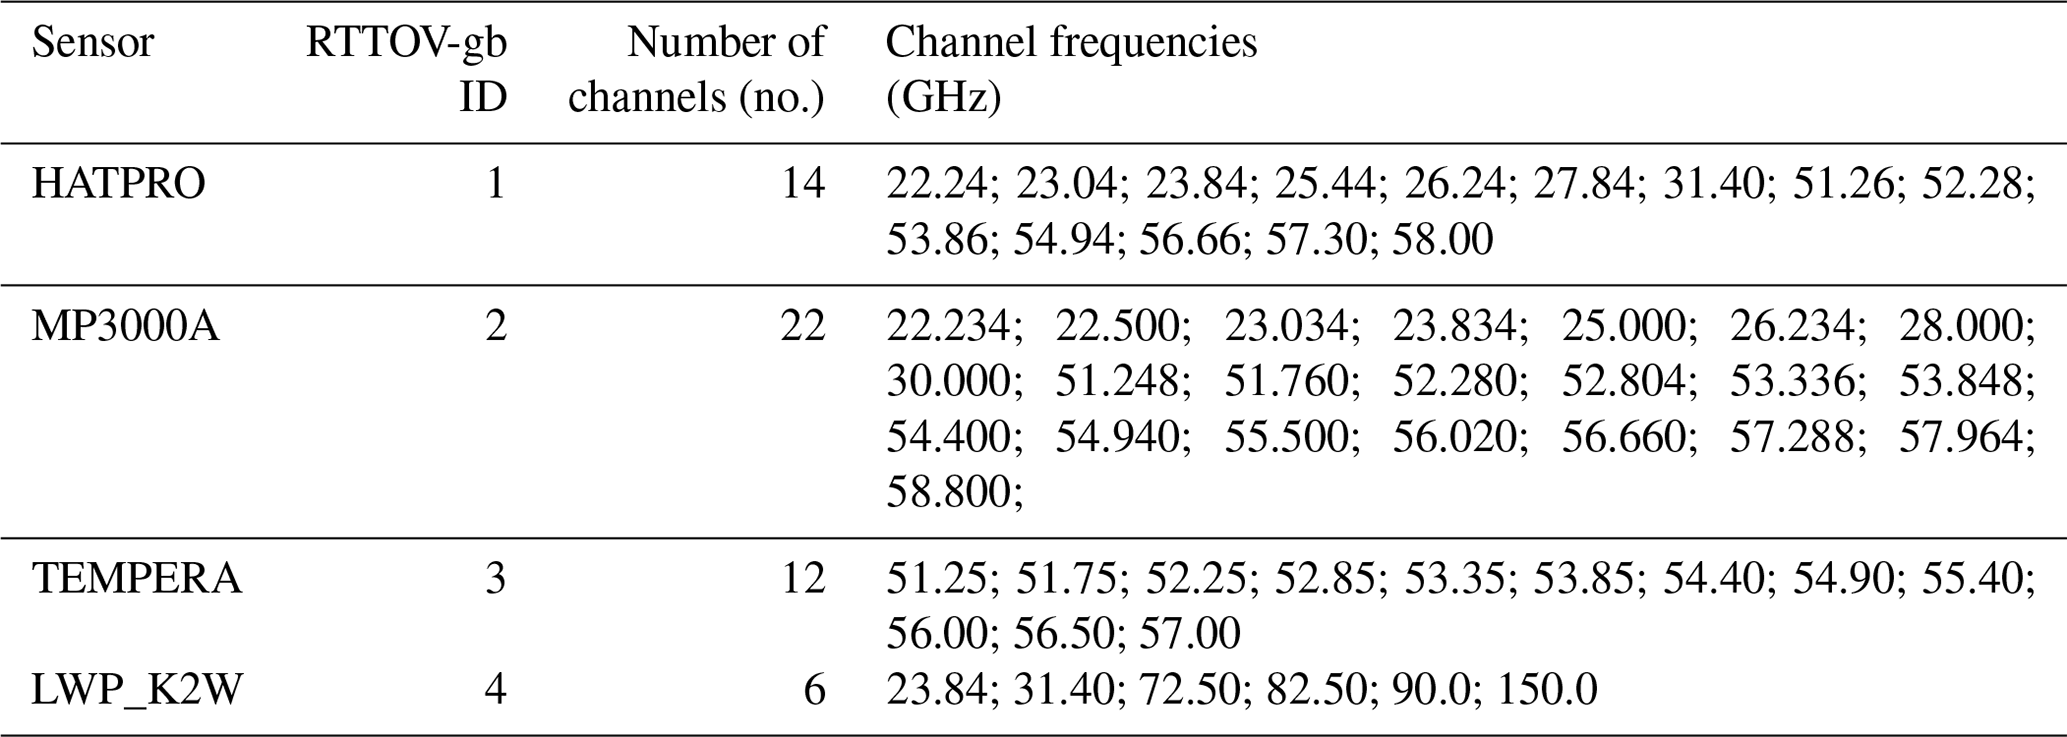
The list of currently supported sensors with their channel frequencies is given in Table 2. Other sensors are planned for future updates, e.g., those operating at 183 GHz for low water vapor and cloud liquid water retrievals (Cimini et al., 2007).
2.2 Absorption model
Similar to RTTOV, RTTOV-gb is a parameterized atmospheric radiative transfer code. In the microwave region and for clear-sky conditions, the parameterization only affects the atmospheric gas absorption. This means that the optical depth of each layer is only due to absorption by atmospheric gases (mainly oxygen, water vapor, and nitrogen). The parameterization consists of the fact that the layer optical depth is not computed from a complex line-by-line (LBL) absorption model (Clough et al., 2005) but rather from a simplified parameterized model. The simplified model consists of a linear regression, which relates the layer optical depth to predictors derived from the layer atmospheric thermodynamical properties (i.e., pressure, temperature, and humidity). The regression coefficients are computed off-line from a diverse training dataset of atmospheric thermodynamical profiles and corresponding optical depths computed with an LBL model. Thus, RTTOV-gb provides a fast parameterization of the LBL model adopted for the training of the regression coefficients. For the microwave frequency range (10–200 GHz), the regression coefficients of RTTOV are trained using the AMSUTRAN LBL model developed at the Met Office (Turner et al., 2019), which is based on the millimeter-wave propagation model (MPM) introduced by Liebe (1989), with some modifications following Tretyakov et al. (2005), Liljegren et al. (2005), and Payne et al. (2008) (Saunders et al., 2017). Conversely, RTTOV-gb was trained using a later version of MPM, described by Rosenkranz (1998, hereafter R98), which is probably the most used among the ground-based microwave radiometry community. This model is continuously revised and freely available (Rosenkranz, 2017, hereafter R17), and its uncertainty has been carefully investigated (Cimini et al., 2018). Therefore, RTTOV-gb has been trained using the R17 model also (version of 17 May 2017 available at http://cetemps.aquila.infn.it/mwrnet/lblmrt_ns.html, last access: 14 November 2018). Coefficients for both the R98 and R17 models are now available within RTTOV-gb v1.0. Extending the results in Cimini et al. (2018) from 60 to 150 GHz, Fig. 1 shows clear-sky zenith downwelling TB computed with the R17 model and the difference between TB computed with the two model versions for six reference atmosphere climatology conditions. The difference spans −2 to +3 K in the considered frequency range, and thus it is not negligible for the sensors currently available for RTTOV-gb v1.0.

Figure 1(a) Zenith downwelling TB computed using six reference atmosphere climatology conditions with the R17 model. (b) Difference between TB computed with the current and reference versions (R17 minus R98) for the six atmosphere climatology conditions. This figure is similar to Fig. 1 in Cimini et al. (2018), although TB were recomputed to cover a wider frequency range.
As mentioned, Cimini et al. (2018) investigated the uncertainty of TB computed with the R17 model due to the laboratory uncertainty of the adopted spectroscopic parameters. Through a sensitivity test, they identified 111 parameters (6 for water vapor and 105 for oxygen), whose contribution to the total uncertainty was dominant with respect to others. For these 111 parameters, Cimini et al. (2018) estimated the full uncertainty covariance matrix (Cov(p)), from which the TB uncertainty covariance matrix (Cov(TB)) and the square root of its diagonal terms (σ(TB)) were computed. σ(TB) represents the standard deviation of typical spectroscopic uncertainties to be expected from TB computed with the R17 model. Figure 2 shows σ(TB) for zenith observations in six climatological atmospheric conditions. Note that the uncertainties used here are at the 1σ level, i.e., applying a unitary coverage factor (k=1, as defined by JCGM, 2008).
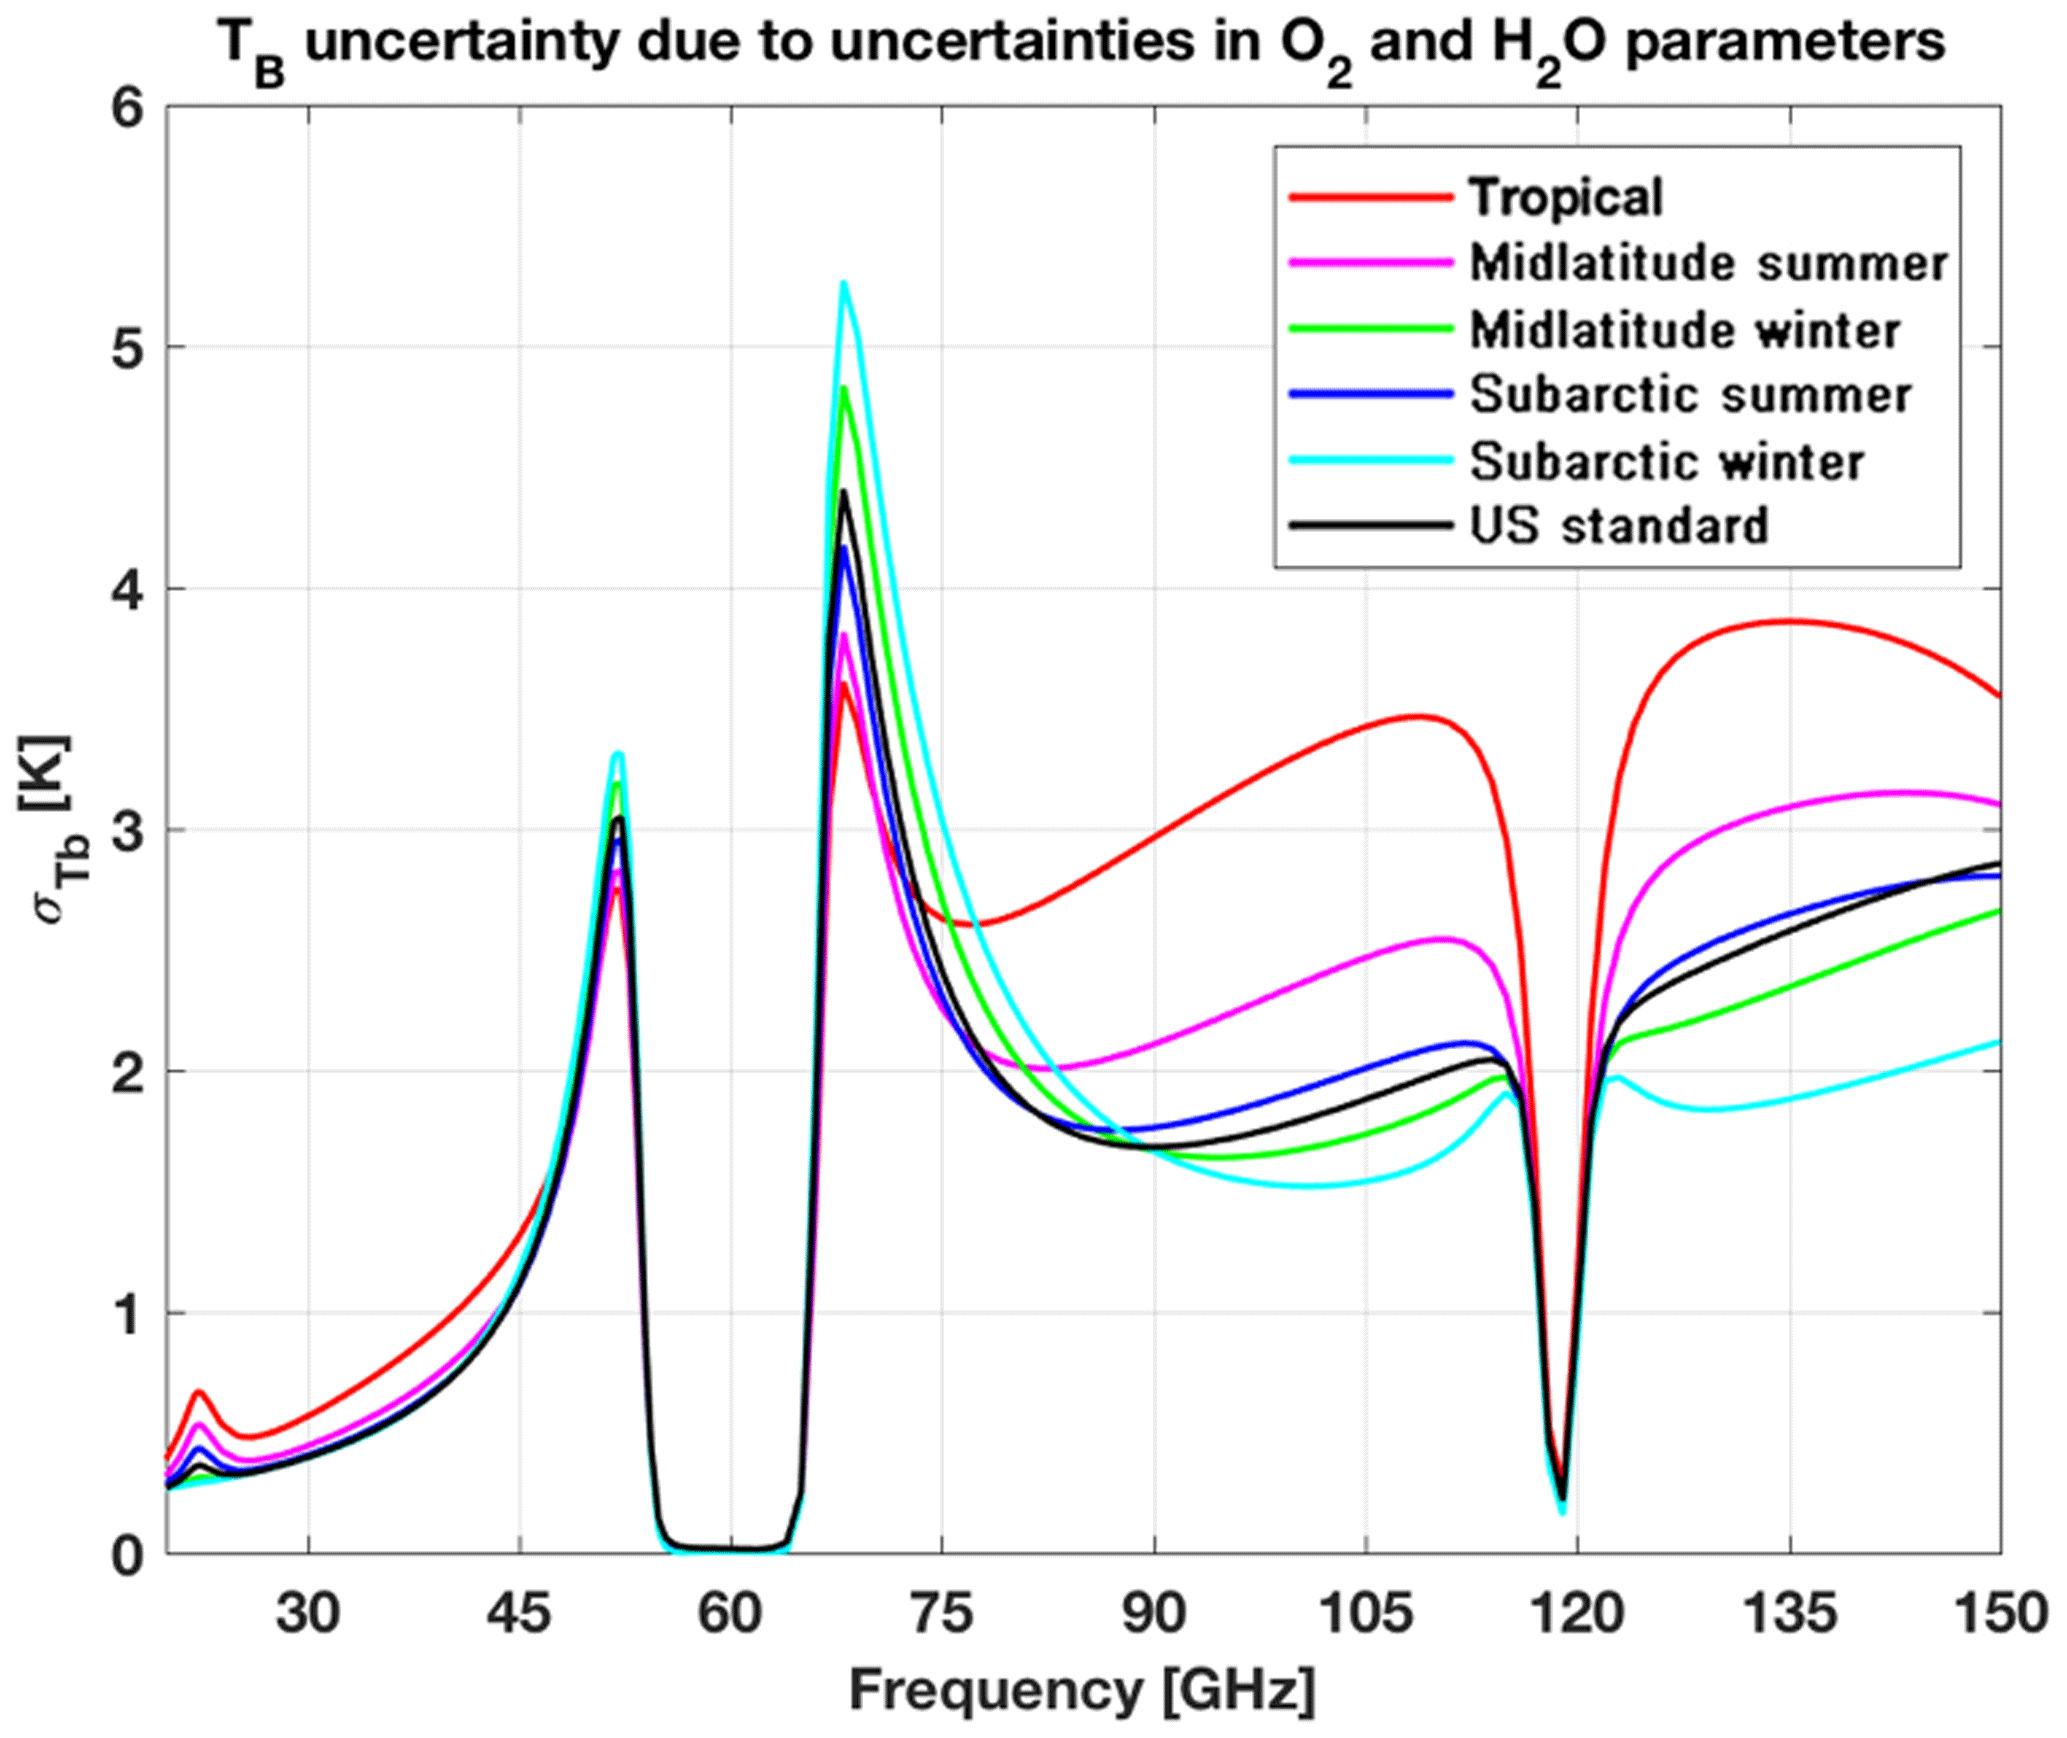
Figure 2Zenith downwelling TB uncertainty (σ(TB)) due to the uncertainty in O2 and H2O absorption model parameters. Six climatological atmospheric conditions (color-coded) have been used to compute Cov(p) (see Sect. 2.2). σ(TB) is computed as the square root of the diagonal terms of Cov(TB). This figure is similar to Fig. 6 in Cimini et al. (2018), although σ(TB) was recomputed to cover a wider frequency range.
Table 3Statistics for the comparison between RTTOV-gb and the line-by-line model R98 (Rosenkranz, 1998) used for training against an independent profile set. The TEMPERA instrument channel number (Chan no.), the channel central frequency, bias, and rms at four elevation angles are reported.


Note that the analysis of Cimini et al. (2018) was limited to the 20–60 GHz range. Here, a new sensitivity analysis has been performed to cover the frequency range of sensors available for RTTOV-gb v1.0 (20 to 150 GHz). One additional parameter was found to contribute dominantly, namely the temperature-dependence exponent ncs of the water vapor self-broadened continuum, contributing with its uncertainty by 0.2–0.6 K to the total uncertainty of downwelling TB between 70 and 150 GHz. By applying the same approach as described in Cimini et al. (2018) for other water vapor continuum parameters, the covariance and correlation between ncs and the self-broadened continuum parameter Cs were estimated to be Cov (km−1 hPa−2 GHz−2) and Cor, respectively. The covariance of ncs with respect to the other 111 parameters is estimated to be negligible.
For more details on RTTOV and the differences between RTTOV-gb and RTTOV, see Hocking et al. (2015), Saunders et al. (2018), and De Angelis et al. (2016).
The accuracy of RTTOV-gb v1.0 TB simulations has been tested against both the reference LBL model and real ground-based observations.
3.1 Validation against reference model
As described by De Angelis et al. (2016), the approach for testing RTTOV-gb against the reference LBL model used for training (i.e., R98 or R17) consists of computing TB simulations with both models from a set of independent profiles (i.e., not used for training) and to evaluate the statistics of their difference, namely the mean (bias) and root-mean-square (rms) difference. For the original two sensors (HATPRO and MP3000A), De Angelis et al. (2016) in their Tables 2 and 3 reported the statistics (bias and rms) for the comparison between RTTOV-gb and the LBL model used for training (R98 in their case) against an independent profile set at four elevation angles (90, 30, 19, and 10∘). Similarly, here we report the statistics for the two new sensors (i.e., TEMPERA and LWP_K2W) and the same R98 LBL model, respectively, in Tables 3 and 4. These two tables show that the discrepancies between RTTOV-gb v1.0 and LBL optical depths lead to negligible TB differences. The rms differences at zenith are lower than 0.18 K for all channels. When decreasing the elevation angle, the rms differences generally decrease for 50–57 GHz channels (Table 3), while they increase for 23-31 and 70–150 GHz channels (Table 4), in accordance with the different levels of atmospheric opacity. The highest rms differences (0.3 K) are found for window channels 31 and 150 GHz at 10∘ elevation. Similarly to De Angelis et al. (2016), the main conclusion is that the uncertainty introduced by the fast model approximation (RTTOV-gb) is within the typical instrument uncertainty and thus does not dominate the uncertainty budget of observations vs. simulations. Let us underline that Tables 2 and 3 of De Angelis et al. (2016) and Tables 3 and 4 of this paper report statistics when using the R98 LBL model for training. The analogous rms values obtained using the LBL model R17 at zenith are reported in Table 5 as “fast parameterization uncertainty”. As expected, rms values do not differ significantly from those obtained against R98. In fact, this test only tells us about the accuracy of the parameterized regression in reproducing the LBL model radiances, which is largely independent of the choice of the LBL model. Table 5 also reports the TB uncertainty contribution due to the uncertainty of spectroscopic parameters (from Fig. 2). The estimated total uncertainty is computed as the sum in quadrature (i.e., the square root of the sum of squares) of two contributions: the uncertainty due to fast parameterization and absorption model spectroscopic parameters. The latter dominates the uncertainty budget. The total uncertainty so estimated is reported in Table 5 for each sensor and channel available in RTTOV-gb.
3.2 Validation against real observations
RTTOV-gb TB simulations have been previously compared with real ground-based observations from six HATPRO and one MP3000-A (De Angelis et al., 2016, 2017). The frequency range covered by HATPRO and MP3000-A channels overlaps the frequency range of TEMPERA, so we assume RTTOV-gb has been tested for this sensor as well. Conversely, the frequency range of LWP_K2W extends to higher frequencies (up to 150 GHz) to include all the channels offered by the RPG LWP ground-based radiometer family (LWP, LWP-U90, LWP-U72-82, LWP-U150, LWP-90-150). Thus, in the following we present a comparison with observations from an LWP-U72-82 radiometer located at the Polytechnic University campus in Milan (Italy; 45.450∘ N, 9.183∘ E), and from an LWP-90-150 radiometer located at the Atmospheric Radiation Measurement (ARM) program Southern Great Plains (SGP) central facility in Lamont (OK, USA; 36.605∘ N, 97.485∘ W). The two datasets represent midlatitude summer and midlatitude winter conditions. Operational radiosondes are launched from these two sites, measuring profiles of pressure, temperature, and water vapor, which are then processed by RTTOV-gb to compute downwelling TB simulating ground-based observations. Since these radiosondes do not measure liquid water content profiles, we assume no clouds are present and thus meaningful comparison with real observations can be performed in clear sky only. Radiosondes usually reach up to 10 hPa (∼30 km altitude), leaving the five uppermost RTTOV-gb levels to be covered with climatological profiles. This has negligible impact on ground-based radiance calculations.
Table 5RTTOV-gb TB uncertainty due to forward model and fast parameterization and their total squared sum for two extreme climatology conditions. Channels for the four sensors considered in the current version of RTTOV-gb are given in (a) (HATPRO), (b) (MP3000A), (c) (TEMPERA), and (d) (LWP_K2W). Values are given for zenith observations.

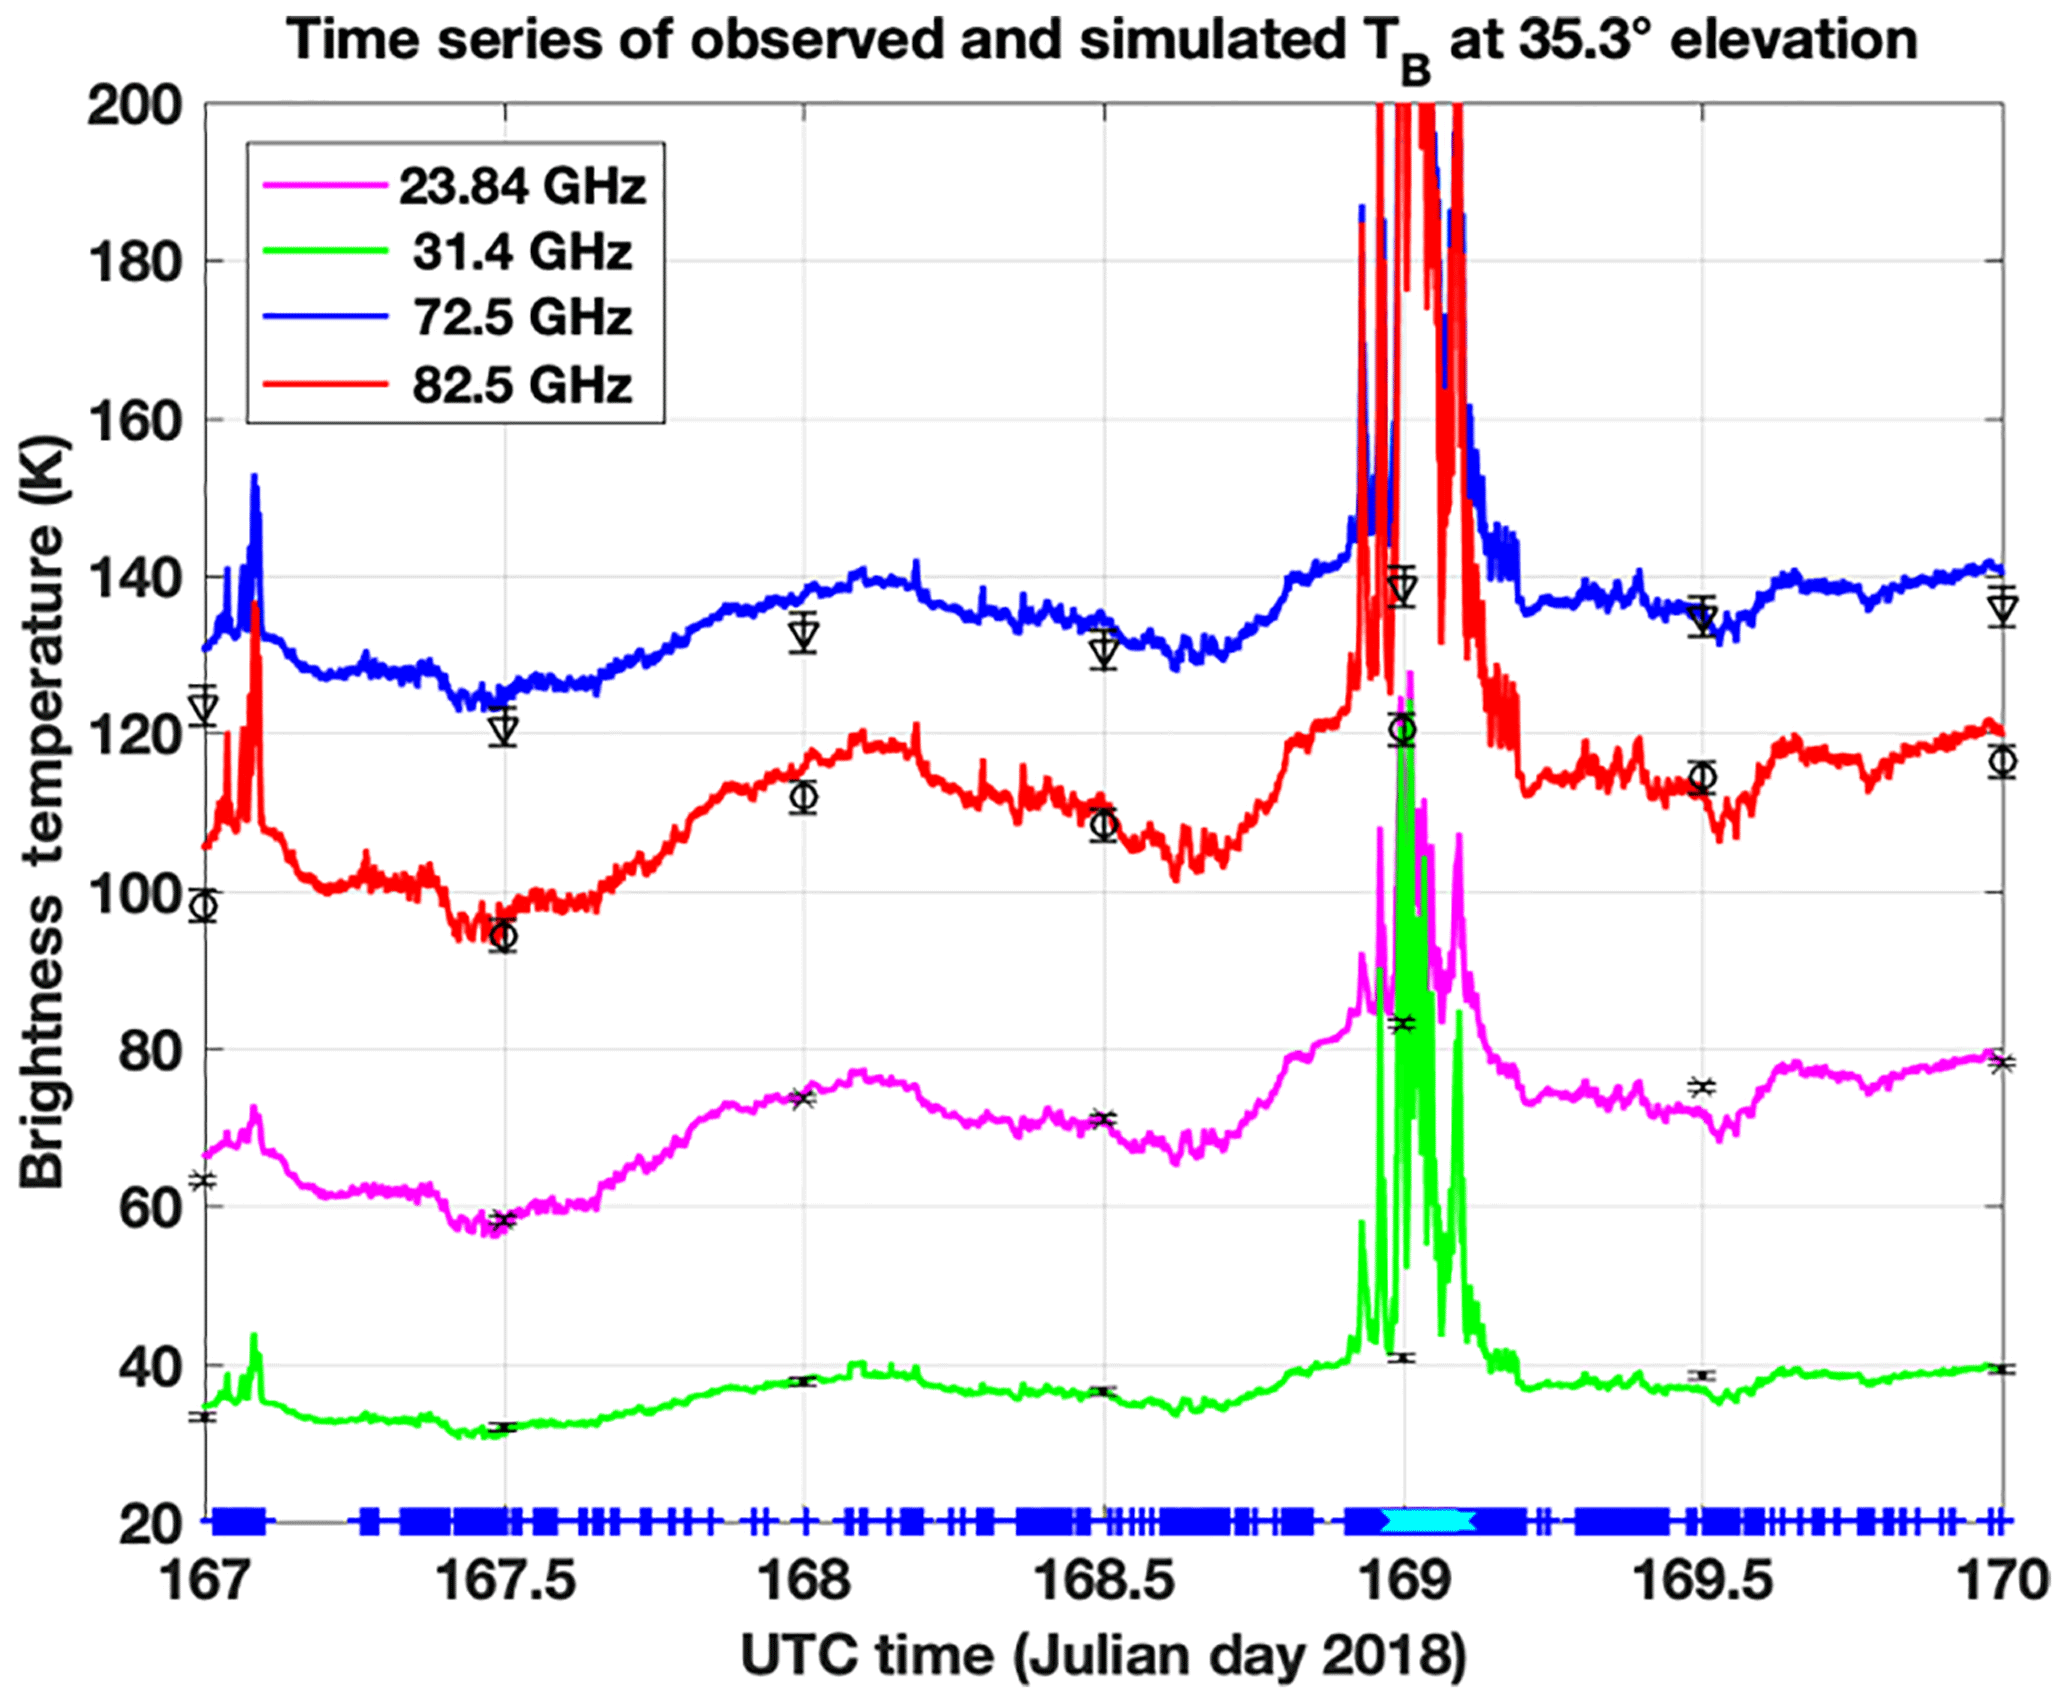
Figure 3Time series of observed (lines) and simulated (markers) TB at 35.3∘ elevation for four channels of LWP-U72-82. The radiometer is located at the Polytechnic University campus in Milan (Italy), while radiosondes used for the simulations are launched from the Milan Linate airport (∼20 km from the Polytechnic University campus). Channel frequencies are color-coded as reported in the legend. Simulations are reported with dots (23.84 GHz), crosses (31.4 GHz), triangles (72.5 GHz), and circles (82.5 GHz), including an indicative estimate of the total uncertainty. The cloud and rain flags are indicated at the bottom by blue and cyan crosses, respectively. The time series spans the period of 00:00 of 16 June (Julian day 167) to 00:00 of 19 June (Julian day 170) 2018.
The LWP-U72-82 instrument has four channels (23.84, 31.4, 72.5, and 82.5 GHz), and it is mainly used for radio propagation studies. The available dataset extends for 1 month (from 16 June to 15 July 2018), corresponding to relatively moist midlatitude summer conditions. The dataset includes radiometric observations and pressure, temperature, and humidity profiles measured by radiosonde ascents launched twice daily from the Milan Linate airport (∼20 km from the Polytechnic University campus). Radiometric observations are collected at a fixed elevation angle (35.3∘), matching the direction of the Alphasat telecommunication link. Absolute MWR calibrations were performed 9 months earlier and 4 months later than the period under study, showing no substantial change in the calibration coefficients. Thus, we assume the calibration was stable during the period under study. An example of data is shown in Fig. 3 for 3 consecutive days. Here, TB observed at the four channels is plotted together with RTTOV-gb simulations and their estimated uncertainty. It appears that simulations usually fit the observations within uncertainty, except for periods with clouds (at ∼167.0, i.e., 00:00 of 16 June) and rain (∼169.0, i.e., 00:00 of 18 June). This is expected as RTTOV-gb simulations are computed from radiosonde measurements, which do not provide hydrometeor content and thus do not take into account the radiative contribution of clouds and rain. Thus, for a fair clear-sky comparison, data affected by either rain or clouds must be screened out. As illustrated in Fig. 3, the LWP-U72-82 is equipped with a rain sensor, indicating either rain or no rain on the antenna radome. Observations during rain, as flagged by the rain sensor, have been discarded. In addition, cloudy conditions have been identified by setting a threshold on the standard deviation of TB (31.4 GHz) over a time period (Turner et al., 2007). This approach has been used previously with a 0.5 K threshold over a 1 h period (De Angelis et al., 2017). Here, we choose a shorter period (10 min); assuming lower clear-sky atmospheric variability with decreasing time interval, and looking at the distribution of the TB (31.4 GHz) standard deviation, we set the threshold to 0.2 K. Thus, data identified as cloudy, by the standard deviation of TB (31.4 GHz) over a 10 min period being larger than 0.2 K, have been discarded. The cloud and rain screening reduced the dataset by ∼33 %, leaving 40 matchups between clear-sky radiosonde and radiometric observations (averaged within ±5 min from the radiosonde launch). Scatterplots of simulated vs. observed TB at 35.3∘ elevation for the four channels of LWP-U72-82 are shown in Fig. 4. Note that the correlation coefficient is 0.98 for all four channels. The slope is within 5 % for all channels but 72.5 GHz (∼8 %), for which the difference between observations and simulations tends to increase as TB decrease. This may be due to an issue with the instrument gain calibration as well as to increasing uncertainty for this channel at lower temperature and moisture conditions (see Fig. 2). Statistics at 23.84 and 31.4 GHz are of the same magnitude as those reported by De Angelis et al. (2017) at 30∘ elevation (their Fig. 5c).

Figure 4Scatter of simulated vs. observed TB at 35.3∘ elevation for four channels of LWP-U72-82. Locations of radiometer and radiosondes are as in Fig. 3. The absorption model of Rosenkranz (2017) has been used. Each panel reports the number of elements (N(EL)), the average difference (AVG), the standard deviation (SD), the slope (SLP) and intercept (INT) of a linear fit, the standard error (SDE), the root-mean square (rms), and correlation coefficient (COR); 95 % confidence intervals are given for AVG, SLP, and INT. Units for AVG, SD, SDE, and rms are in kelvin.
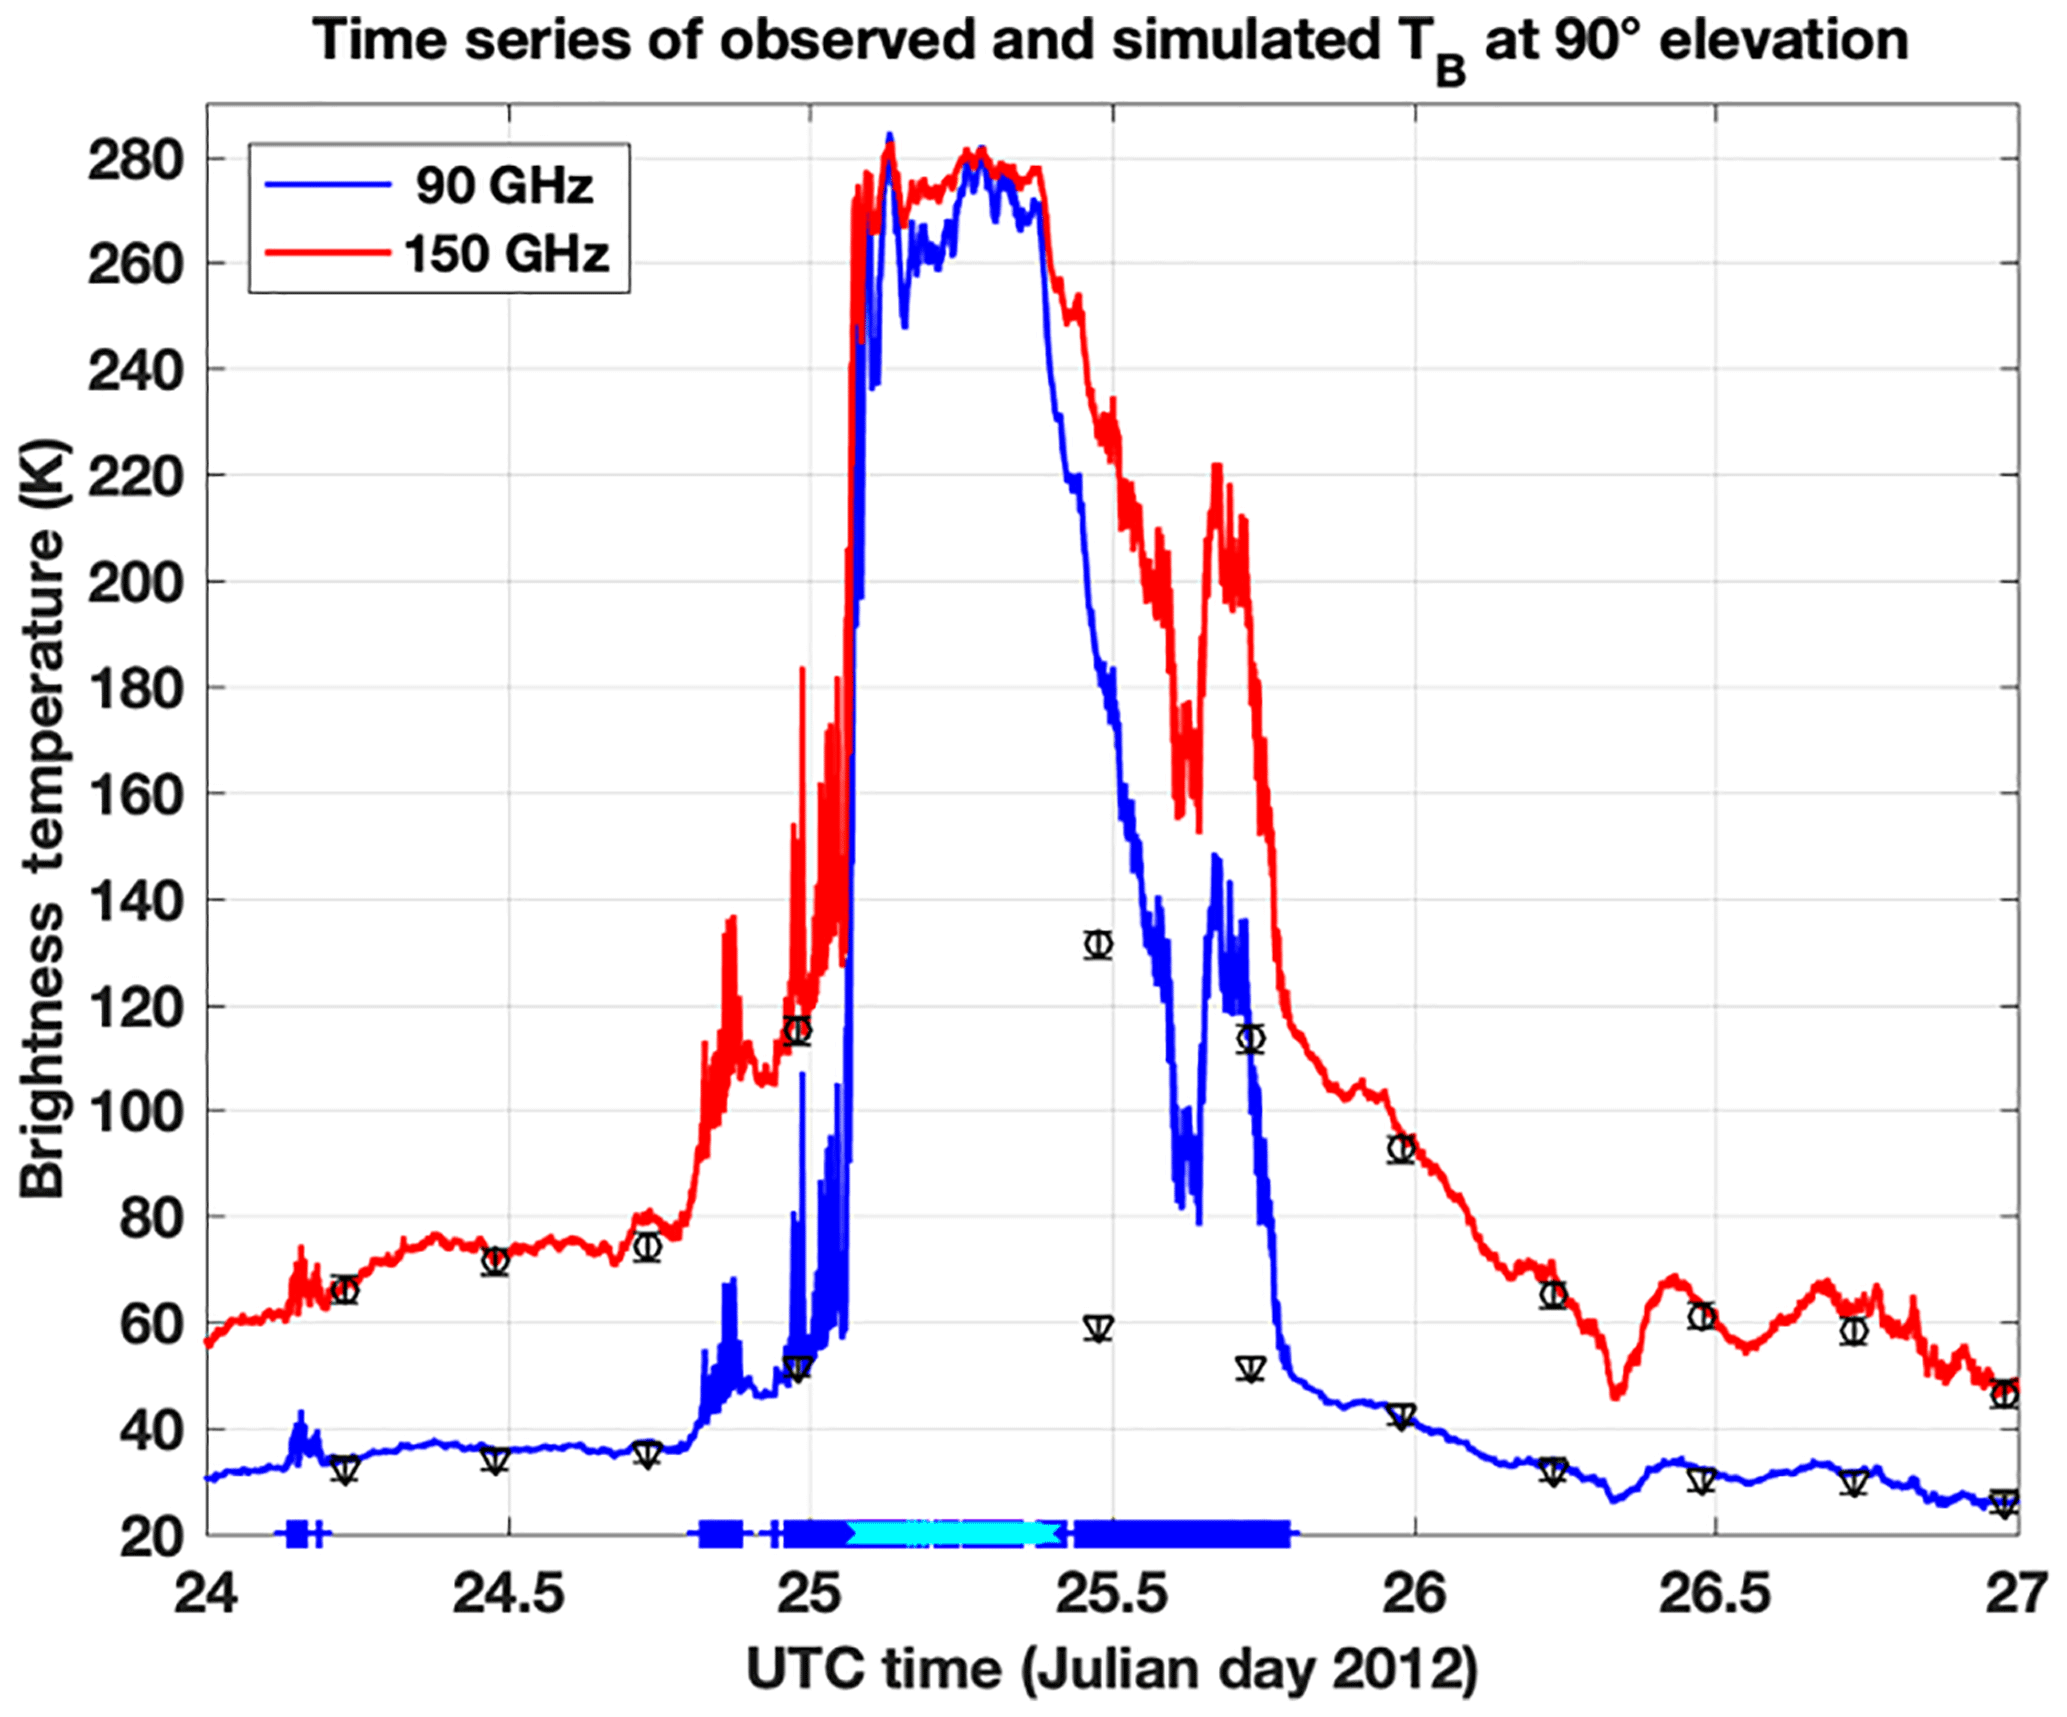
Figure 5Time series of observed (lines) and simulated (markers) TB at 90∘ elevation for two channels of LWP-90-150. The radiometer and radiosondes are operated from the Atmospheric Radiation Measurement (ARM) program Southern Great Plains (SGP) central facility (Lamont, OK, USA). Channel frequencies are color-coded as reported in the legend. Simulations are reported with triangles (90 GHz) and circles (150 GHz), including an indicative estimate of the total uncertainty. The cloud and rain flags are indicated at the bottom by blue and cyan crosses, respectively. The time series spans 24 January 00:00 to 27 January 00:00 UTC 2012 (Julian day 24–27).

Figure 6Same as Fig. 4 but showing simulated vs. observed TB at 90∘ elevation for two channels of LWP-90-150. Location of radiometer and radiosondes are as in Fig. 5. The absorption model of Rosenkranz (2017) has been used.
The LWP-90-150 instrument has two channels (90.0 and 150.0 GHz), and it is mainly used for the retrieval of total column cloud liquid water content. The instrument considered here has been running at the ARM SGP central facility between November 2006 and November 2013, performing calibrations regularly using the tip curve method (Cadeddu et al., 2013). Here we exploit a 2-month dataset of radiometric and radiosonde observations (ARM, 2018a, b) collected in January–February 2012. This dataset corresponds to relatively dry midlatitude winter conditions. An example of data is shown in Fig. 5 for 3 consecutive days, corresponding to a dry clear-sky period with intermittent thick clouds and rain. Observations flagged by the rain sensor have been discarded. In addition, cloudy conditions have been identified with the same approach as described above, i.e., setting a threshold on the 10 min standard deviation of TB at a window channel, here replacing the 31.4 GHz with the 90.0 GHz channel. However, since TB (90 GHz) has ∼6 times larger sensitivity to water vapor (Cimini et al., 2007), the clear-sky threshold is increased by the same factor, i.e., 1.2 K. Thus, data with 10 min standard deviation of TB (90 GHz) larger than 1.2 K have been discarded. The cloud and rain screening reduced the dataset by ∼26 %, leaving 173 matchups between clear-sky radiosonde and radiometric observations (averaged within ±5 min from the radiosonde launch). Scatterplots of simulated vs. observed TB at 90∘ elevation for the two channels of LWP-90-150 are shown in Figure 6. The correlation coefficient is 0.95 and 0.99 for 90 and 150 GHz, respectively, while the slope is within 4 % for both channels.
Overall, the average differences at all the six LWP_K2W channels are close to the accuracy estimated in Table 5d. A direct comparison is given in Fig. 7. Here, the estimated uncertainty for the six LWP_K2W channels is compared with the experimental mean difference between simulations and observations. Note that radiometric observations at the four lower-frequency channels were collected in June–July in Milan (45∘ N), while in January–February in Lamont (36∘ N) they were collected at the two higher-frequency channels. Thus, the simulation uncertainty is estimated using midlatitude summer conditions for the four lower-frequency channels, while midlatitude winter conditions were used for the two higher-frequency channels. The experimental bias is generally larger than the simulation-estimated uncertainty, as one would expect since the observations are also affected by uncertainty. Except for the 72.5 GHz channel, the estimated uncertainty and experimental bias are within 0.5 K, which corresponds to the absolute TB accuracy claimed by the manufacturer for the LWP radiometer series. At 72.5 GHz, as anticipated, observation–simulation differences tend to increase as TB decreases, possibly due to either condition-dependent uncertainty or an issue with the instrument gain calibration. This will be the subject of a future investigation.
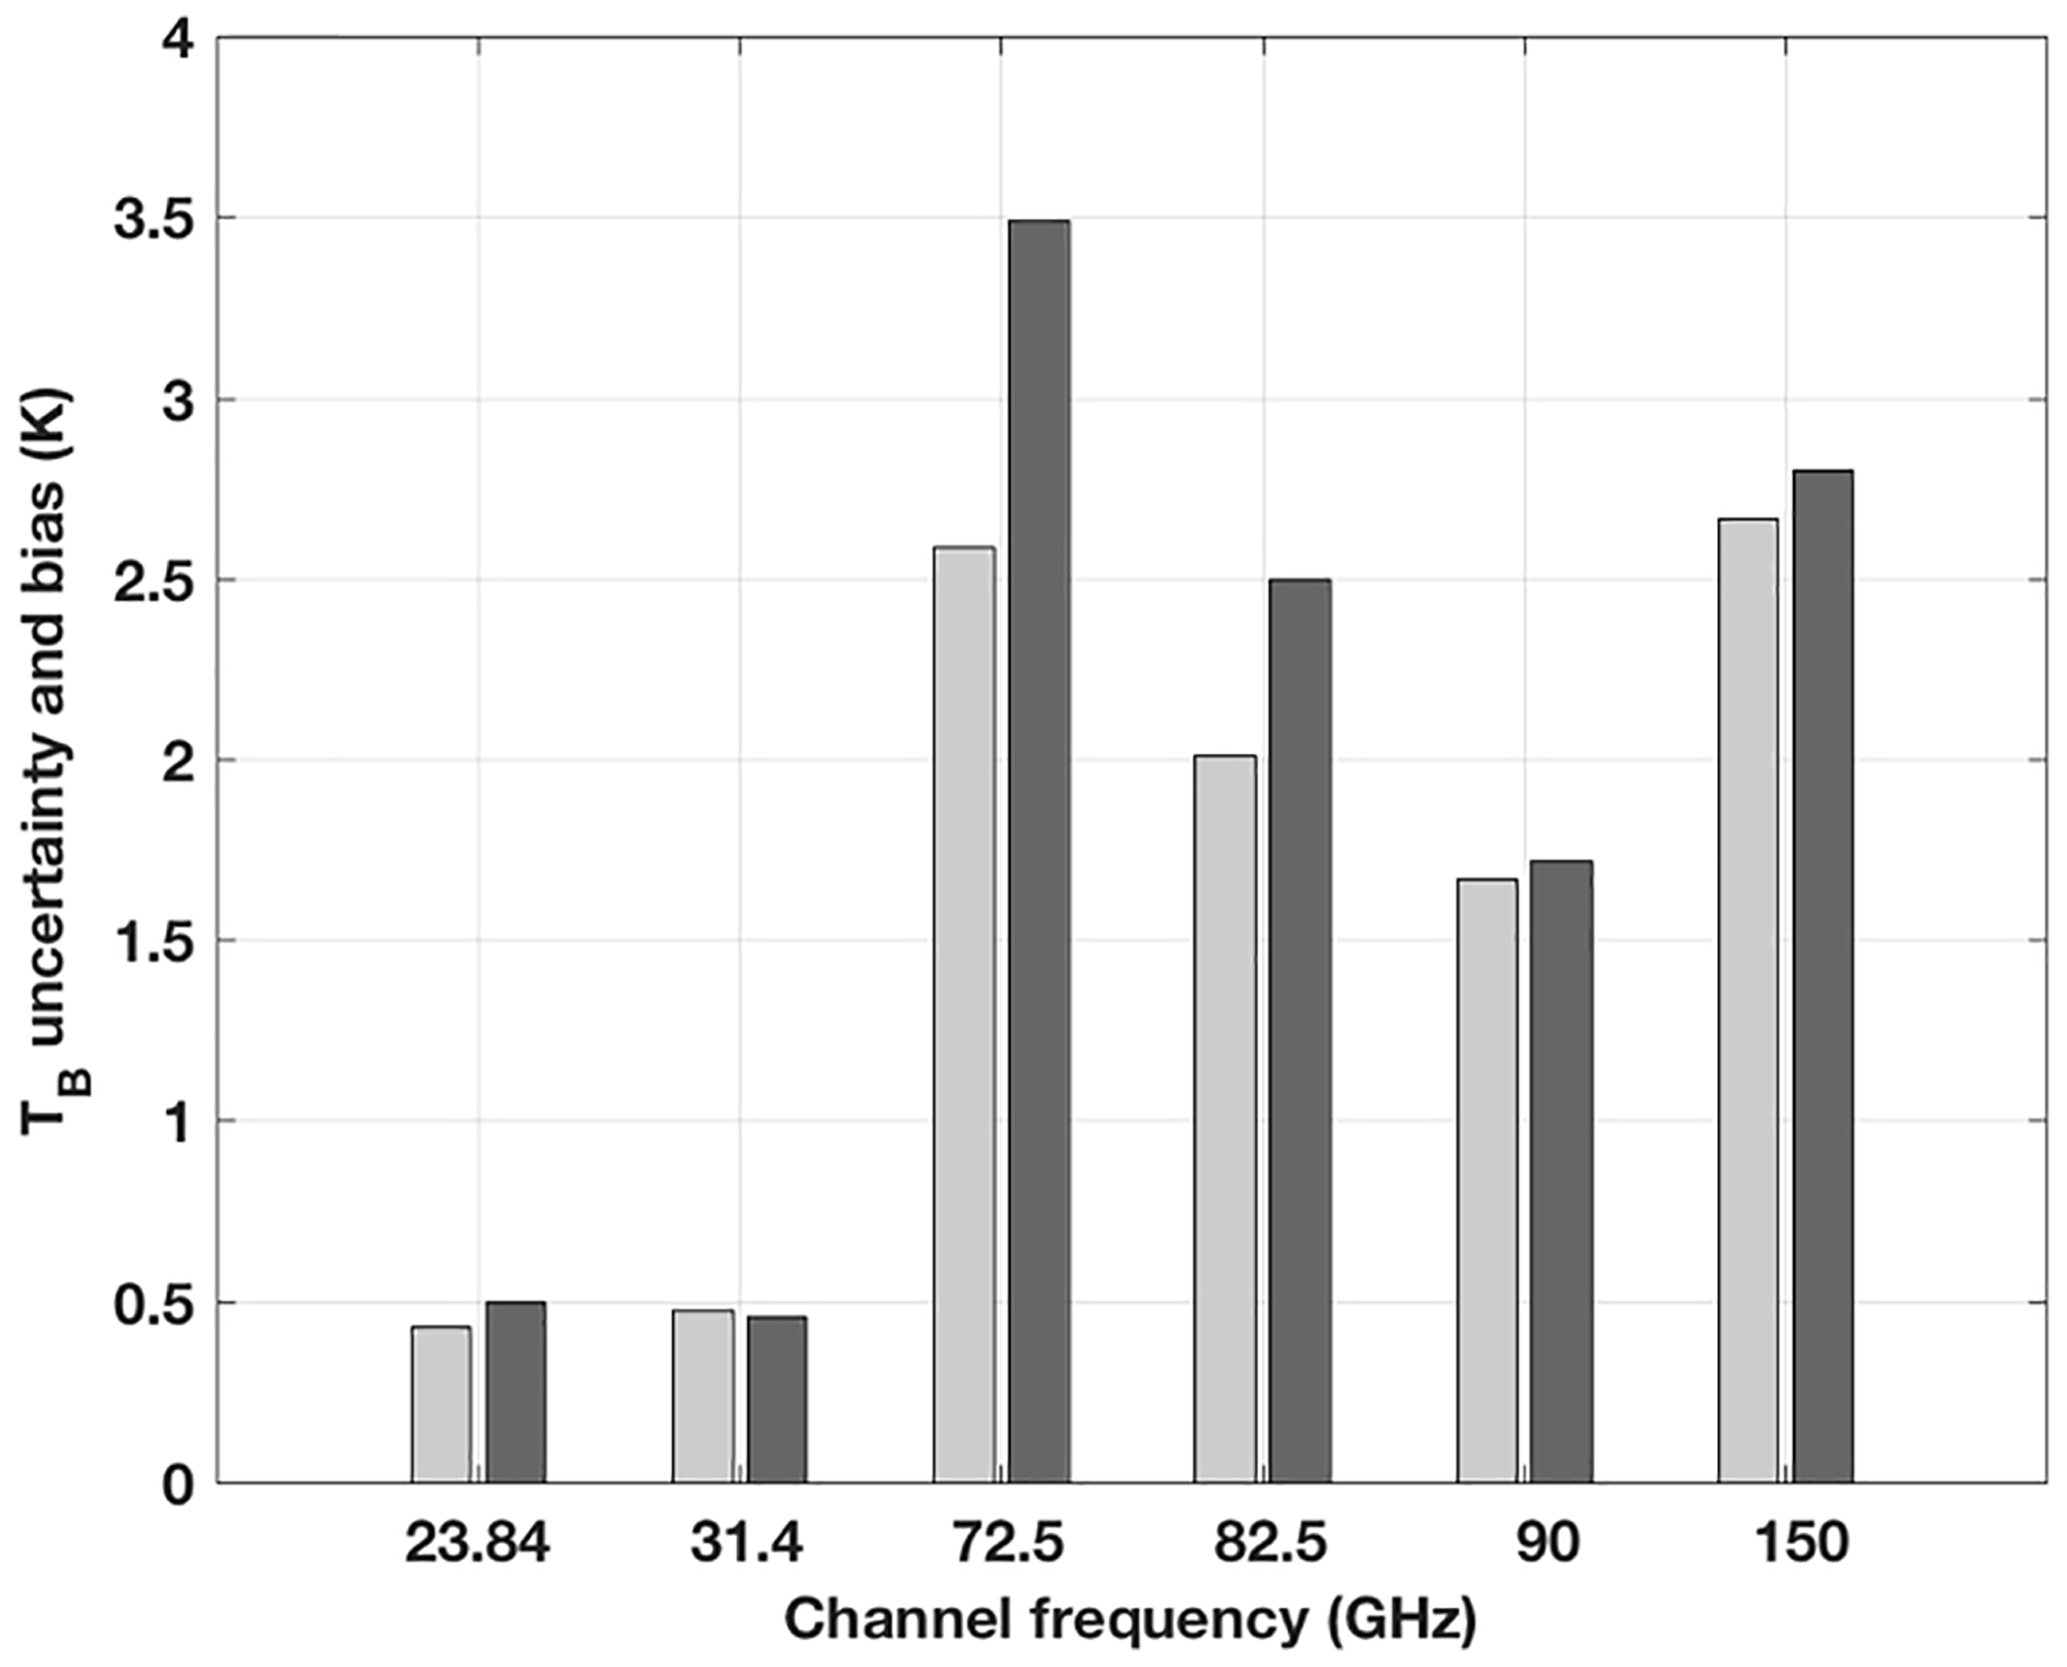
Figure 7Estimated uncertainty (light grey) and experimental mean difference (dark grey) for six LWP_K2W channels. Radiometric observations were collected in June–July in Milan (45∘ N) with the four lower-frequency channels, while they were collected in January–February in Lamont (36∘ N) with the two higher-frequency channels. Thus, uncertainty is estimated using midlatitude summer conditions for the four lower-frequency channels, while midlatitude winter conditions are used for the two higher-frequency channels.
RTTOV-gb v1.0 is now freely available, after website registration (see section code and data availability). The updates with respect to the original development (described in De Angelis et al., 2016) are presented here, including two additional sensors, an additional parameterization for the training atmospheric absorption model, and an estimate of the TB uncertainty.
RTTOV-gb v1.0 has been trained and validated against two versions of a reference line-by-line absorption model, i.e., R98 (Rosenkranz, 1998) and R17 (Rosenkranz, 2017). In the frequency range commonly covered by RTTOV-gb v1.0 sensors, TB rms differences are smaller than typical sensor uncertainties at all considered channels and for both the reference absorption models. TB computed with RTTOV-gb v1.0 from radiosonde profiles have been compared with simultaneous ground-based radiometric observations at six channels (23.84, 31.4, 72.5, 82.5, 90.0, and 150.0 GHz) and two observing elevation angles (35.3 and 90∘). Differences between simulated and measured TB are within uncertainty as expected from instrumental and simulation contributions. Future developments include additional sensors (e.g., at 183 GHz) and characterization of liquid water absorption uncertainties.
We expect this paper will provide a reference for the exploitation of RTTOV-gb for MWR data assimilation into NWP models, as has already started at some meteorological services in Europe as well as in other continents.
RTTOV-gb v1.0 is available to licensed users free of charge. RTTOV-gb may be obtained by registering (https://www.nwpsaf.eu/site/register/, last access: 14 November 2018) with the NWP SAF website (https://www.nwpsaf.eu/, last access: 14 November 2018, NWP SAF, 2018) and then selecting RTTOV-gb in your software preferences. Instructions for compiling and running RTTOV-gb are provided in the RTTOV-gb User Guide within the software package. The software package also includes scripts to verify the installation and FORTRAN code examples for running the RTTOV-gb forward and K (Jacobian) modules. RTTOV-gb is designed for UNIX/Linux systems. The software is now successfully tested on the following architectures and Fortran 90 compilers: Intel systems with gfortran, ifort, NAG, and pgf90, and Apple Mac systems with gfortran.
The RTTOV-gb v1.0 code is based on RTTOV v11.2 and the programming interface is identical to that version of RTTOV, though some inputs and outputs are not used by RTTOV-gb. The original RTTOV v11.2 can be obtained from the NWP SAF website (http://nwpsaf.eu/site/software/rttov/rttov-v11/, last access: 29 April 2019, Hocking and Rundle, 2019). Thus, the computational performances of RTTOV-gb is similar to that of RTTOV v11.2, which have been reported (https://www.nwpsaf.eu/site/download/documentation/rtm/docs_rttov11/Performance_Tests_RTTOV_v11.2.pdf, last access: 14 November 2018). For clear-sky microwave simulations, the main factor in simulation speed is the number of coefficient levels, which is 101 for RTTOV-gb. Typical clear-sky run times for RTTOV-gb are ∼0.25 ms per profile for the direct model and ∼1.0 ms per profile for the Jacobian model, though timings are dependent on the hardware, compiler, and compiler flags being used, as well as, for example, the number of levels in the input profile, the number of channels simulated per profile, and the inclusion or not of cloud liquid water.
Note that RTTOV-gb is not supported by NWP SAF. All questions, bug reports, or requests for new coefficients should be sent to rttovgb@aquila.infn.it. Always refer to the RTTOV-gb web page for bug fixes, new coefficients, and code updates: http://cetemps.aquila.infn.it/rttovgb/rttovgb.html (Cimini, 2019).
The RTTOV-gb package contains optical depth coefficient files for sensors supported by RTTOV-gb at the time of release. Coefficients for sensors not currently considered can be requested from rttovgb@aquila.infn.it. Note that RTTOV-gb currently only supports microwave sensors. Other resources include
-
default pressure levels: http://cetemps.aquila.infn.it/mwrnet/main_files/DAT/RTTOVgb_101_levels_p.dat, last access: 14 November 2018
-
regression coefficients: http://cetemps.aquila.infn.it/mwrnet/rttovgb_coefficients.html, last access: 14 November 2018
-
regression limits: http://cetemps.aquila.infn.it/mwrnet/main_files/DAT/RTTOVgb_101_pressure_levels_and_ regression_limits.xlsx, last access: 29 April 2019
-
NWP SAF profile sets used for the RTTOV-gb training and independent test: https://nwpsaf.eu/deliverables/rtm/profile_datasets.html, last access: 29 April 2019 (Rundle, 2019).
For more information on reference profiles and regression limits see the related link on the official RTTOV website (https://www.nwpsaf.eu/site/software/rttov/download/coefficients/coefficient-download/\#Reference_profiles_and_regression_limits).
Finally, the absorption model by Rosenkranz (2017) is available as a FORTRAN 77 code at https://doi.org/10.21982/M81013. Older versions, including the one used here (15 May 2017), are available at http://cetemps.aquila.infn.it/mwrnet/lblmrt_ns.html (last access: 14 November 2018). Microwave radiometer and radiosonde data in Lamont (OK, USA) are available through the Atmospheric Radiation Measurement (ARM) program (https://doi.org/10.5439/1150245).
The supplement related to this article is available online at: https://doi.org/10.5194/gmd-12-1833-2019-supplement.
DC, JH, and FDA designed the research, contributed to data processing and analysis, and wrote the original paper. PWR, PM, YYS, and MHA contributed to the investigation in Sect. 2. LL, CR, and FSM contributed with the curation of observed data. FDP, DG, SG, FR, ElR, and ErR contributed with software development. AC, EG, SL, SN, and MV contributed to validation data analysis. All coauthors helped to revise the paper.
The authors declare that they have no conflict of interest.
This work has been stimulated through COST Actions supported by COST (European Cooperation in Science and Technology). Support from the European Space Agency through the WRad project (ESA contract no. 4000125141/18/NL/AF) is acknowledged. Part of this research was funded by the Korea Meteorological Administration Research and Development Program under grant KMI2018-07410. Microwave radiometer and radiosonde data in Lamont (OK, USA) were obtained from the Atmospheric Radiation Measurement (ARM) User Facility, a U.S. Department of Energy (DOE) Office of Science user facility managed by the Office of Biological and Environmental Research.
This paper was edited by Klaus Gierens and reviewed by two anonymous referees.
Atmospheric Radiation Measurement (ARM): user facility 2006, updated daily, Microwave Radiometer – High Frequency (MWRHFCAL150), 2012-01-01 to 2012-02-29, Southern Great Plains (SGP) Central Facility, Lamont, OK (C1), compiled by: Cadeddu, M. and Ghate, V., ARM Data Center, https://doi.org/10.5439/1150245, 2018a.
Atmospheric Radiation Measurement (ARM): user facility 1994, updated daily, Balloon-borne sounding system (SONDEWNPN), 2012-01-01 to 2012-02-29, Southern Great Plains (SGP) Central Facility, Lamont, OK (C1), compiled by: Coulter, R., Prell, J., Ritsche, M., and Holdridge, D., ARM Data Center, https://doi.org/10.5439/1150245, 2018b.
Cadeddu, M. P., Liljegren, J. C., and Turner, D. D.: The Atmospheric radiation measurement (ARM) program network of microwave radiometers: instrumentation, data, and retrievals, Atmos. Meas. Tech., 6, 2359–2372, https://doi.org/10.5194/amt-6-2359-2013, 2013.
Cimini, D.: RTTOV-gb, available at: http://cetemps.aquila.infn.it/rttovgb/rttovgb.html, last access: 29 April 2019.
Cimini, D., Westwater, E. R., Gasiewski, A. J., Klein, M., Leusky, V., and Liljegren, J.: Ground-based millimeter- and submillimiter-wave observations of low vapor and liquid water contents, IEEE T. Geosci. Remote, 45, 2169–2180, https://doi.org/10.1109/TGRS.2007.897450, 2007.
Cimini, D., Rosenkranz, P. W., Tretyakov, M. Y., Koshelev, M. A., and Romano, F.: Uncertainty of atmospheric microwave absorption model: impact on ground-based radiometer simulations and retrievals, Atmos. Chem. Phys., 18, 15231–15259, https://doi.org/10.5194/acp-18-15231-2018, 2018.
Clough, S. A., Shephard, M. W., Mlawer, E. J., Delamere, J. S., Iacono, M. J., Cady-Pereira, K., Boukabara, S., and Brown, P. D.: Atmospheric radiative transfer modeling: a summary of the AER codes, J. Quant. Spectrosc. Ra., 9, 233–244, 2005.
De Angelis, F., Cimini, D., Hocking, J., Martinet, P., and Kneifel, S.: RTTOV-gb – adapting the fast radiative transfer model RTTOV for the assimilation of ground-based microwave radiometer observations, Geosci. Model Dev., 9, 2721–2739, https://doi.org/10.5194/gmd-9-2721-2016, 2016.
De Angelis, F., Cimini, D., Löhnert, U., Caumont, O., Haefele, A., Pospichal, B., Martinet, P., Navas-Guzmán, F., Klein-Baltink, H., Dupont, J.-C., and Hocking, J.: Long-term observations minus background monitoring of ground-based brightness temperatures from a microwave radiometer network, Atmos. Meas. Tech., 10, 3947–3961, https://doi.org/10.5194/amt-10-3947-2017, 2017.
Eyre, J. R.: A fast radiative transfer model for satellite sounding systems, ECMWF Research Dept. Tech. Memo. 176, available at: https://www.ecmwf.int/file/22131/download?token=8Z5Jws9c (last access: 27 April 2019), 1991.
Hocking, J. and Rundle, D.: RTTOV v11 web page, available at: http://nwpsaf.eu/site/software/rttov/rttov-v11/, last access: 29 April 2019.
Hocking, J., Rayer, P., Saunders, R., Madricardi, M., Geer, A., Brunel, P., and Vidot, J.: RTTOV v11 Users Guide, Doc ID: NWPSAF-MO-UD-028, available at: https://www.nwpsaf.eu/site/download/documentation/rtm/docs_rttov11/users_guide_11_v1.4.pdf (last access: 14 November 2018), 2015.
Illingworth, A. J., Cimini, D., Gaffard, C., Haeffelin, M., Lehmann, V., Löhnert, U., O'Connor, E., and Ruffieux, D.: Exploiting Existing Ground-Based Remote Sensing Networks To Improve High Resolution Weather Forecasts, B. Am. Meteorol. Soc., 2015, 2107–2125, https://doi.org/10.1175/BAMS-D-13-00283.1, 2015.
Illingworth, A. J., Cimini, D., Haefele, A., Haeffelin, M., Hervo, M., Kotthaus, S., Löhnert, U., Martinet, P., Mattis, I., O'Connor, E. J., and Potthast, R.: How can Existing Ground-Based Profiling Instruments Improve European Weather Forecasts?, B. Am. Meteorol. Soc., https://doi.org/10.1175/BAMS-D-17-0231.1, in press, 2019.
Joint Committee for Guides in Metrology (JCGM): Evaluation of Measurement Data – Guide to the Expression of Uncertainty in Measurement, available at: https://www.bipm.org/utils/common/documents/jcgm/JCGM_100_2008_E.pdf (last access: 25 May 2018), 2008.
Liebe, H. J.: MPM – An atmospheric millimeter wave propagation model, Int. J. Infrared Milli., 10, 631–650, 1989.
Liljegren, J. C., Boukabara, S. A., Cady-Pereira, K., and Clough, S. A.: The effect of the half-width of the 22-GHz water vapor line on retrievals of temperature and water vapor profiles with a twelve-channel microwave radiometer, IEEE T. Geosci. Remote, 43, 1102–1108, https://doi.org/10.1109/TGRS.2004.839593, 2005.
National Research Council: Committee on Developing Mesoscale Meteorological Observational Capabilities to Meet Multiple Needs, Observing Weather and Climate from the Ground Up: A Nationwide Network of Networks, ISBN: 978-0-309-12986-2, 250 pp., 2008.
Navas-Guzmán, F., Kämpfer, N., Schranz, F., Steinbrecht, W., and Haefele, A.: Intercomparison of stratospheric temperature profiles from a ground-based microwave radiometer with other techniques, Atmos. Chem. Phys., 17, 14085–14104, https://doi.org/10.5194/acp-17-14085-2017, 2017.
NWP SAF: Numerical Weather Prediction, Supporting the use of satellite data for NWP, available at: https://www.nwpsaf.eu/site/, last access: 14 November 2018.
Payne, V. H., Delamere, J. S., Cady-Pereira, K. E., Gamache, R. R., Moncet, J.-L., Mlawer, E. J., and Clough, S. A.: Air-broadened half-widths of the 22 and 183 GHz water vapor lines, IEEE T. Geosci. Remote, 46, 3601–3617, 2008.
Riva, C., Capsoni, C., Luini, L., Luccini, M., Nebuloni, R., and Martellucci, A.: The challenge of using the W band in satellite communication, Int. J. Satell. Comm. N., 32, 187–200, https://doi.org/10.1002/sat.1050, 2014.
Rosenkranz, P. W.: Water vapor microwave continuum absorption: A comparison of measurements and models, Radio Sci., 33, 919–928, https://doi.org/10.1029/98RS01182, 1998.
Rosenkranz, P. W.: Line-by-line microwave radiative transfer (non-scattering), Remote Senssing Code Library, https://doi.org/10.21982/M81013, 2017.
Rundle, D.: NWP SAF profile datasets, web page, available at: https://nwpsaf.eu/deliverables/rtm/profile_datasets.html, last access: 29 April 2019.
Saunders, R., Hocking, J., Rundle, D., Rayer, P., Havemann, S., Matricardi, M., Geer, A., Lupu, C., Brunel, P., and Vidot, J.: RTTOV-12 Science and validation report, Doc ID: NWPSAF-MO-TV-41, Version 1.0, 16 February 2017, available at: https://www.nwpsaf.eu/site/download/documentation/rtm/docs_rttov12/rttov12_svr.pdf (last access: 11 January 2018), 2017.
Saunders, R., Hocking, J., Turner, E., Rayer, P., Rundle, D., Brunel, P., Vidot, J., Roquet, P., Matricardi, M., Geer, A., Bormann, N., and Lupu, C.: An update on the RTTOV fast radiative transfer model (currently at version 12), Geosci. Model Dev., 11, 2717–2737, https://doi.org/10.5194/gmd-11-2717-2018, 2018.
Stähli, O., Murk, A., Kämpfer, N., Mätzler, C., and Eriksson, P.: Microwave radiometer to retrieve temperature profiles from the surface to the stratopause, Atmos. Meas. Tech., 6, 2477–2494, https://doi.org/10.5194/amt-6-2477-2013, 2013.
Tretyakov, M. Yu., Koshelev, M. A., Dorovskikh, V. V., Makarov, D. S., and Rosenkranz, P. W.: 60 GHz oxygen band: precise broadening and central frequencies of fine structure lines, absolute absorption profile at atmospheric pressure, and revision of mixing coefficients, J. Mol. Spectrosc., 231, 1–14, https://doi.org/10.1016/j.jms.2004.11.011, 2005.
Turner, D. D., Clough, S. A., Liljegren, J. C., Clothiaux, E. E., Cady-Pereira, K. E., and Gaustad, K. L.: Retrieving liquid water path and precipitable water vapor from the Atmospheric Radiation Measurement (ARM) microwave radiometers, IEEE T. Geosci. Remote, 45, 3680–3690, https://doi.org/10.1109/TGRS.2007.903703, 2007.
Turner, E., Rayer, P., and Saunders, R.: AMSUTRAN: A microwave transmittance code for satellite remote sensing, J. Quant. Spectrosc. Ra., 227, 117–129, https://doi.org/10.1016/j.jqsrt.2019.02.013, 2019.