the Creative Commons Attribution 4.0 License.
the Creative Commons Attribution 4.0 License.
 | 28 May 2019
The quasi-equilibrium framework revisited: analyzing long-term CO2 enrichment responses in plant–soil models
Mingkai Jiang
Sönke Zaehle
Martin G. De Kauwe
Anthony P. Walker
Silvia Caldararu
David S. Ellsworth
Belinda E. Medlyn
Elevated carbon dioxide (CO2) can increase plant growth, but the magnitude of this CO2 fertilization effect is modified by soil nutrient availability. Predicting how nutrient availability affects plant responses to elevated CO2 is a key consideration for ecosystem models, and many modeling groups have moved to, or are moving towards, incorporating nutrient limitation in their models. The choice of assumptions to represent nutrient cycling processes has a major impact on model predictions, but it can be difficult to attribute outcomes to specific assumptions in complex ecosystem simulation models. Here we revisit the quasi-equilibrium analytical framework introduced by Comins and McMurtrie (1993) and explore the consequences of specific model assumptions for ecosystem net primary productivity (NPP). We review the literature applying this framework to plant–soil models and then analyze the effect of several new assumptions on predicted plant responses to elevated CO2. Examination of alternative assumptions for plant nitrogen uptake showed that a linear function of the mineral nitrogen pool or a linear function of the mineral nitrogen pool with an additional saturating function of root biomass yield similar CO2 responses at longer timescales (>5 years), suggesting that the added complexity may not be needed when these are the timescales of interest. In contrast, a saturating function of the mineral nitrogen pool with linear dependency on root biomass yields no soil nutrient feedback on the very-long-term (>500 years), near-equilibrium timescale, meaning that one should expect the model to predict a full CO2 fertilization effect on production. Secondly, we show that incorporating a priming effect on slow soil organic matter decomposition attenuates the nutrient feedback effect on production, leading to a strong medium-term (5–50 years) CO2 response. Models incorporating this priming effect should thus predict a strong and persistent CO2 fertilization effect over time. Thirdly, we demonstrate that using a “potential NPP” approach to represent nutrient limitation of growth yields a relatively small CO2 fertilization effect across all timescales. Overall, our results highlight the fact that the quasi-equilibrium analytical framework is effective for evaluating both the consequences and mechanisms through which different model assumptions affect predictions. To help constrain predictions of the future terrestrial carbon sink, we recommend the use of this framework to analyze likely outcomes of new model assumptions before introducing them to complex model structures.
- Article
(2340 KB) -
Supplement
(208 KB) - BibTeX
- EndNote


Predicting how plants respond to atmospheric carbon dioxide (CO2) enrichment (eCO2) under nutrient limitation is fundamental for an accurate estimate of the global terrestrial carbon (C) budget in response to climate change. There is now ample evidence that the response of terrestrial vegetation to eCO2 is modified by soil nutrient availability (Fernández-Martínez et al., 2014; Norby et al., 2010; Reich and Hobbie, 2012; Sigurdsson et al., 2013). Over the past decade, land surface models have developed from C-only models to carbon–nitrogen (CN) models (Gerber et al., 2010; Zaehle and Friend, 2010). The inclusion of CN biogeochemistry has been shown to be essential to capture the reduction in the CO2 fertilization effect with declining nutrient availability and therefore its implications for climate change (Zaehle et al., 2015). However, it has also been shown that models incorporating different assumptions predict very different vegetation responses to eCO2 (Lovenduski and Bonan, 2017; Medlyn et al., 2015). Careful examination of model outputs has provided insight into the reasons for the different model predictions (De Kauwe et al., 2014; Medlyn et al., 2016; Walker et al., 2014, 2015; Zaehle et al., 2014), but it is generally difficult to attribute outcomes to specific assumptions in these plant–soil models that differ in structural complexity and process feedbacks (Lovenduski and Bonan, 2017; Medlyn et al., 2015; Thomas et al., 2015).
Understanding the mechanisms underlying predictions of ecosystem carbon cycle processes is fundamental for the validity of prediction across space and time. Comins and McMurtrie (1993) developed an analytical framework, the “quasi-equilibrium” approach, to make model predictions traceable to their underlying mechanisms. The approach is based on the two-timing approximation method (Ludwig et al., 1978) and makes use of the fact that ecosystem models typically represent a series of pools with different equilibration times. The method involves the following: (1) choosing a time interval (τ) such that the model variables can be divided into “fast” pools (which approach effective equilibrium at time τ) and “slow” pools (which change only slightly at time τ); (2) holding the slow pools constant and calculating the equilibria of the fast pools (an effective equilibrium as this is not a true equilibrium of the entire system); and (3) substituting the fast pool effective equilibria into the original differential equations to give simplified differential equations for the slow pools at time τ.
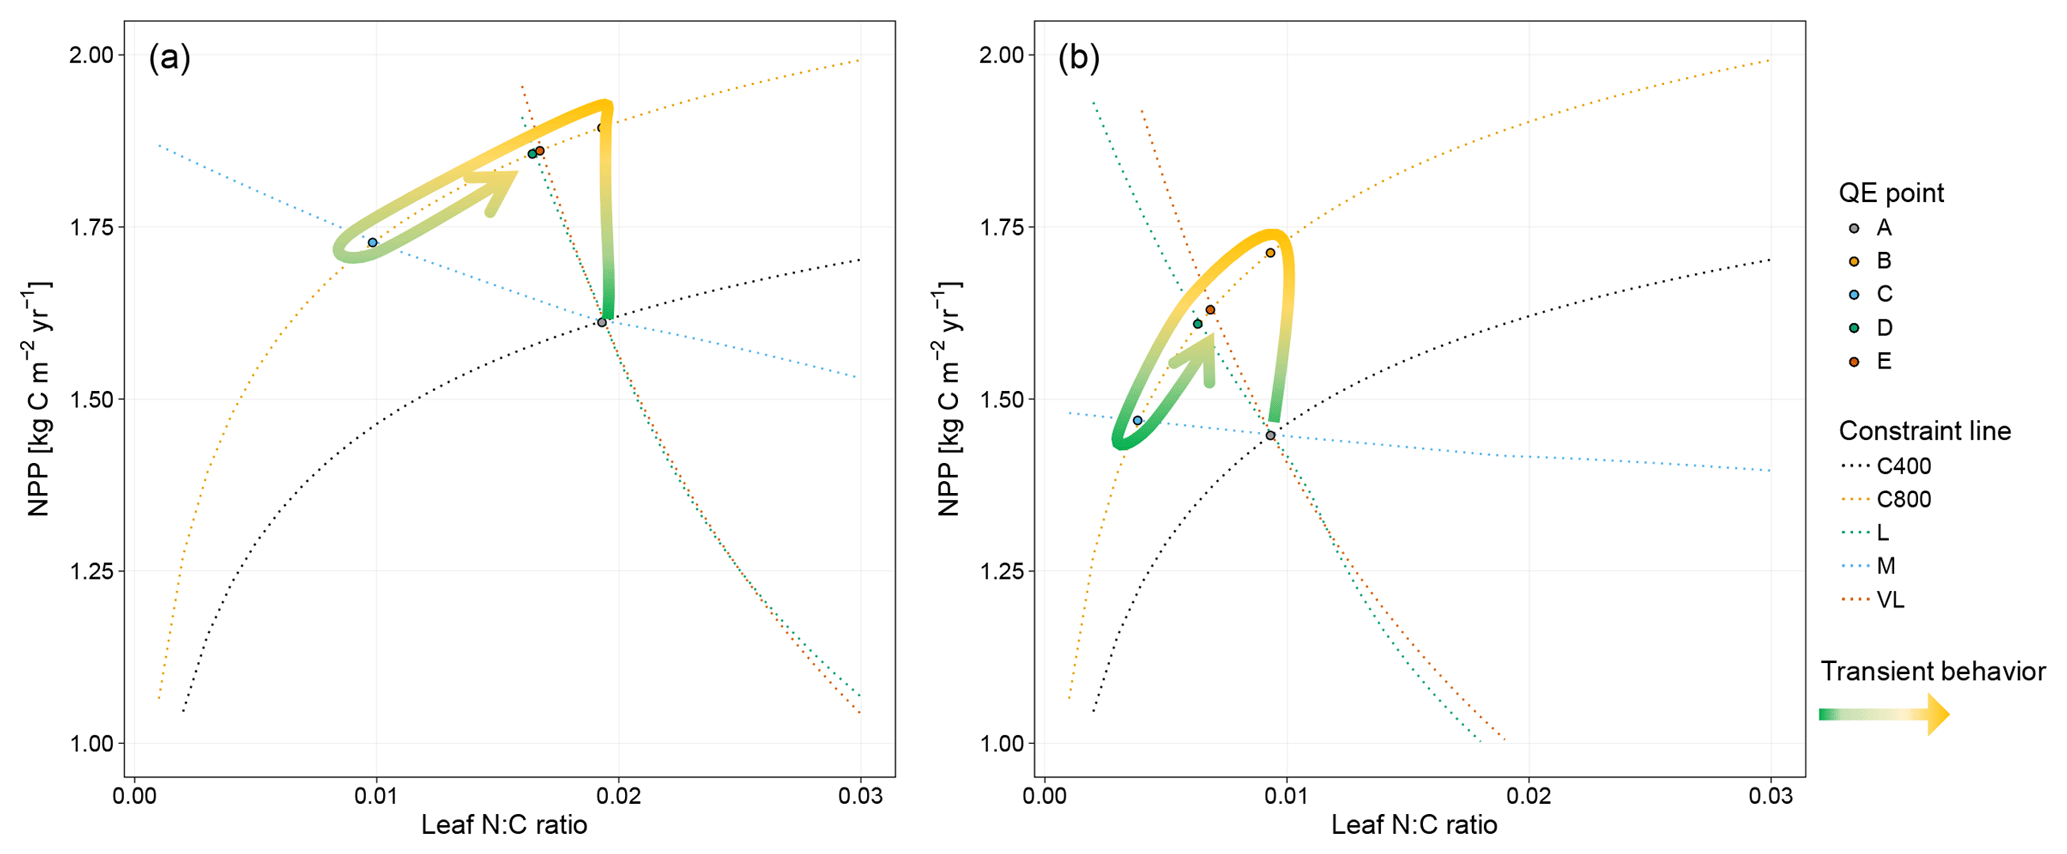
Figure 1Graphic expression of the baseline quasi-equilibrium framework in understanding plant production response to elevated CO2 based on photosynthetic (C400, C800 refer to CO2=400 and 800 ppm, respectively) and nitrogen cycling constraints in the medium (M), long (L), and very long (VL) terms under the assumption of a (a) variable wood N : C ratio and a (b) fixed wood N : C ratio. The photosynthetic constraint is an analytical expression of the Farquhar leaf photosynthesis model that relates leaf chemistry (i.e., N : C ratio) to production, simplifying leaf to canopy scaling. The nutrient recycling constraint is an analytical expression of the soil nutrient downregulation effect on production, assuming soil organic matter structures as in Fig. 2. The quasi-equilibrium points at various timescales (A, C, D, and E) were calculated by solving for the intersection of the photosynthetic and nutrient cycling constraints through the two-timing approximation. Initially the system is in equilibrium between photosynthetic N demand and soil N supply at CO2=400 ppm (A). The instantaneous response to a doubling of CO2 is a sharp increase in production at a constant leaf N concentration (B). Under nutrient-limited conditions, the soil N supply cannot sustain this increase in production over time. A negative feedback moves the quasi-equilibrium point towards point C, where the M-term pools equilibrate with eCO2. The system gradually moves toward point D and E as the L and VL pools equilibrate. The downward slopes of the N recycling constraint curves with an increasing leaf N : C ratio are due to the increased proportional loss of mineralized N through leaching as the rate of N cycling increases with leaf N concentration.
In a CN model, plant net primary production (NPP) can be estimated from two constraints based on equilibration of the C balance (the “photosynthetic constraint”) and the N balance (the “nitrogen recycling constraint”) (Comins and McMurtrie, 1993). Both constraints link NPP with leaf chemistry (i.e., N : C ratio) (derivation in Sect. 3.1). The simulated production occurs at the intersection of these two constraint curves (shown graphically in Fig. 1). To understand behavior on medium and long timescales (e.g., wood and slow and passive soil organic pools in Fig. 2; 20–200 years), one can assume that plant pools with shorter equilibration times in the model (e.g., foliage, fine-root, or active soil organic pools in Fig. 2) have reached quasi-equilibrium, and model dynamics are thus driven by the behavior of the longer-timescale pools.

Figure 2Framework of the Generic Decomposition And Yield (G'DAY) model. Boxes represent pools; arrowed lines represent fluxes. Boxes with dotted boundaries are M-term recycling pools (wood and slow soil). Box filled with diamonds is the L-term recycling pool (passive soil).
The recent era of model development has seen some significant advances in representing complex plant–soil interactions, but models still diverge in future projections of CO2 fertilization effects on NPP (Friend et al., 2014; Koven et al., 2015; Walker et al., 2015). A recent series of multi-model intercomparison studies has demonstrated the importance of understanding underlying response mechanisms in determining model response to future climate change (Medlyn et al., 2015), but this can be difficult to achieve in complex global models. The quasi-equilibrium framework is a relatively simple but quantitative method to examine the effect of different assumptions on model predictions. As such, it complements more computationally expensive sensitivity analyses and can be used as an effective tool to provide a priori evaluation of both the consequence and mechanism through which different new model implementations affect model predictions.
Here, by constructing a quasi-equilibrium framework based on the structure of the Generic Decomposition And Yield (G'DAY) model (Comins and McMurtrie, 1993), we evaluate the effects on plant responses to eCO2 of some recently developed model assumptions incorporated into ecosystem models, for example the Community Land Model (CLM) (Oleson et al., 2004), the Community Atmosphere–Biosphere Land Exchange (CABLE) model (Kowalczyk et al., 2006), the Lund–Potsdam–Jena (LPJ) model (Smith et al., 2001), the JSBACH model (Goll et al., 2017b), and the O-CN model (Zaehle et al., 2010). Specifically, we test how different functions affecting plant N uptake influence NPP responses to eCO2 at various quasi-equilibrium time steps. The present study is a continuation of the series of quasi-equilibrium studies reviewed in Sect. 2, with a general aim of helping researchers to understand the similarities and differences of predictions made by different process-based models, as demonstrated in Sect. 3.
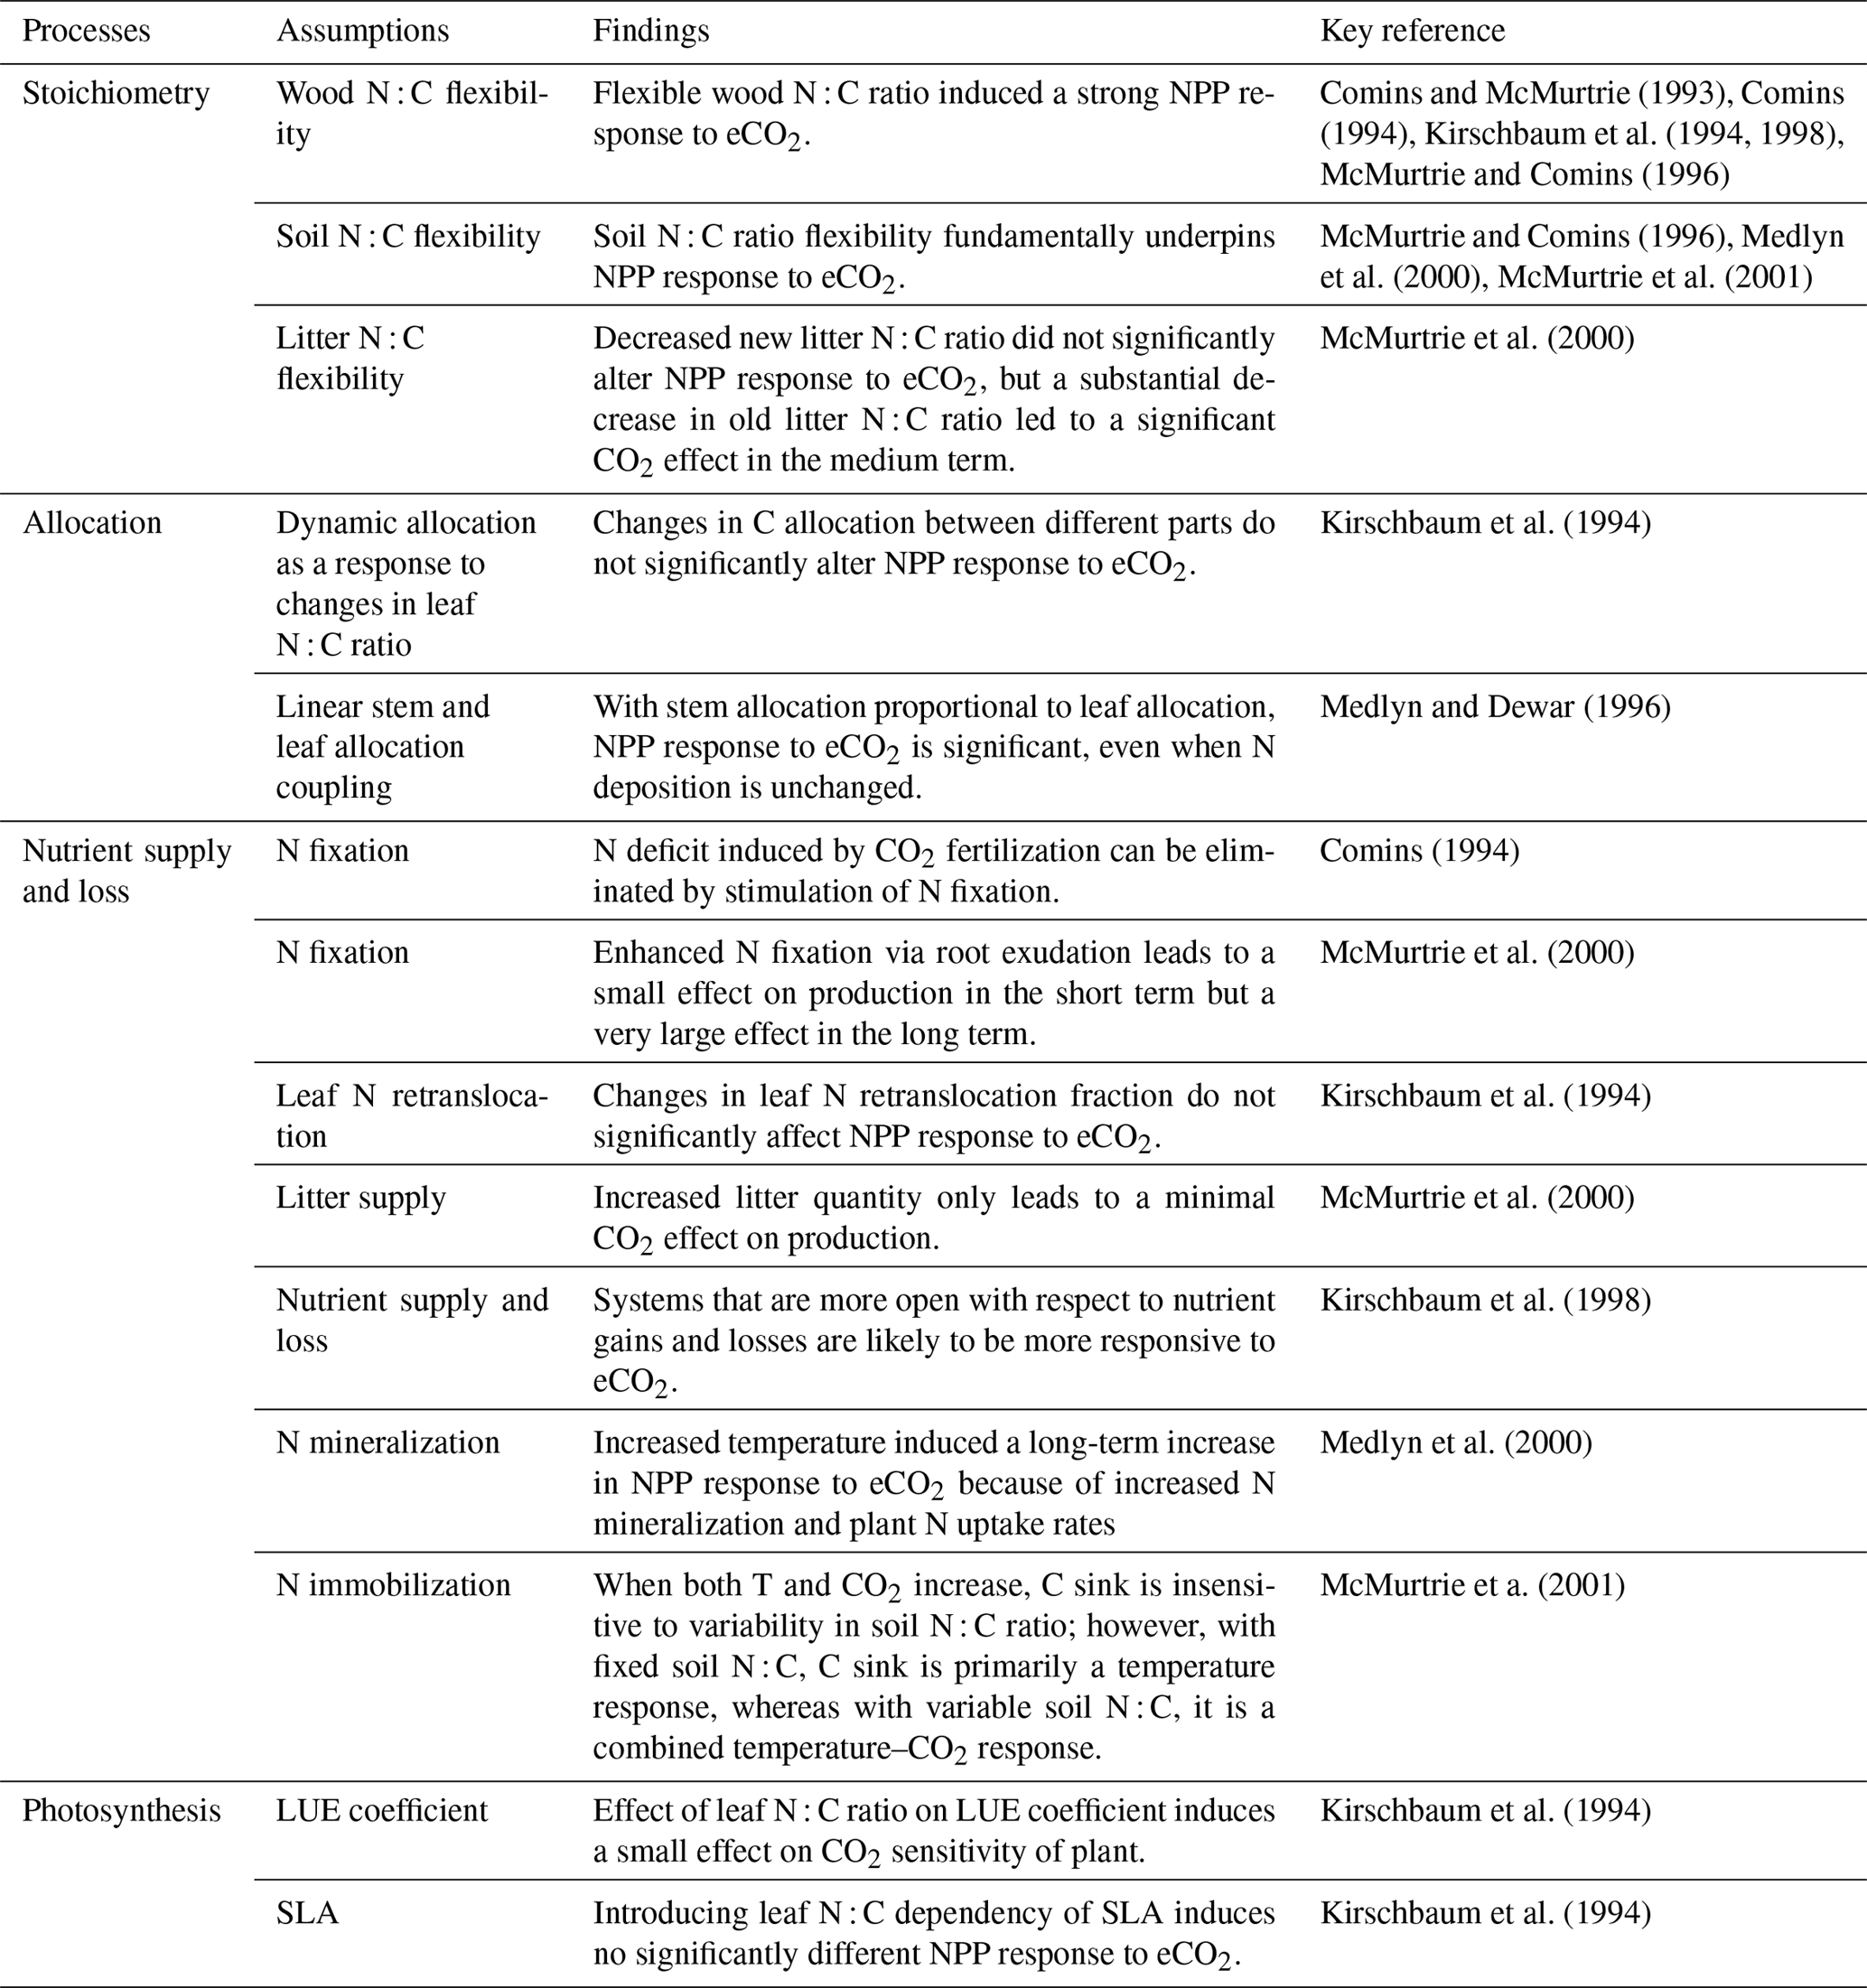
Many of the assumptions currently being incorporated into CN models have previously been explored using the quasi-equilibrium framework; here we provide a brief literature review describing the outcomes of this work (Table 1). Firstly, the flexibility of plant and soil stoichiometry has recently been highlighted as a key assumption (Stocker et al., 2016; Zaehle et al., 2014). A key finding from early papers applying the quasi-equilibrium framework was that model assumptions about the flexibility of the plant wood N : C ratio (Comins, 1994; Comins and McMurtrie, 1993; Dewar and McMurtrie, 1996; Kirschbaum et al., 1994, 1998; McMurtrie and Comins, 1996; Medlyn and Dewar, 1996) and soil N : C ratio (McMurtrie and Comins, 1996; McMurtrie et al., 2001; Medlyn et al., 2000) were critical determinants of the magnitude of the transient (10 to >100 years) plant response to eCO2 (Fig. 1). Different to the effect of foliar N : C ratio flexibility, which has an instantaneous effect on photosynthesis, the flexibility of the wood N : C ratio controls the flexibility of nutrient storage per unit biomass accumulated in the slow turnover pool. Therefore, a constant wood N : C ratio, such as was assumed in CLM4 (Thornton et al., 2007; Yang et al., 2009), means that effectively a fixed amount of N is locked away from the active processes such as photosynthesis on the timescale of the life span of the woody tissue. In contrast, a flexible wood N : C ratio, such as was tested in O-CN (Meyerholt and Zaehle, 2015), allows variable N storage in the woody tissue and consequently more nutrients available for C uptake on the transient timescale. Similarly, flexibility in the soil N : C ratio determines the degree of the soil N cycle feedback (e.g., N immobilization and mineralization) and therefore its effect on plant response to eCO2. A large response to eCO2 occurs when the soil N : C ratio is allowed to vary, whereas there could be little or no response if the soil N : C ratio is assumed to be inflexible (McMurtrie and Comins, 1996).
Table 1A brief summary of the processes and model assumptions evaluated based on the quasi-equilibrium analyses. SLA: specific leaf area; LUE: light-use efficiency.
Changes in plant allocation with eCO2 are also a source of disagreement among current models (De Kauwe et al., 2014). The quasi-equilibrium framework has been used to investigate a number of different plant C allocation schemes (Comins and McMurtrie, 1993; Kirschbaum et al., 1994; Medlyn and Dewar, 1996). For example, Medlyn and Dewar (1996) suggested that plant long-term growth responses to eCO2 depend strongly on the extent to which stem and foliage allocations are coupled. With no coupling (i.e., fixed allocation of C and N to stemwood), plant growth was not responsive to eCO2; with linear coupling (i.e., allocation to stemwood proportional to foliage allocation), a significant long-term increase in total growth following eCO2 was found (Fig. S1 in the Supplement). The reason for this is similar to the argument behind wood N : C ratio flexibility: decreasing C allocation to wood decreases the rate of N removal per unit of C invested in growth. In contrast, Kirschbaum et al. (1994) found that changes in allocation between different parts of a plant only marginally changed the CO2 sensitivity of production at different timescales. The fundamental difference between the two allocation schemes was that Kirschbaum et al. (1994) assumed that the root allocation coefficient was determined by a negative relationship with the foliar N : C ratio, meaning that the increase in foliar N : C ratio would lead to a decreased root allocation and increased wood and foliage allocation, whereas Medlyn and Dewar (1996) investigated stem–foliage allocation coupling without introducing a feedback via the foliar N : C ratio. The comparison of the two allocation schemes is indicative of the underlying causes of model prediction divergence in recent inter-model comparisons (De Kauwe et al., 2014; Walker et al., 2015).
Another hypothesis currently being explored in models is the idea that increased belowground allocation can enhance nutrient availability under elevated CO2 (Dybzinski et al., 2014; Guenet et al., 2016). Comins (1994) argued that the N deficit induced by CO2 fertilization could be eliminated by the stimulation of N fixation. This argument was explored in more detail by McMurtrie et al. (2000), who assumed that eCO2 led to a shift in allocation from wood to root exudation, which resulted in enhanced N fixation. They showed that, although the increase in N fixation could induce a large eCO2 response in NPP over the long term, a slight decrease in NPP was predicted over the medium term. This decrease occurred because increased exudation at eCO2 increased soil C input, causing increased soil N sequestration and lowering the N available for plant uptake. Over the long term, however, both NPP and C storage were greatly enhanced because the sustained small increase in N input led to a significant build-up in total ecosystem N on this timescale.
The interaction between rising CO2 and warming under nutrient limitation is of key importance for future simulations. Medlyn et al. (2000) demonstrated that short-term plant responses to warming, such as physiological acclimation, are overridden by the positive effects of warming on soil nutrient availability in the medium to long term. Similarly, McMurtrie et al. (2001) investigated how the flexibility of the soil N : C ratio affects predictions of the future C sink under elevated temperature and CO2. They showed that assuming an inflexible soil N : C ratio with elevated temperature would mean a release of nitrogen with enhanced decomposition, leading to a large plant uptake of N to enhance growth. In contrast, an inflexible soil N : C ratio would mean that the extra N mineralized under elevated temperature is largely immobilized in the soil and there is hence a smaller increase in C storage. This effect of soil N : C stoichiometry on the response to warming is opposite to the effect on eCO2 described above. Therefore, under a scenario in which both temperature and CO2 increase, the C sink strength is relatively insensitive to soil N : C variability, but the relative contributions of temperature and CO2 to this sink differ under different soil N : C ratio assumptions (McMurtrie et al., 2001). This outcome may explain the results observed by Bonan and Levis (2010) when comparing coupled carbon cycle–climate simulations. The Terrestrial Ecosystem Model (TEM; Sokolov et al., 2008) and CLM (Thornton et al., 2009), which assumed inflexible stoichiometry, had a large climate–carbon feedback but a small CO2 concentration-carbon feedback, contrasting with the O-CN model (Zaehle et al., 2010), which assumed flexible stoichiometry and had a small climate–carbon feedback and a large CO2 concentration–carbon feedback. Variations among models in this stoichiometric flexibility assumption could also potentially explain the trade-off between CO2 and temperature sensitivities observed by Huntzinger et al. (2017).
This section combines both methods and results together because equation derivation is fundamental to the analytical and graphic interpretation of model performance within the quasi-equilibrium framework. Below we first describe the baseline simulation model and derivation of the quasi-equilibrium constraints (Sect. 3.1); we then follow with analytical evaluations of new model assumptions using the quasi-equilibrium framework (Sect. 3.2). Within each subsection (Sect. 3.2.1 to 3.2.3), we first provide key equations for each assumption and the derivation of the quasi-equilibrium constraints with these new assumptions; we then provide our graphic interpretations and analyses to understand the effect of the model assumption on plant NPP responses to eCO2.
More specifically, we tested alternative model assumptions for three processes that affect plant carbon–nitrogen cycling: (1) Sect. 3.2.1 evaluates different ways of representing plant N uptake, namely plant N uptake as a fixed fraction of mineral N pools, as a saturating function of the mineral N pool linearly depending on root biomass (Zaehle and Friend, 2010), or as a saturating function of root biomass linearly depending on the mineral N pool (McMurtrie et al., 2012); (2) Sect. 3.2.2 tests the effect the potential NPP approach that downregulates potential NPP to represent N limitation (Oleson et al., 2004); and (3) Sect. 3.2.3 evaluates root exudation and its effect on the soil organic matter decomposition rate (i.e., priming effect). The first two assumptions have been incorporated into some existing land surface model structures (e.g., CLM, CABLE, O-CN, LPJ), whereas the third is a framework proposed following the observation that models did not simulate some key characteristic observations of the DukeFACE experiment (Walker et al., 2015; Zaehle et al., 2014) and therefore could be of importance in addressing some model limitations in representing soil processes (van Groenigen et al., 2014; Zaehle et al., 2014). It is our purpose to demonstrate how one can use this analytical framework to provide an a priori and generalizable understanding of the likely impact of new model assumptions on model behavior without having to run a complex simulation model. Here we do not target specific ecosystems to parameterize the model but anticipate the analytical interpretation of the quasi-equilibrium framework to be of general applicability for woody-dominated ecosystems. One could potentially adopt the quasi-equilibrium approach to provide case-specific evaluations of model behavior against observations (e.g., constraining the likely range of wood N : C ratio flexibility).
3.1 Baseline model and derivation of the quasi-equilibrium constraints
Our baseline simulation model is similar in structure to G'DAY (Generic Decomposition And Yield; Comins and McMurtrie, 1993), a generic ecosystem model that simulates biogeochemical processes (C, N, and H2O) at daily or sub-daily time steps. A simplified G'DAY model version that simulates plant–soil C–N interactions at a weekly time step was developed for this study (Fig. 2). In G'DAY, plants are represented by three stoichiometrically flexible pools: foliage, wood, and roots. Each pool turns over at a fixed rate. Litter enters one of four litter pools (metabolic and structural aboveground and belowground) and decomposes at a rate dependent on the litter N : C ratio, soil moisture, and temperature. Soil organic matter (SOM) is represented as active, slow, and passive pools, which decay according to first-order decay functions with different rate constants. Plants access nutrients from the mineral N pool, which is an explicit pool supplied by SOM decomposition and an external input, which is assumed to be constant, as a simplified representation of fixation and atmospheric deposition.
Table 2Definitions of key variables for the baseline equations.
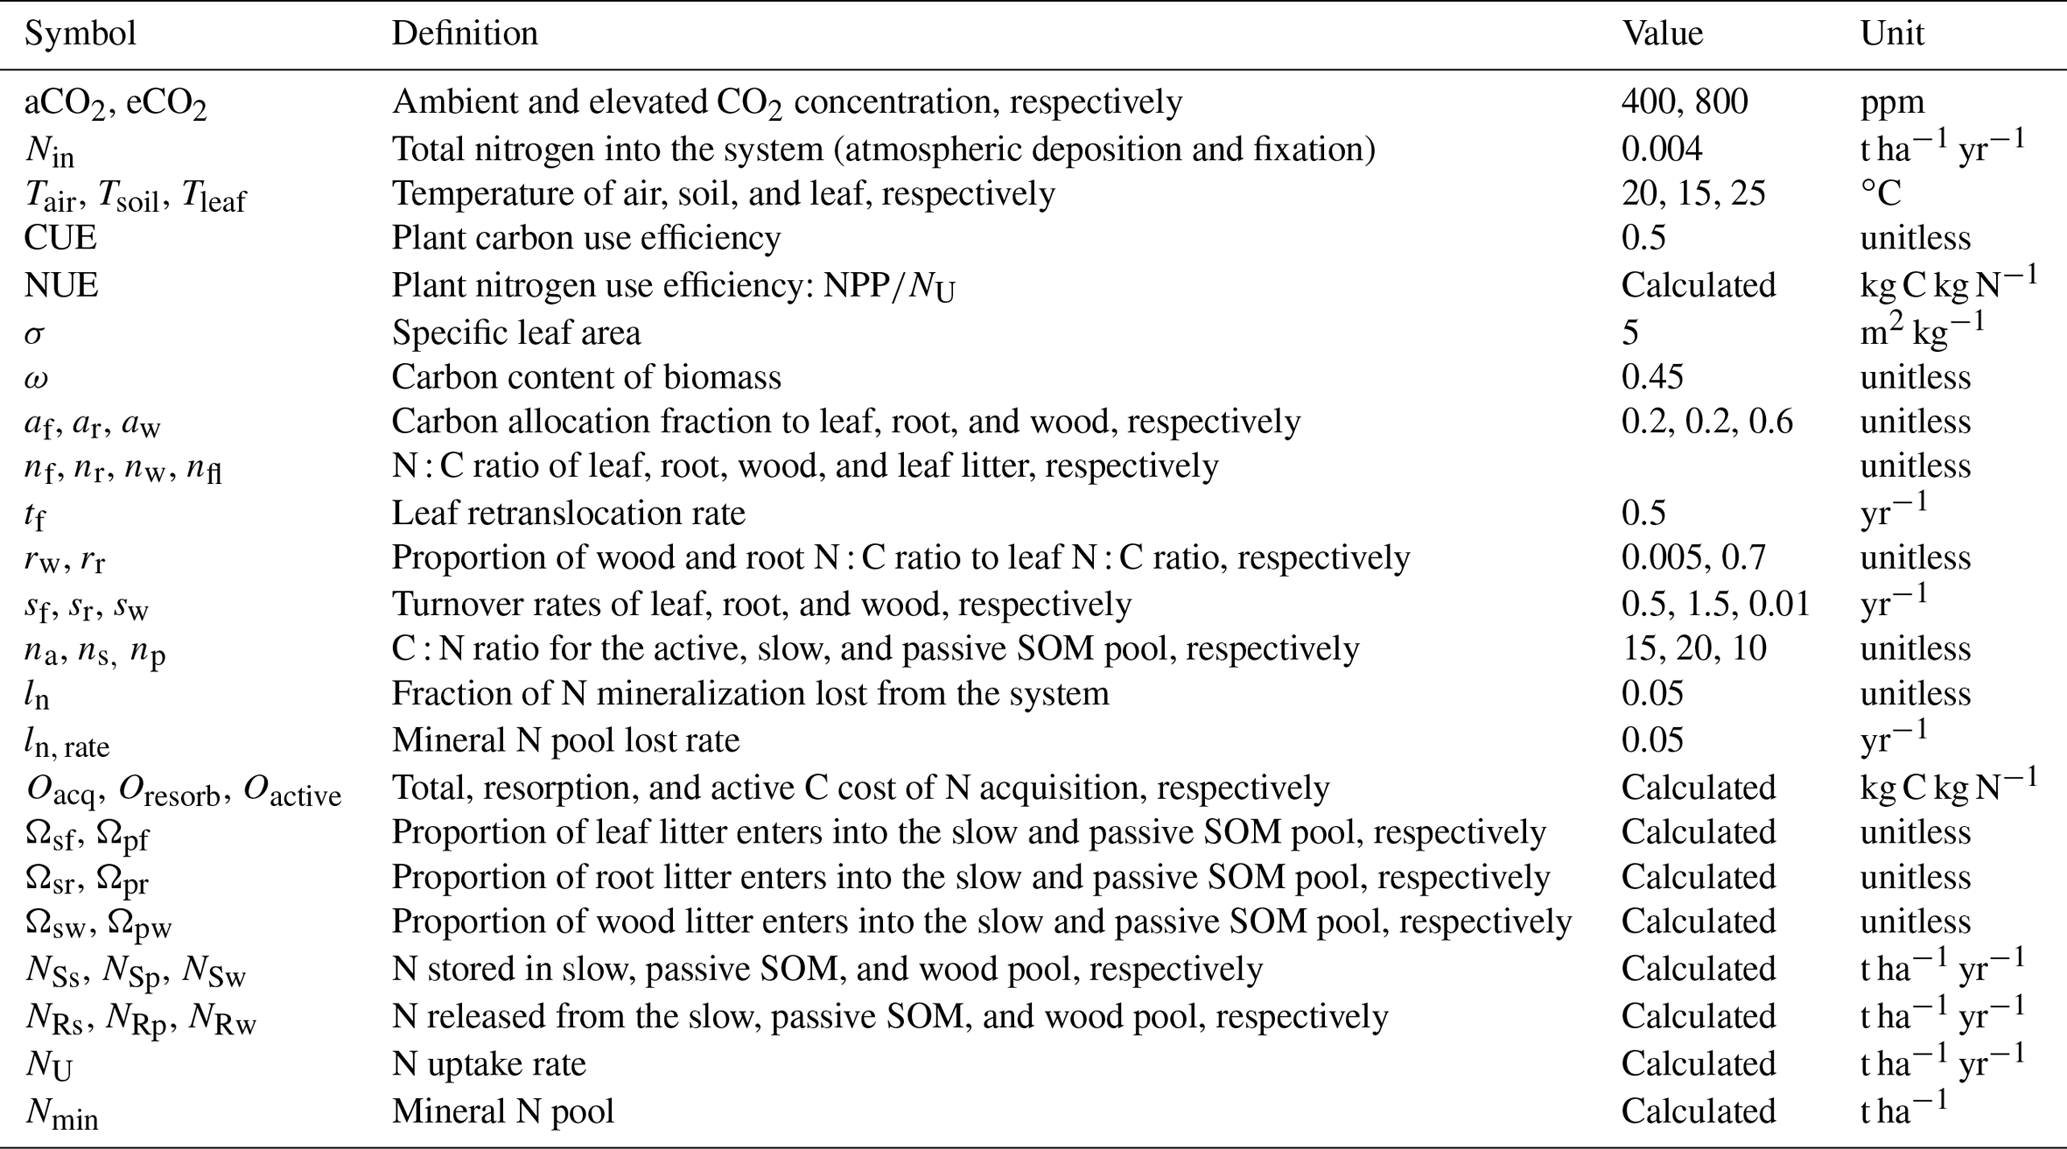
The baseline simulation model further assumes the following: (1) gross primary production (GPP) is a function of a light-use efficiency (LUE), which depends on the foliar N : C ratio (nf) and atmospheric CO2 concentration (Ca) (Appendix A1); (2) carbon use efficiency (the ratio NPP : GPP) is constant; (3) allocation of newly fixed carbon among foliage (af), wood (aw), and root (ar) pools is constant; (4) foliage (nf), wood (nw), and root N : C (nr) ratios are flexible; (5) wood and root N : C ratios are proportional to the foliar N : C ratio, with constants of proportionality rw and rr, respectively; (6) a constant proportion (tf) of foliage N is retranslocated before leaves senesce; (7) active, slow, and passive SOM pools have fixed N : C ratios; and (8) an N uptake constant determines the plant N uptake rate. Definitions of the parameters and forcing variables are summarized in Table 2. For all simulations, the ambient CO2 concentration (aCO2) was set at 400 ppm and eCO2 at 800 ppm.
We now summarize the key derivation of the two quasi-equilibrium constraints, the photosynthetic constraint, and the nutrient cycling constraint from our baseline simulation model (details provided in Appendix A1 and A2). The derivation follows Comins and McMurtrie (1993), which is further elaborated in work by McMurtrie et al. (2000) and Medlyn and Dewar (1996) and evaluated by Comins (1994). First, the photosynthetic constraint is derived by assuming that the foliage C pool (Cf) has equilibrated. Following the GPP and CUE assumptions (see above) and the detailed derivations made in Appendix A1, there is an implicit relationship between NPP and nf:
where I0 is the incident radiation, k is the canopy light extinction coefficient, and σ is the specific leaf area. This equation is the photosynthetic constraint, which relates NPP to nf.
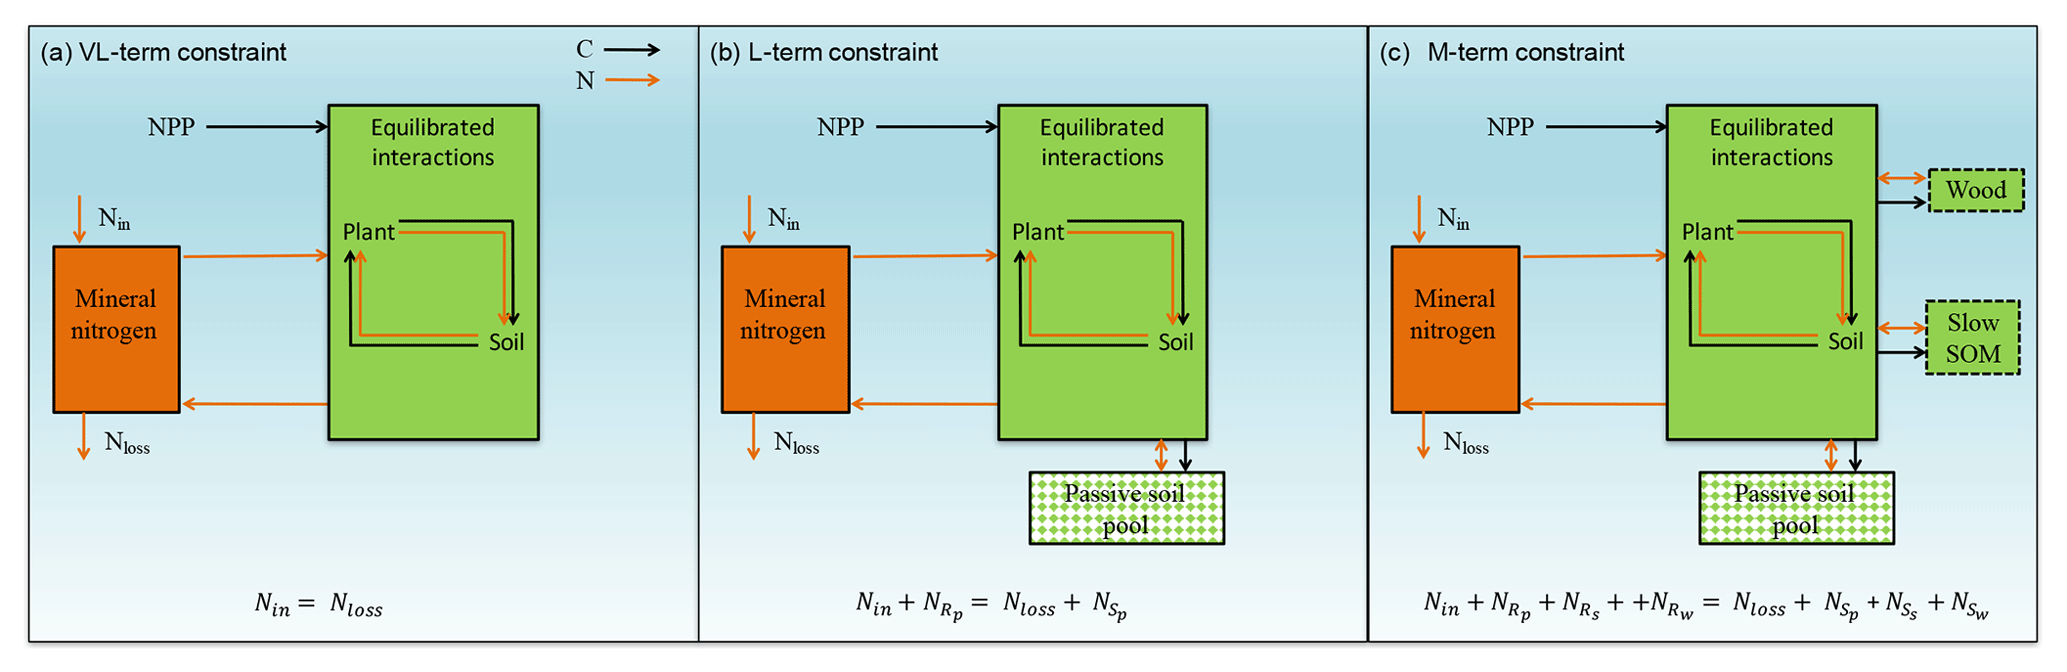
Figure 3Graphic and mathematical illustrations of the (a) very-long-term (VL), (b) long-term (L), and (c) medium-term (M) nutrient recycling constraints. The VL constraint considers all plant–soil processes to be in equilibrium, the L constraint considers all but passive SOM to be in equilibrium, and the M constraint considers all but the woody biomass, slow, and passive SOM pools to be in equilibrium.
Secondly, the nitrogen cycling constraint is derived by assuming that nitrogen inputs to and outputs from the equilibrated pools are equal. Based on the assumed residence times of the passive SOM (∼400 years), slow SOM (15 years), and woody biomass (50 years) pools, we can calculate the nutrient recycling constraint at three different timescales (conceptualized in Fig. 3): very long (VL, >500 years, all pools equilibrated), long (L, 100–500 years, all pools equilibrated except the passive pool), or medium (M, 5–50 years, all pools equilibrated except slow, passive, and wood pools). In the VL term, we have
where Nin is the total N input into the system, and Nloss is the total N lost from the system via leaching and volatilization. Analytically, with some assumptions about plant N uptake (Appendix A2), we can transform Eq. (2) into a relationship between NPP and nf, expressed as
where ln is the fraction of N mineralization that is lost, af; aw and ar are the allocation coefficients for foliage, wood, and roots, respectively, and nfl, nw, and nr are the N : C ratios for foliage litter, wood, and roots, respectively. Since nw and nr are assumed proportional to nf (Table 2), the nutrient recycling constraint also links NPP and nf. The intersection with the photosynthetic constraint yields the very-long-term equilibria of both NPP and nf. Similarly, we can write the nitrogen recycling constraint in the L term and M term as a function between NPP and nf (details explained in Appendix A2). Their respective interaction with the photosynthetic constraint yields the L-term and M-term equilibria points of both NPP and nf (Figs. 1 and 3). Essentially, at each timescale, there are two unknowns (NPP and nf) to be resolved via both the nitrogen recycling constraint and the photosynthetic constraint equations. Based on this set of analytical equations, one can evaluate how different assumptions affect the behavior of the model quantitatively. Below, we describe how different new model assumptions affect the predicted plant response to a doubling of the CO2 concentration at various timescales.
3.2 Evaluations of new model assumptions based on the quasi-equilibrium framework
3.2.1 Explicit plant N uptake
We now move to considering new model assumptions. We first consider different representations of plant N uptake. In the baseline model, the mineral N pool (Nmin) is implicit, as we assumed that all mineralized N in the soil is either taken up by plants (NU) or lost from the system (Nloss). Here, we evaluate three alternative model representations in which plant N uptake depends on an explicit Nmin pool and their effects on plant responses to eCO2. We consider plant N uptake as (1) a fixed coefficient of the mineral N pool, (2) a saturating function of root biomass and a linear function of the mineral N pool (McMurtrie et al., 2012), and (3) a saturating function of the mineral N pool and a linear function of root biomass. The last function has been incorporated into some land surface models, for example, O-CN (Zaehle and Friend, 2010) and CLM (Ghimire et al., 2016), while the first two have been incorporated into G'DAY (Corbeels et al., 2005).
A mineral N pool was made explicit by specifying a constant coefficient (u) to regulate the plant N uptake rate (i.e., ). N lost from the system is a function of the mineral N pool (Nmin) regulated by a loss rate (ln, rate, yr−1). For the VL-term equilibrium, we have Nin=Nloss, which means , and hence
where nfl is the foliage litter N : C ratio, which is proportional to nf (Table 2). At the VL equilibrium, we can rearrange the above equation to relate NPP to nf:
which indicates that the N cycling constraint for NPP is inversely dependent on nf.
The second function represents plant N uptake as a saturating function of root biomass (Cr) and a linear function of the mineral N pool (McMurtrie et al., 2012), expressed as
where Kr is a constant. At the VL equilibrium, we have and , where sr is the lifetime of the root. Substituting for Cr in Eq. (6), we relate NU to NPP:
Since NU is also a function of NPP, we can rearrange and get
Comparing with Eq. (5), here NPP is also inversely dependent on nf but with an additional negative offset of . The third approach to represent N uptake (e.g., O-CN and CLM) expresses N uptake as a saturating function of mineral N also linearly depending on root biomass (Zaehle and Friend, 2010), according to
where K is a constant coefficient, and Vmax is the maximum root N uptake capacity simplified as a constant here. Since NU is also a function of NPP, we get
This equation sets a limit to possible values of nf. In equilibrium, for Nmin to be nonzero, we need . The N loss rate is still proportional to the mineral N pool, so Nloss is given by
The above equation provides an Nloss term that no longer depends on NPP but only on nf. If the N leaching loss is the only system N loss, the VL-term nutrient constraint no longer involves NPP, implying that the full photosynthetic CO2 fertilization effect is realized. The L- and M-term nutrient recycling constraints, however, are still NPP dependent due to feedbacks from the slowly recycling wood and SOM pools (e.g., Eq. A11–A15).
Table 3Magnitudes of the CO2 fertilization effect on net primary production (NPP) at various time steps for different model assumptions. NPPa and NPPe represent the very-long-term equilibrium point of NPP at ambient and elevated CO2 conditions, respectively. I, M, L, and VL represent percent change in NPP as a result of elevated CO2 at instantaneous, medium-, long-, and very-long-term time points, respectively. All experiments except “baseline, fixed wood NC” assume a variable wood N : C ratio.
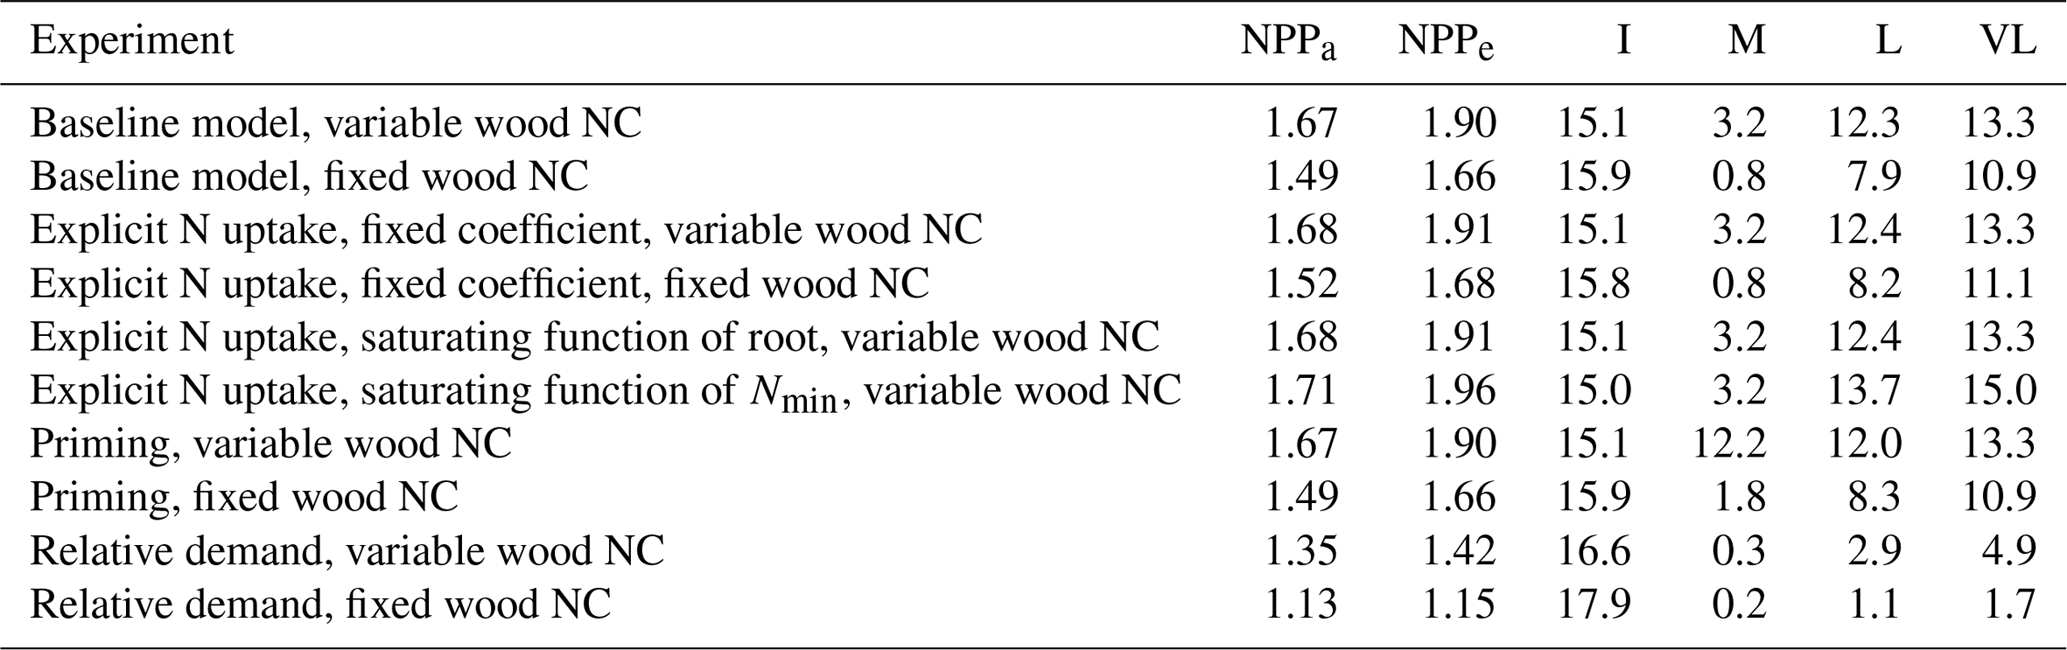
Table 4Relationship between nitrogen uptake coefficient (u) and quasi-equilibrium points of leaf N : C ratio (nf) and net primary production (NPP) in the very long (VL), long (L), medium (M) and instantaneous time points.
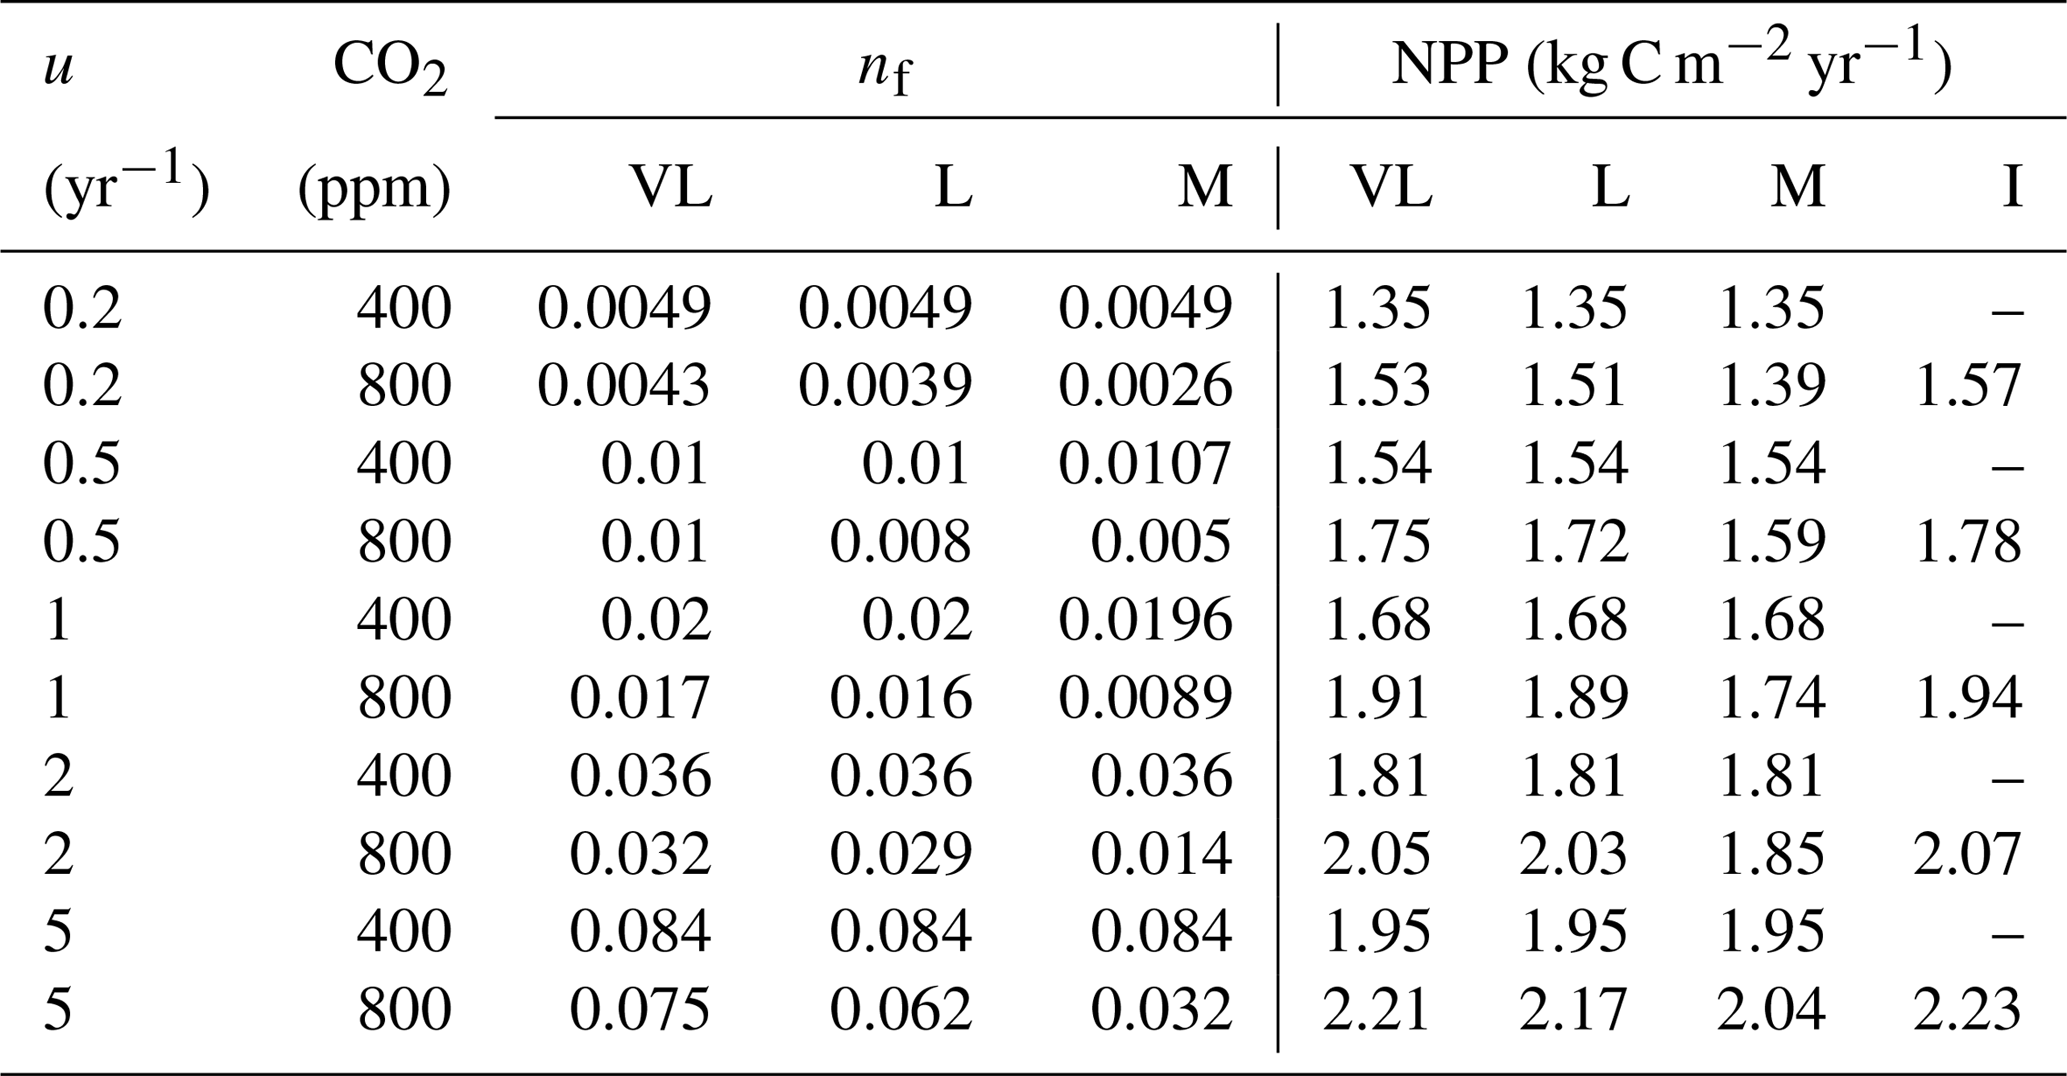
The impacts of these alternative representations of N uptake are shown in Fig. 4. First, the explicit consideration of the mineral N pool with a fixed uptake constant (u) of 1 yr−1 has little impact on the transient response to eCO2 when compared to the baseline model (Figs. 4a, 1a, Table 3). Varying u does not strongly (<5 %) affect plant responses to CO2 fertilization at different time steps (Fig. S2). This is because u is only a scaling factor of NPP, meaning it affects NPP but not its response to eCO2 (Table 4), as depicted by Eq. (5).

Figure 4Graphic interpretation of the effect of different nutrient uptake assumptions on plant response to CO2 fertilization. Functions are (a) plant N uptake as a function of a constant coefficient, with a variable wood N : C ratio assumption, (b) plant N uptake as a saturating function of root biomass linearly depending upon the mineral N pool, and (c) plant N uptake as a saturating function of the mineral N pool linearly depending upon root biomass. Constraint lines C400, C800, M, L, and VL refer to photosynthetic constraints at CO2=400 ppm, CO2=800 ppm, medium-term, long-term, and very-long-term nutrient recycling constraints, respectively. Point A is the quasi-equilibrium point at CO2=400 ppm, point B is the instantaneous response point at elevated CO2, and points C, D, and E are the M-, L-, and VL-term equilibrium points at elevated CO2. The N uptake coefficient is set to 1 yr−1.
Moreover, the approach that assumes N uptake as a saturating function of root biomass linearly depending on the mineral P pool (McMurtrie et al., 2012) has comparable eCO2 effects on production to the baseline and the fixed uptake coefficient models (Fig. 4b, Table 3). Essentially, if is small, we can approximate NPP by , which shares a similar structure to the baseline and fixed uptake coefficient models (Eqs. 8, 5, and A10). Furthermore, Eq. (8) also depicts the fact that an increase in ar should lead to higher NPP, and an increase in sr or Kr should lead to decreased NPP. However, these predictions depend on assumptions of ln,rate and nf. If ln,rate or nf is small, NPP would be relatively less sensitive to ar,Kr, or sr.
By comparison, representing N uptake as a saturating function of mineral N linearly depending on root biomass (Ghimire et al., 2016; Zaehle and Friend, 2010) no longer involves the VL-term nutrient recycling constraint on production (Fig. 4c), which is predicted by Eq. (11). Actual VL-term NPP is determined only by nf along with the photosynthetic constraint, meaning that the full CO2 fertilization effect on production is realized with the increase in CO2. The magnitudes of the CO2 fertilization effect at other time steps are comparable to those of the baseline model (Table 3) because the Nloss term is smaller than the Nw,NSp, or NSs terms, meaning it has a relatively smaller effect on NPP at equilibrium. However, steeper nutrient recycling constraint curves are observed (Fig. 4c), indicating a stronger sensitivity of the NPP response to changes in nf.
3.2.2 Potential NPP
In several vegetation models, including CLM-CN, CABLE, and JSBACH, potential (non-nutrient-limited) NPP is calculated from light, temperature, and water limitations. Actual NPP is then calculated by downregulating the potential NPP to match nutrient supply. Here we term this the potential NPP approach. We examine this assumption in the quasi-equilibrium framework following the implementation of this approach adopted in CLM-CN (Bonan and Levis, 2010; Thornton et al., 2007). The potential NPP is reduced if mineral N availability cannot match the demand from plant growth:
where Pdem is the plant N demand, and NPPpot is the potential NPP of the plant. Writing as nplant, the whole-plant N : C ratio, and the whole-soil N : C ratio as nsoil, we can calculate the immobilization N demand as
where f is the fraction of litter C that becomes soil C, Clit is the total litter C pool, and st is the turnover time of the litter pool. Actual plant N uptake is expressed as
Actual NPP is expressed as
For the VL constraint, we have Nin=Nloss. We can calculate NPPpot as
For an actual NPP, we need to consider the immobilization demand. Rearranging the above, we get
This equation removes the NPPact dependence on NPPpot. It can be shown that the fraction of ) depends only on the N : C ratios and f, not on NPPpot. This means that there will be no eCO2 effect on NPPact.
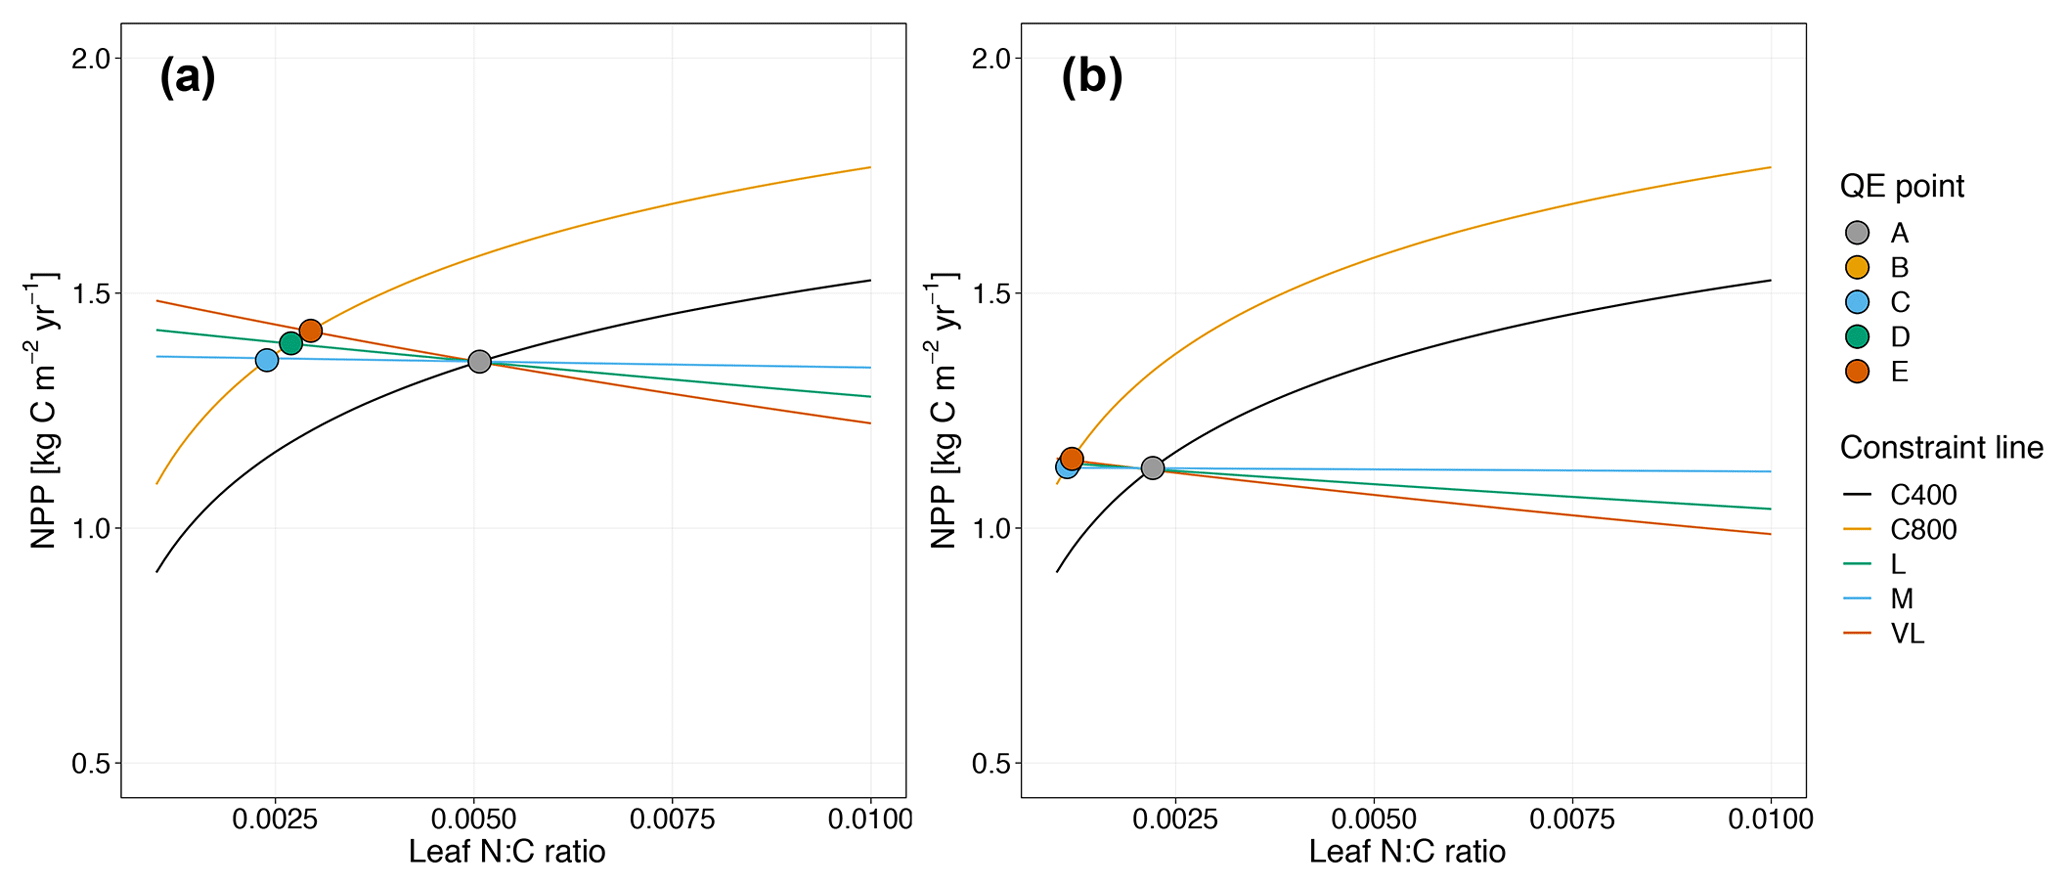
Figure 5Graphic interpretation of the effect on CO2 responses with models incorporating the relative demand assumption based on variable (a) and fixed (b) wood N : C ratio assumptions. Constraint lines C400, C800, M, L, and VL refer to photosynthetic constraints at CO2=400 ppm, CO2=800 ppm, medium-term, long-term, and very-long-term nutrient recycling constraints, respectively. Point A is the quasi-equilibrium point at CO2=400 ppm, point B is the instantaneous response point at elevated CO2, and points C, D, and E are the M-, L-, and VL-term equilibrium points at elevated CO2.
As shown in Fig. 5a, the potential NPP approach results in relatively flat nutrient recycling constraint curves, suggesting that the CO2 fertilization effect is only weakly influenced by soil N availability. Despite a sharp instantaneous NPP response, CO2 fertilization effects on NPPact are small on the M-, L-, and VL-term timescales (Table 3). This outcome can be understood from the governing equation for the nutrient recycling constraint, which removes NPPact dependence on NPPpot (Eq. 17). Although in the first instance, the plant can increase its production, over time the litter pool increases in size proportionally to NPPpot, meaning that immobilization demand increases to match the increased plant demand, which leads to no overall change in the relative demands from the plant and the litter. This pattern is similar under alternative wood N : C ratio assumptions (Fig. 5b, Table 3).
3.2.3 Root exudation to prime N mineralization
The priming effect is described as the stimulation of the decomposition of native soil organic matter caused by larger soil carbon input under eCO2 (van Groenigen et al., 2014). Experimental studies suggest that this phenomenon is widespread and persistent (Dijkstra and Cheng, 2007), but this process has not been incorporated by most land surface models (Walker et al., 2015). Here we introduce a novel framework to induce the priming effect on soil decomposition and test its effect on plant production response to eCO2 within the quasi-equilibrium framework.
To account for the effect of priming on decomposition of SOM, we first introduce a coefficient to determine the fraction of root growth allocated to exudates, arhizo. Here we assumed that the N : C ratio of rhizodeposition is the same as the root N : C ratio. The coefficient arhizo is estimated by a function dependent on foliar N : C:
where nref is a reference foliar N : C ratio to induce plant N stress (0.04), and a0 and a1 are tuning coefficients (0.01 and 1, respectively). Within the quasi-equilibrium framework, for the VL soil constraint we now have
To introduce an effect of root exudation on the turnover rate of the slow SOM pool, rhizodeposition is transferred into the active SOM pool according to a microbial use efficiency parameter (). The extra allocation of NPP into the active SOM is therefore
The increased active SOM pool N demand is associated with the degradation rate of the slow SOM pool, expressed as
where kslow is the original decomposition rate of the slow SOM pool, and km is a sensitivity parameter. The decomposition rate of the slow SOM pool affects NRs, the amount of N released from the slow SOM pools, as
where Cs is the slow SOM pool, and Ωss and Ωps represent the proportion of C released through the decomposition of the slow and passive SOM pools that subsequently enters the slow SOM pool, respectively.

Figure 6Graphic interpretation of the priming effect on plant net primary production (a, b) and nitrogen use efficiency (c, d) response to CO2 fertilization under variable wood N : C ratio (a, c) and fixed wood N : C ratio assumptions (b, d). Constraint lines C400, C800, M, L, and VL refer to photosynthetic constraints at CO2=400 ppm, CO2=800 ppm, medium-term, long-term, and very-long-term nutrient recycling constraints, respectively. Point A is the quasi-equilibrium point at CO2=400 ppm, point B is the instantaneous response point at elevated CO2, and points C, D, and E are the M-, L-, and VL-term equilibrium points at elevated CO2.
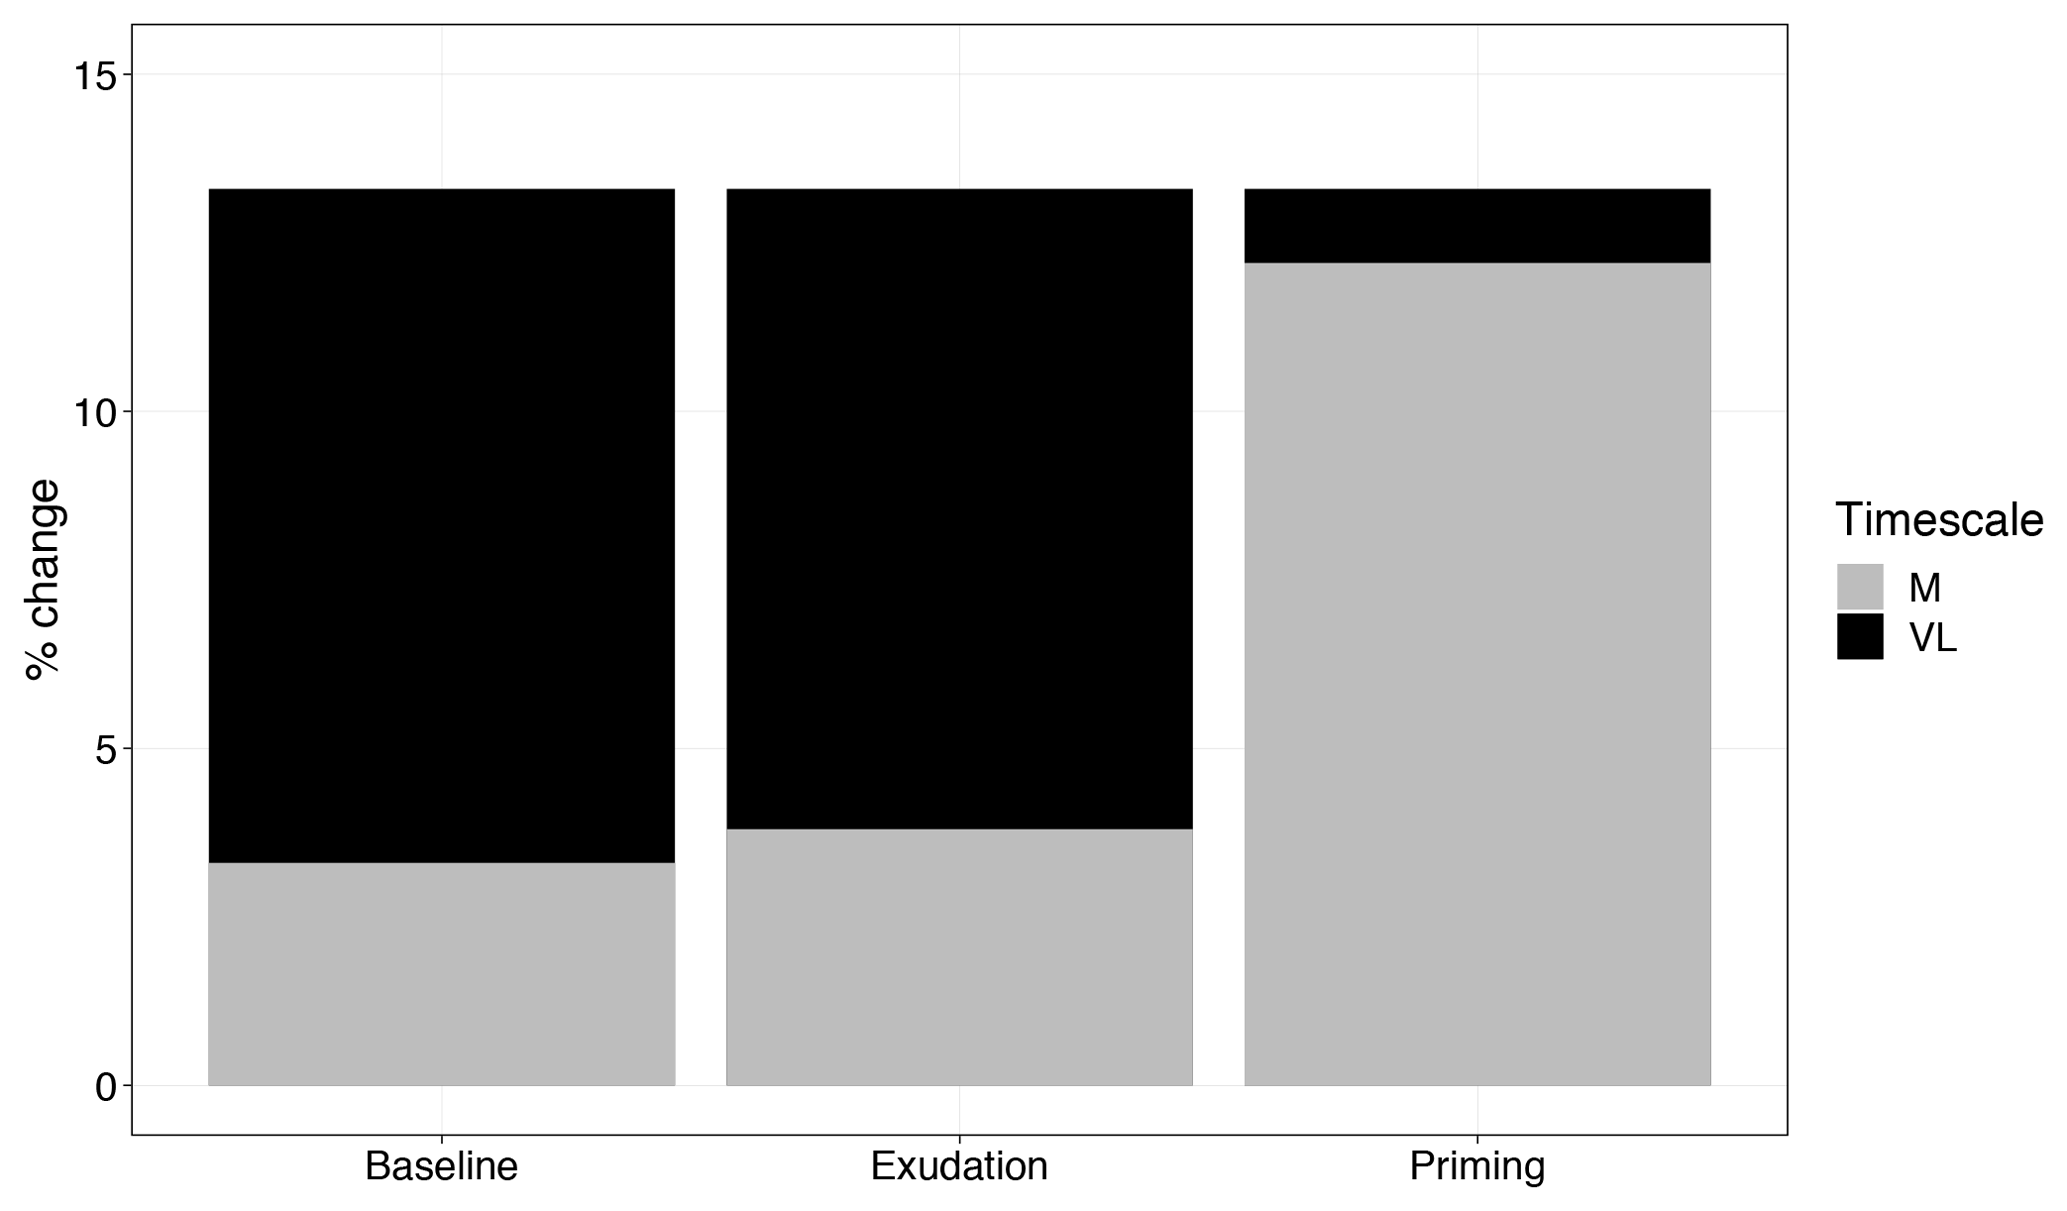
Figure 7Comparison of medium-term (M) and very-long-term (VL) net primary production response to elevated CO2 (percent change), with models incorporating no priming or exudation effect (baseline), only an exudation effect (exudation), and both an exudation and priming effect (priming).
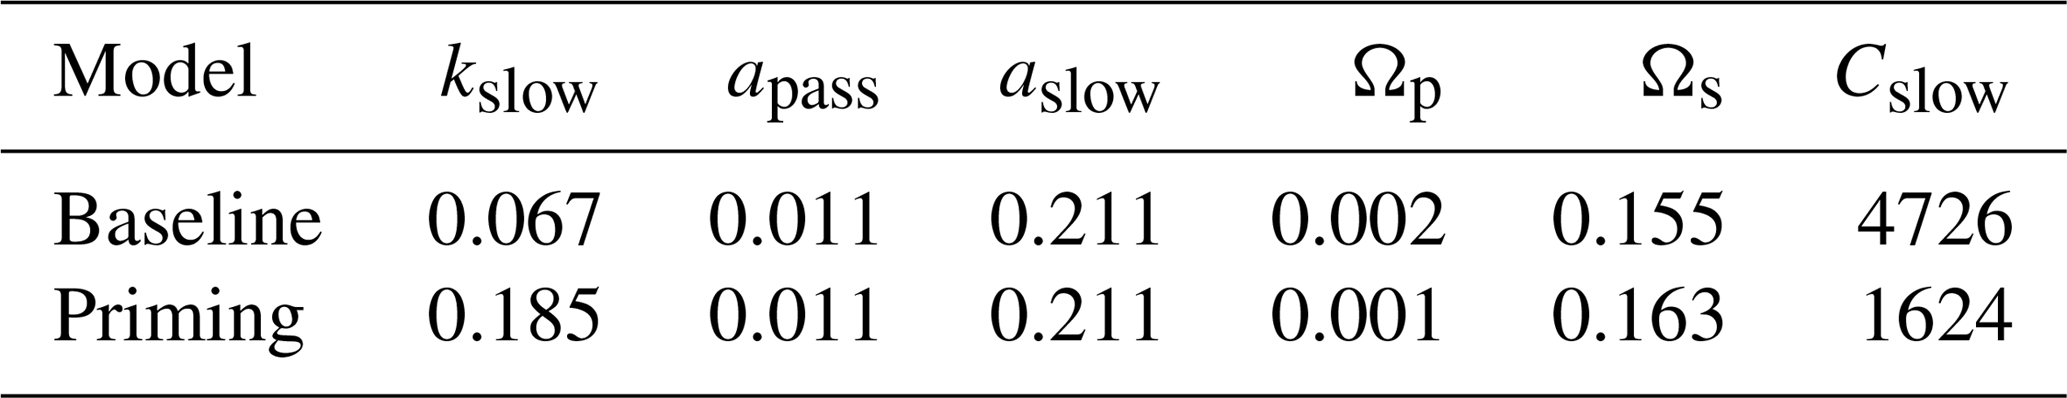
Root exudation and the associated priming effect result in a strong M-term plant response to eCO2 when compared to the baseline model (Fig. 6a in comparison to Fig. 4a). In fact, the magnitude of the priming effect on the M-term NPP response to eCO2 is comparable to its L- and VL-term NPP responses, indicating a persistent eCO2 effect over time (Table 3). A faster decomposition rate and therefore a smaller pool size of the slow SOM pool are observed (Table 5). With a fixed wood N : C ratio assumption, the NPP response to eCO2 is drastically reduced in the M term compared to the model with a variable wood N : C assumption (Fig. 6b), but it is comparable to its corresponding baseline fixed wood N : C model (Table 3). Varying parameter coefficients (a0, a1, fcue, rhizo, and km) affects the decomposition rates of the slow soil organic pool and hence could lead to variation of the priming effect on M-term CO2 response (Fig. S3). Further experimental studies are needed to better constrain these parameters. Adding root exudation without influencing the slow SOM pool decomposition rate (Eq. 21) leads to a smaller predicted M-term CO2 response than the model with the direct effect on the slow SOM pool. However, it also leads to a higher predicted M-term CO2 response than the baseline model (Fig. 7) because ar and nr affect the reburial fraction of the slow SOM pool, as shown in McMurtrie et al. (2000). Finally, the model with a variable wood N : C assumption indicates that there is no increase in NUE (Table 2) in the M term compared to its L- and VL-term responses (Fig. 6c). In comparison, the fixed wood N : C ratio assumption means that there is a decreased wood “quality” (reflected via a decreased N : C ratio), and therefore faster decomposition of the slow SOM pool does not release much extra N to support the M-term CO2 response, leading to a significant rise of NUE in the M term (Fig. 6d).
Table 5Effect of priming on key soil process coefficients. Coefficient kslow is the decomposition coefficient for the slow SOM pool (yr−1); apass is the reburial fraction of the passive SOM (i.e., the fraction of passive SOM reenters passive SOM); aslow is the reburial fraction of the slow SOM; Ωp is the burial coefficient for plant materials entering the passive SOM pool; Ωs is the burial coefficient for plant materials entering the slow SOM pool; and Cslow is the total carbon stock of the slow SOM pool (g C m−2). Both models assume a variable wood N : C ratio.
4.1 Influence of alternative N uptake assumptions on predicted CO2 fertilization
The quasi-equilibrium analysis of the time-varying plant response to eCO2 provides a quantitative framework to understand the relative contributions of different model assumptions governing the supply of N to plants in determining the magnitude of the CO2 fertilization effect. Here, we evaluated how plant responses to eCO2 are affected by widely used model assumptions relating to plant N uptake, soil decomposition, and immobilization demand under alternative wood N–C coupling strategies (variable and fixed wood N : C ratios). These assumptions have been adopted in land surface models such as O-CN (Zaehle and Friend, 2010), CABLE (Wang et al., 2007), LPJ-Guess N (Wårlind et al., 2014), JASBACH-CNP (Goll et al., 2012), ORCHIDEE-CNP (Goll et al., 2017a), and CLM4 (Thornton et al., 2007). In line with previous findings (Comins and McMurtrie, 1993; Dewar and McMurtrie, 1996; Kirschbaum et al., 1998; McMurtrie and Comins, 1996; Medlyn and Dewar, 1996), our results show that assumptions related to wood stoichiometry have a very large impact on estimates of plant responses to eCO2. More specifically, models incorporating a fixed wood N : C ratio consistently predicted smaller CO2 fertilization effects on production than models using a variable N : C ratio assumption (Table 3). Examples of models assuming constant (Thornton et al., 2007; Weng and Luo, 2008) and variable (Zaehle and Friend, 2010) plant tissue stoichiometry are both evident in the literature, and therefore, assuming that all other model structures and assumptions are similar, prediction differences could potentially be attributed to the tissue stoichiometric assumption incorporated into these models, as suggested in some previous simulation studies (Medlyn et al., 2016, 2015; Meyerholt and Zaehle, 2015; Zaehle et al., 2014). Together with a more appropriate representation of the trade-offs governing tissue C–N coupling (Medlyn et al., 2015), further tissue biochemistry data are necessary to constrain this fundamental aspect of ecosystem model uncertainty (Thomas et al., 2015).
C–N coupled simulation models generally predict that the CO2 fertilization effect on plant production is progressively constrained by soil N availability over time: the progressive nitrogen limitation hypothesis (Luo et al., 2004; Norby et al., 2010; Zaehle et al., 2014). Here we showed similar temporal patterns in a model with different plant N uptake assumptions (Fig. 4) and the potential NPP assumption (Fig. 5). In particular, the progressive N limitation effect on NPP is shown as a downregulated M-term CO2 response after the sharp instantaneous CO2 fertilization effect on production is realized. However, the model incorporating a priming effect of C on soil N availability with a flexible wood N : C ratio assumption induced a strong M-term CO2 response (13 % increase in NPP), thereby introducing a persistent CO2 effect over time (Fig. 6a). This strong M-term CO2 response is due to an enhanced decomposition rate of soil organic matter, consistent with a series of recent observations and modeling studies (Finzi et al., 2015; Guenet et al., 2018; Sulman et al., 2014; van Groenigen et al., 2014). However, as a previous quasi-equilibrium study showed, a significant increase in the M-term CO2 response can occur via changes in litter quality into the slow SOM pool or increased N input into the system (McMurtrie et al., 2000). Our study differs from McMurtrie et al. (2000) in that we introduced an explicit effect of C priming on kslow – the decomposition rate of the slow SOM pool – via extra rhizodeposition (Eq. 21). As such, a faster decomposition rate of slow SOM is observed (Table 5), equivalent to adding extra N for mineralization to support the M-term CO2 response (Fig. 6c). More complex models for N uptake, incorporating a carbon cost for nitrogen acquisition, are being proposed (Fisher et al., 2010; Ghimire et al., 2016; M. Shi et al., 2015); we suggest that the likely effects of introducing these complex sets of assumptions into large-scale models could usefully be explored with the quasi-equilibrium framework.
Processes regulating progressive nitrogen limitation under eCO2 were evaluated by Liang et al. (2016) based on a meta-analysis, which bridged the gap between theory and observations. It was shown that the expected diminished CO2 fertilization effect on plant growth was not apparent at the ecosystem scale due to extra N supply through increased biological N fixation and decreased leaching under eCO2. Here, our baseline assumption assumed fixed N input into the system, and therefore plant-available N is progressively depleted through increased plant N sequestration under eCO2, as depicted by the progressive N limitation hypothesis (Luo et al., 2004). A function that allows the N fixation parameter to vary could provide further assessment of the tightness of the ecosystem N cycle process and its impact on plant response to eCO2. Furthermore, given the significant role the wood N : C ratio plays in plant N sequestration, matching the modeled range of wood tissue stoichiometry with observations can provide an additional level of evaluation of model performance. Our study provides a generalizable evaluation based on the assumption that the wood N : C ratio, when allowed to vary in a model, is proportional to the leaf N : C ratio. Case-specific, more realistic evaluations can be performed based on the quasi-equilibrium framework to bridge models with observations.
A strong M term and persistent CO2 fertilization effects over time was also found by some models in Walker et al. (2015), but without introducing a priming effect. In models such as CLM, N losses from the system are concentration dependent, and plant N uptake is a function of both N supply and plant demand. Increased plant N demand in models in which N uptake is a function of plant N demand reduces the soil solution N concentration and therefore system N losses. This means that over time N can accumulate in the system in response to eCO2 and sustain an eCO2 response. Here, our quasi-equilibrium framework considers N lost as a fixed rate that depends linearly on the mineral N pool, and the mineral N pool changes at different equilibrium time points. For example, as shown in Table S1, the M-term N loss rate is significantly reduced under eCO2 compared to the VL-term N loss rate under aCO2. This suggests a positive relationship between N loss and NPP, as embedded in Eq. (4).
We also showed that the magnitude of the CO2 fertilization effect is significantly reduced at all timescales when models incorporate the potential NPP approach (Fig. 5). Among all model assumptions tested, the potential NPP approach induced the smallest M- to VL-term responses (Table 3). It can be shown from equation derivation (Eq. 17) that the fraction ) depends only on the N : C ratios and f (fraction of litter C become soil C), implying that models incorporating the potential NPP assumption should show no response of NPP to CO2. Both our study and simulation-based studies showed small CO2 responses (Walker et al., 2015; Zaehle et al., 2014), possibly because the timing of Pdem and Idem differs due to the fluctuating nature of GPP and N mineralization at daily to seasonal time steps such that N is limiting at certain times of the year but not at others. Additionally, models such as CLM have volatilization losses (not leaching) that are reduced under eCO2, which may lead to production not limited by N availability, meaning that a full CO2 fertilization effect may be realized. Finally, leaching is simplified here and treated as a fixed fraction of the mineral N pool. In models such as CLM or JASBACH, it is a function of the soil-soluble N concentration, implying a dependency on litter quality (Zaehle et al., 2014).
4.2 Implications for probing model behaviors
Model–data intercomparisons have been shown as a viable means to investigate how and why models differ in their predicted response to eCO2 (De Kauwe et al., 2014; Walker et al., 2015; Zaehle et al., 2014). Models make different predictions because they have different model structures (Lombardozzi et al., 2015; Meyerholt et al., 2016; Shi et al., 2018; Xia et al., 2013; Zhou et al., 2018), parameter uncertainties (Dietze et al., 2014; Wang et al., 2011), response mechanisms (Medlyn et al., 2015), and numerical implementations (Rogers et al., 2016). It is increasingly difficult to diagnose model behaviors from the multitude of model assumptions incorporated into the model. Furthermore, while it is true that the models can be tuned to match observations within the domain of calibration, models may make correct predictions but based on incorrect or simplified assumptions (Medlyn et al., 2005, 2015; Walker et al., 2015). As such, diagnosing model behaviors can be a challenging task in complex plant–soil models. In this study, we showed that the effect of a model assumption on plant response to eCO2 can be analytically predicted by solving the photosynthetic and nutrient recycling constraints together. This provides a constrained model framework to evaluate the effect of individual model assumptions without having to run a full set of sensitivity analyses, thereby providing an a priori understanding of the underlying response mechanisms through which the effect is realized. We suggest that before implementing a new function into the full structure of a plant–soil model, one could use the quasi-equilibrium framework as a test bed to examine the effect of the new assumption.
The quasi-equilibrium framework requires that additional model assumptions be analytically solvable, which is increasingly not the case for complex modeling structures. However, as we demonstrate here, studying the behavior of a reduced-complexity model can nonetheless provide real insight into model behavior. In some cases, the quasi-equilibrium framework can highlight where additional complexity is not valuable. For example, here we showed that adding complexity in the representation of plant N uptake did not result in significantly different predictions of plant response to eCO2. Where the quasi-equilibrium framework indicates little effect of more complex assumptions, there is a strong case for keeping simpler assumptions in the model. However, we do acknowledge that the quasi-equilibrium framework operates on timescales of >5 years; where fine-scale temporal responses are important, the additional complexity may be warranted.
The multiple-element limitation framework developed by Rastetter and Shaver (1992) analytically evaluates the relationship between short-term and long-term plant responses to eCO2 and nutrient availability under different model assumptions. It was shown that there could be a marked difference in the short-term and long-term ecosystem responses to eCO2 (Rastetter et al., 1997; Rastetter and Shaver, 1992). More specifically, Rastetter et al. (1997) showed that the ecosystem NPP response to eCO2 appeared on several characteristic timescales: (1) there was an instantaneous increase in NPP, which results in an increased vegetation C : N ratio; (2) on a timescale of a few years, the vegetation responded to eCO2 by increasing uptake effort for available N through increased allocation to fine roots; (3) on a timescale of decades, there was a net movement of N from soil organic matter to vegetation, which enables vegetation biomass to accumulate; and (4) on the timescale of centuries, ecosystem responses were dominated by increases in total ecosystem N, which enable organic matter to accumulate in both vegetation and soils. Both the multiple-element limitation framework and the quasi-equilibrium framework provide information about equilibrium responses. These approaches also provide information about the degree to which the ecosystem replies to internally recycled N vs. exchanges with external sources and sinks. The multiple-element limitation framework also offers insight into the C–N interaction that influences transient dynamics. These analytical frameworks are both useful tools for making quantitative assessments of model assumptions.
A related model assumption evaluation tool is the traceability framework, which decomposes complex models into various simplified component variables, such as ecosystem C storage capacity or residence time, and hence helps to identify structures and parameters that are uncertain among models (Z. Shi et al., 2015; Xia et al., 2013, 2012). Both the traceability and quasi-equilibrium frameworks provide analytical solutions to describe how and why model predictions diverge. The traceability framework decomposes complex simulations into a common set of component variables, explaining differences due to these variables. In contrast, quasi-equilibrium analysis investigates the impacts and behavior of a specific model assumption, which is more indicative of mechanisms and processes. Subsequently, one can relate the effect of a model assumption more mechanistically to the processes that govern the relationship between the plant N : C ratio and NPP, as depicted in Fig. 1, thereby facilitating efforts to reduce model uncertainties.
Models diverge in future projections of plant responses to increases in CO2 because of the different assumptions that they make. Applying model evaluation frameworks, such as the quasi-equilibrium framework, to attribute these differences will not necessarily reduce multi-model prediction spread in the short term (Lovenduski and Bonan, 2017). Many model assumptions are still empirically derived, and there is a lack of mechanistic and observational constraints on the effect size, meaning that it is important to apply models incorporating diverse process representations. However, use of the quasi-equilibrium framework can provide crucial insights into why model predictions differ and thus help identify the critical measurements that would allow us to discriminate among alternative models. As such, it is an invaluable tool for model intercomparison and benchmarking analysis. We recommend the use of this framework to analyze likely outcomes of new model assumptions before introducing them to complex model structures.
The code repository is publicly available via DOI https://doi.org/10.5281/zenodo.2574192 (Jiang et al., 2019).
Here we show how the baseline quasi-equilibrium framework is derived. Specifically, there are two analytical constraints that form the foundation of the quasi-equilibrium framework, namely the photosynthetic constraint and the nitrogen cycling constraint. The derivation follows Comins and McMurtrie (1993), which is further elaborated in work by McMurtrie et al. (2000) and Medlyn and Dewar (1996) and evaluated Comins (1994).
A1 Photosynthetic constraint
Firstly, gross primary production (GPP) in the simulation mode is calculated using a light-use efficiency approach named MATE (Model Any Terrestrial Ecosystem) (McMurtrie et al., 2008; Medlyn et al., 2011; Sands, 1995), in which absorbed photosynthetically active radiation is estimated from leaf area index (L) using Beer's law and is then multiplied by a light-use efficiency (LUE), which depends on the foliar N : C ratio (nf) and atmospheric CO2 concentration (Ca):
where I0 is the incident radiation, k is the canopy light extinction coefficient, and L is leaf area index. The derivation of LUE for the MATE is described in full by McMurtrie et al. (2008); our version differs only in that the key parameters determining the photosynthetic rate follow the empirical relationship with the foliar N : C ratio given by Walker et al. (2014), and the expression for stomatal conductance follows Medlyn et al. (2011).
In the quasi-equilibrium framework, the photosynthetic constraint is derived by assuming that the foliage C pool (Cf) has equilibrated. That is, the new foliage C production equals turnover, which is assumed to be a constant fraction (sf) of the pool:
where af is the allocation coefficient for foliage. From Eq. (A1), net primary production is a function of the foliar N : C ratio and the foliage C pool:
where σ is the specific leaf area. Combining the two equations above leads to an implicit relationship between NPP and nf,
which is the photosynthetic constraint.
A2 Nutrient recycling constraint
The nitrogen cycling constraint is derived by assuming that nitrogen inputs to and outputs from the equilibrated pools are equal. Based on the assumed residence times of the passive SOM (∼400 years), slow SOM (15 years), and woody biomass (50 years) pools, we can calculate the nutrient recycling constraint at three different timescales: very long (VL, >500 years, all pools equilibrated), long (L, 100–500 years, all pools equilibrated except the passive pool), or medium (M, 5–50 years, all pools equilibrated except slow, passive and wood pools).
In the VL term, we have
where Nin is the total N input into the system, and Nloss is the total N lost from the system via leaching and volatilization. Following Comins and McMurtrie (1993), the flux Nin is assumed to be a constant. The total N loss term is proportional to the rate of N mineralization (Nm), following
where ln is the fraction of N mineralization that is lost. It is assumed that mineralized N that is not lost is taken up by plants (NU):
Combining with Eq. (A6), we have
The plant N uptake rate depends on production (NPP) and plant N : C ratios, according to
where af, aw, and ar are the allocation coefficients for foliage, wood, and roots, respectively, and nfl, nw, and nr are the N : C ratios for foliage litter, wood, and roots, respectively. The foliage litter N : C ratio (nfl) is proportional to nf, according to Table 2. Combining Eq. (A9) with Eqs. (A5) and (A8), we obtain a function of NPP that can be related to total N input, which is the nutrient recycling constraint in the VL term, expressed as
Since nw and nr are assumed proportional to nf, the nutrient recycling constraint also links NPP and nf. The intersection with the photosynthetic constraint yields the very-long-term equilibria of both NPP and nf.
In the L term, we now have to consider N flows leaving and entering the passive SOM pool, which is no longer equilibrated:
where and are the release and sequestration of the passive SOM N pool, respectively. The release flux, , can be assumed to be constant on the L-term timescale. The sequestration flux, , can be calculated as a function of NPP. In G'DAY, as with most carbon–nitrogen coupled ecosystem models, carbon flows out of the soil pools are directly related to the pool size. As demonstrated by Comins and McMurtrie (1993), such soil models have the mathematical property of linearity, meaning that carbon flows out of the soil pools are proportional to the production input to the soil pool, or NPP. Furthermore, the litter input into the soil pools is assumed proportional to the foliar N : C ratio, with the consequence that N sequestered in the passive SOM is also related to the foliar N : C ratio. The sequestration flux into the passive soil pool () can thus be written as
where np is the N : C ratio of the passive SOM pool, and , , and are the burial coefficients for foliage, wood, and roots (the proportion of plant carbon production that is ultimately buried in the passive pool), respectively. The burial coefficients , , and depend on the N : C ratios of foliage, wood, and root litter (detailed derivation in Comins and McMurtrie, 1993). Combining and rearranging, we obtain the nutrient recycling constraint in the L term as
Similarly, in the M term, we have
where and are the N released from the slow SOM and wood pool, respectively, and and are the N stored in the slow SOM and wood pool, respectively (Medlyn et al., 2000). The nutrient recycling constraint in the M term can thus be derived as
where ns is the slow SOM pool N : C ratio, and and are foliage and root C sequestration rate into the slow SOM pool, respectively (Medlyn et al., 2000). The intersection between the nitrogen recycling constraint and the photosynthetic constraint provides an analytical solution to both NPP and nf at different timescales, and we can then interpret how changing model assumptions affect the predicted plant responses to elevated CO2.
The supplement related to this article is available online at: https://doi.org/10.5194/gmd-12-2069-2019-supplement.
BEM and MJ designed the study; MJ, BEM, and SZ performed the analyses; APW, MGDK, and SZ designed the priming effect equations; all authors contributed to results interpretation and paper writing.
The authors declare that they have no conflict of interest.
This paper builds heavily on ideas originally developed by Ross McMurtrie and Hugh Comins (now deceased). We would like to acknowledge their intellectual leadership and inspiration.
Sönke Zaehle and Silvia Caldararu were supported by the European Research Council (ERC) under the European Union's Horizon 2020 research and innovation program (QUINCY; grant no. 647204) and the German Academic Exchange Service (DAAD; project ID 57318796). David S. Ellsworth and Mingkai Jiang were also supported by the DAAD.
This paper was edited by David Lawrence and reviewed by two anonymous referees.
Bonan, G. B. and Levis, S.: Quantifying carbon-nitrogen feedbacks in the Community Land Model (CLM4), Geophys. Res. Lett., 37, L07401, https://doi.org/10.1029/2010GL042430, 2010.
Comins, H. N.: Equilibrium Analysis of Integrated Plant – Soil Models for Prediction of the Nutrient Limited Growth Response to CO2 Enrichment, J. Theor. Biol., 171, 369–385, 1994.
Comins, H. N. and McMurtrie, R. E.: Long-term response of nutrient-limited forests to CO2 enrichment; equilibrium behavior of plant-soil models, Ecol. Appl., 3, 666–681, 1993.
Corbeels, M., McMurtrie, R. E., Pepper, D. A., and O'Connell, A. M.: A process-based model of nitrogen cycling in forest plantations: Part I. Structure, calibration and analysis of the decomposition model, Ecol. Model., 187, 426–448, 2005.
De Kauwe, M. G., Medlyn, B. E., Zaehle, S., Walker, A. P., Dietze, M. C., Wang, Y.-P., Luo, Y., Jain, A. K., El-Masri, B., Hickler, T., Wårlind, D., Weng, E., Parton, W. J., Thornton, P. E., Wang, S., Prentice, I. C., Asao, S., Smith, B., McCarthy, H. R., Iversen, C. M., Hanson, P. J., Warren, J. M., Oren, R., and Norby, R. J.: Where does the carbon go? A model–data intercomparison of vegetation carbon allocation and turnover processes at two temperate forest free-air CO2 enrichment sites, New Phytol., 203, 883–899, 2014.
Dewar, R. C. and McMurtrie, R. E.: Analytical model of stemwood growth in relation to nitrogen supply, Tree Physiol., 16, 161–171, 1996.
Dietze, M. C., Serbin, S. P., Davidson, C., Desai, A. R., Feng, X., Kelly, R., Kooper, R., LeBauer, D., Mantooth, J., McHenry, K., and Wang, D.: A quantitative assessment of a terrestrial biosphere model's data needs across North American biomes, J. Geophys. Res.-Biogeo., 119, 286–300, 2014.
Dijkstra, F. A. and Cheng, W.: Interactions between soil and tree roots accelerate long-term soil carbon decomposition, Ecol. Lett., 10, 1046–1053, 2007.
Dybzinski, R., Farrior, C. E., and Pacala, S. W.: Increased forest carbon storage with increased atmospheric CO2 despite nitrogen limitation: a game-theoretic allocation model for trees in competition for nitrogen and light, Glob. Change Biol., 21, 1182–1196, 2014.
Fernández-Martínez, M., Vicca, S., Janssens, I. A., Sardans, J., Luyssaert, S., Campioli, M., Chapin Iii, F. S., Ciais, P., Malhi, Y., Obersteiner, M., Papale, D., Piao, S. L., Reichstein, M., Rodà, F., and Peñuelas, J.: Nutrient availability as the key regulator of global forest carbon balance, Nat. Clim. Change, 4, 471–476, https://doi.org/10.1038/NCLIMATE2177, 2014.
Finzi, A. C., Abramoff, R. Z., Spiller, K. S., Brzostek, E. R., Darby, B. A., Kramer, M. A., and Phillips, R. P.: Rhizosphere processes are quantitatively important components of terrestrial carbon and nutrient cycles, Glob. Change Biol., 21, 2082–2094, 2015.
Fisher, J. B., Sitch, S., Malhi, Y., Fisher, R. A., Huntingford, C., and Tan, S. Y.: Carbon cost of plant nitrogen acquisition: A mechanistic, globally applicable model of plant nitrogen uptake, retranslocation, and fixation, Global Biogeochem. Cy., 24, GB1014, https://doi.org/10.1029/2009GB003621, 2010.
Friend, A. D., Lucht, W., Rademacher, T. T., Keribin, R., Betts, R., Cadule, P., Ciais, P., Clark, D. B., Dankers, R., Falloon, P. D., Ito, A., Kahana, R., Kleidon, A., Lomas, M. R., Nishina, K., Ostberg, S., Pavlick, R., Peylin, P., Schaphoff, S., Vuichard, N., Warszawski, L., Wiltshire, A., and Woodward, F. I.: Carbon residence time dominates uncertainty in terrestrial vegetation responses to future climate and atmospheric CO2, P. Natl. Acad. Sci. USA, 111, 3280–3285, 2014.
Gerber, S., Hedin Lars, O., Oppenheimer, M., Pacala Stephen, W., and Shevliakova, E.: Nitrogen cycling and feedbacks in a global dynamic land model, Global Biogeochem. Cy., 24, GB1001, https://doi.org/10.1029/2008GB003336, 2010.
Ghimire, B., Riley William, J., Koven Charles, D., Mu, M., and Randerson James, T.: Representing leaf and root physiological traits in CLM improves global carbon and nitrogen cycling predictions, J. Adv. Model. Earth Syst., 8, 598–613, 2016.
Goll, D. S., Brovkin, V., Parida, B. R., Reick, C. H., Kattge, J., Reich, P. B., van Bodegom, P. M., and Niinemets, Ü.: Nutrient limitation reduces land carbon uptake in simulations with a model of combined carbon, nitrogen and phosphorus cycling, Biogeosciences, 9, 3547–3569, https://doi.org/10.5194/bg-9-3547-2012, 2012.
Goll, D. S., Vuichard, N., Maignan, F., Jornet-Puig, A., Sardans, J., Violette, A., Peng, S., Sun, Y., Kvakic, M., Guimberteau, M., Guenet, B., Zaehle, S., Penuelas, J., Janssens, I., and Ciais, P.: A representation of the phosphorus cycle for ORCHIDEE (revision 4520), Geosci. Model Dev., 10, 3745–3770, https://doi.org/10.5194/gmd-10-3745-2017, 2017a.
Goll, D. S., Winkler, A. J., Raddatz, T., Dong, N., Prentice, I. C., Ciais, P., and Brovkin, V.: Carbon–nitrogen interactions in idealized simulations with JSBACH (version 3.10), Geosci. Model Dev., 10, 2009–2030, https://doi.org/10.5194/gmd-10-2009-2017, 2017b.
Guenet, B., Moyano, F. E., Peylin, P., Ciais, P., and Janssens, I. A.: Towards a representation of priming on soil carbon decomposition in the global land biosphere model ORCHIDEE (version 1.9.5.2), Geosci. Model Dev., 9, 841–855, https://doi.org/10.5194/gmd-9-841-2016, 2016.
Guenet, B., Camino-Serrano, M., Ciais, P., Tifafi, M., Maignan, F., Soong Jennifer, L., and Janssens Ivan, A.: Impact of priming on global soil carbon stocks, Glob. Change Biol., 24, 1873–1883, 2018.
Huntzinger, D. N., Michalak, A. M., Schwalm, C., Ciais, P., King, A. W., Fang, Y., Schaefer, K., Wei, Y., Cook, R. B., Fisher, J. B., Hayes, D., Huang, M., Ito, A., Jain, A. K., Lei, H., Lu, C., Maignan, F., Mao, J., Parazoo, N., Peng, S., Poulter, B., Ricciuto, D., Shi, X., Tian, H., Wang, W., Zeng, N., and Zhao, F.: Uncertainty in the response of terrestrial carbon sink to environmental drivers undermines carbon-climate feedback predictions, Sci. Rep., 7, 4765, https://doi.org/10.1038/s41598-017-03818-2, 2017.
Jiang, M., Zaehle, S., De Kauwe, M. G., Walker, A. P., Caldararu, S., Ellsworth, D. S., and Medlyn, B. E.: The quasi-equilibrium framework analytical platform, Zenodo, https://doi.org/10.5281/zenodo.2574192, 2019.
Kirschbaum, M. U. F., King, D. A., Comins, H. N., McMurtrie, R. E., Medlyn, B. E., Pongracic, S., Murty, D., Keith, H., Raison, R. J., Khanna, P. K., and Sheriff, D. W.: Modeling forest response to increasing CO2 concentration under nutrient-limited conditions, Plant Cell Environ., 17, 1081–1099, 1994.
Kirschbaum, M. U. F., Medlyn, B. E., King, D. A., Pongracic, S., Murty, D., Keith, H., Khanna, P. K., Snowdon, P., and Raison, R. J.: Modelling forest-growth response to increasing CO2 concentration in relation to various factors affecting nutrient supply, Glob. Change Biol., 4, 23–41, 1998.
Koven, C. D., Chambers, J. Q., Georgiou, K., Knox, R., Negron-Juarez, R., Riley, W. J., Arora, V. K., Brovkin, V., Friedlingstein, P., and Jones, C. D.: Controls on terrestrial carbon feedbacks by productivity versus turnover in the CMIP5 Earth System Models, Biogeosciences, 12, 5211–5228, https://doi.org/10.5194/bg-12-5211-2015, 2015.
Kowalczyk, E. A., Wang, Y. P., Law, R. M., Davies, H. L., McGregor, J. L., and Abramowitz, G.: The CSIRO Atmosphere Biosphere Land Exchange (CABLE) model for use in climate models and as an offline model, CSIRO, Australia, 2006.
Liang, J., Qi, X., Souza, L., and Luo, Y.: Processes regulating progressive nitrogen limitation under elevated carbon dioxide: a meta-analysis, Biogeosciences, 13, 2689–2699, https://doi.org/10.5194/bg-13-2689-2016, 2016.
Lombardozzi, D. L., Bonan, G. B., Smith, N. G., Dukes, J. S., and Fisher, R. A.: Temperature acclimation of photosynthesis and respiration: A key uncertainty in the carbon cycle-climate feedback, Geophys. Res. Lett., 42, 8624–8631, 2015.
Lovenduski, N. S. and Bonan, G. B.: Reducing uncertainty in projections of terrestrial carbon uptake, Environ. Res. Lett., 12, 044020, https://doi.org/10.1088/1748-9326/aa66b8, 2017.
Ludwig, D., Jones, D. D., and Holling, C. S.: Qualitative Analysis of Insect Outbreak Systems: The Spruce Budworm and Forest, J. Anim. Ecol., 47, 315–332, 1978.
Luo, Y., Su, B., Currie, W. S., Dukes, J. S., Finzi, A., Hartwig, U., Hungate, B., McMurtrie, R. E., Oren, R., Parton, W. J., Pataki, D. E., Shaw, R. M., Zak, D. R., and Field, C. B.: Progressive Nitrogen Limitation of Ecosystem Responses to Rising Atmospheric Carbon Dioxide, BioScience, 54, 731–739, 2004.
McMurtrie, R. and Comins, H. N.: The temporal response of forest ecosystems to doubled atmospheric CO2 concentration, Glob. Change Biol., 2, 49–57, 1996.
McMurtrie, R. E., Dewar, R. C., Medlyn, B. E., and Jeffreys, M. P.: Effects of elevated [CO2] on forest growth and carbon storage: a modelling analysis of the consequences of changes in litter quality/quantity and root exudation, Plant Soil, 224, 135–152, 2000.
McMurtrie, R. E., Medlyn, B. E., and Dewar, R. C.: Increased understanding of nutrient immobilization in soil organic matter is critical for predicting the carbon sink strength of forest ecosystems over the next 100 years, Tree Physiol., 21, 831–839, 2001.
McMurtrie, R. E., Norby, R. J., Medlyn, B. E., Dewar, R. C., Pepper, D. A., Reich, P. B., and Barton, C. V. M.: Why is plant-growth response to elevated CO2 amplified when water is limiting, but reduced when nitrogen is limiting? A growth-optimisation hypothesis, Funct. Plant Biol., 35, 521–534, 2008.
McMurtrie, R. E., Iversen, C. M., Dewar, R. C., Medlyn, B. E., Näsholm, T., Pepper, D. A., and Norby, R. J.: Plant root distributions and nitrogen uptake predicted by a hypothesis of optimal root foraging, Ecol. Evol., 2, 1235–1250, 2012.
Medlyn, B. E. and Dewar, R. C.: A model of the long-term response of carbon allocation and productivity of forests to increased CO2 concentration and nitrogen deposition, Glob. Change Biol., 2, 367–376, 1996.
Medlyn, B. E., McMurtrie, R. E., Dewar, R. C., and Jeffreys, M. P.: Soil processes dominate the long-term response of forest net primary productivity to increased temperature and atmospheric CO2 concentration, Can. J. For. Res., 30, 873–888, 2000.
Medlyn, B. E., Robinson, A. P., Clement, R., and McMurtrie, R. E.: On the validation of models of forest CO2 exchange using eddy covariance data: some perils and pitfalls, Tree Physiol., 25, 839–857, 2005.
Medlyn, B. E., Duursma, R. A., Eamus, D., Ellsworth, D. S., Prentice, I. C., Barton, C. V. M., Crous, K. Y., De Angelis, P., Freeman, M., and Wingate, L.: Reconciling the optimal and empirical approaches to modelling stomatal conductance, Glob. Change Biol., 17, 2134–2144, 2011.
Medlyn, B. E., Zaehle, S., De Kauwe, M. G., Walker, A. P., Dietze, M. C., Hanson, P. J., Hickler, T., Jain, A. K., Luo, Y., Parton, W., Prentice, I. C., Thornton, P. E., Wang, S., Wang, Y.-P., Weng, E., Iversen, C. M., McCarthy, H. R., Warren, J. M., Oren, R., and Norby, R. J.: Using ecosystem experiments to improve vegetation models, Nat. Clim. Change, 5, 528–534, 2015.
Medlyn, B. E., De Kauwe Martin, G., Zaehle, S., Walker Anthony, P., Duursma Remko, A., Luus, K., Mishurov, M., Pak, B., Smith, B., Wang, Y. P., Yang, X., Crous Kristine, Y., Drake John, E., Gimeno Teresa, E., Macdonald Catriona, A., Norby Richard, J., Power Sally, A., Tjoelker Mark, G., and Ellsworth David, S.: Using models to guide field experiments: a priori predictions for the CO2 response of a nutrient- and water-limited native Eucalypt woodland, Glob. Change Biol., 22, 2834–2851, 2016.
Meyerholt, J. and Zaehle, S.: The role of stoichiometric flexibility in modelling forest ecosystem responses to nitrogen fertilization, New Phytol., 208, 1042–1055, 2015.
Meyerholt, J., Zaehle, S., and Smith, M. J.: Variability of projected terrestrial biosphere responses to elevated levels of atmospheric CO2 due to uncertainty in biological nitrogen fixation, Biogeosciences, 13, 1491–1518, https://doi.org/10.5194/bg-13-1491-2016, 2016.
Norby, R. J., Warren, J. M., Iversen, C. M., Medlyn, B. E., and McMurtrie, R. E.: CO2 enhancement of forest productivity constrained by limited nitrogen availability, P. Natl. Acad. Sci. USA, 107, 19368–19373, 2010.
Oleson, K. W., Dai, Y. J., Bonan, G. B., Bosilovich, M., Dichinson, R., Dirmeyer, P., Hoffman, F., Houser, P., Levis, S., Niu, G.-Y., Thornton, P. E., Vertenstein, M., Yang, Z. L., and Zeng, X.: Technical description of the Community Land Model (CLM), National Center for Atmospheric Research, Boulder, Colorado, USA, 2004.
Rastetter, E. B. and Shaver, G. R.: A Model of Multiple-Element Limitation for Acclimating Vegetation, Ecology, 73, 1157–1174, 1992.
Rastetter, E. B., Ågren, G. I., and Shaver, G. R.: Responses Of N-Limited Ecosystems To Increased CO2: A Balanced-Nutrition, Coupled-Element-Cycles Model, Ecol. Appl., 7, 444–460, 1997.
Reich, P. B. and Hobbie, S. E.: Decade-long soil nitrogen constraint on the CO2 fertilization of plant biomass, Nat. Clim. Change, 3, 278–282, https://doi.org/10.1038/NCLIMATE1694, 2012.
Rogers, A., Medlyn Belinda, E., Dukes Jeffrey, S., Bonan, G., Caemmerer, S., Dietze Michael, C., Kattge, J., Leakey Andrew, D. B., Mercado Lina, M., Niinemets, Ü., Prentice, I. C., Serbin Shawn, P., Sitch, S., Way Danielle, A., and Zaehle, S.: A roadmap for improving the representation of photosynthesis in Earth system models, New Phytol., 213, 22–42, 2016.
Sands, P.: Modelling Canopy Production. II. From Single-Leaf Photosynthesis Parameters to Daily Canopy Photosynthesis, Funct. Plant Biol., 22, 603–614, 1995.
Shi, M., Fisher, J. B., Brzostek, E. R., and Phillips, R. P.: Carbon cost of plant nitrogen acquisition: global carbon cycle impact from an improved plant nitrogen cycle in the Community Land Model, Glob. Change Biol., 22, 1299–1314, 2015.
Shi, Z., Xu, X., Hararuk, O., Jiang, L., Xia, J., Liang, J., Li, D., and Luo, Y.: Experimental warming altered rates of carbon processes, allocation, and carbon storage in a tallgrass prairie, Ecosphere, 6, 1–16, 2015.
Shi, Z., Crowell, S., Luo, Y., and Moore, B.: Model structures amplify uncertainty in predicted soil carbon responses to climate change, Nat. Communi., 9, 2171, https://doi.org/10.1038/s41467-018-04526-9, 2018.
Sigurdsson, B. D., Medhurst, J. L., Wallin, G., Eggertsson, O., and Linder, S.: Growth of mature boreal Norway spruce was not affected by elevated [CO2] and/or air temperature unless nutrient availability was improved, Tree Physiol., 33, 1192–1205, 2013.
Smith, B., Prentice, I. C., and Sykes, M. T.: Representation of vegetation dynamics in the modelling of terrestrial ecosystems: comparing two contrasting approaches within European climate space, Global Ecol. Biogeogr., 10, 621–637, 2001.
Sokolov, A. P., Kicklighter, D. W., Melillo, J. M., Felzer, B. S., Schlosser, C. A., and Cronin, T. W.: Consequences of Considering Carbon–Nitrogen Interactions on the Feedbacks between Climate and the Terrestrial Carbon Cycle, J. Climate, 21, 3776–3796, 2008.
Stocker, B. D., Prentice, I. C., Cornell, S. E., Davies-Barnard, T., Finzi, A. C., Franklin, O., Janssens, I., Larmola, T., Manzoni, S., Näsholm, T., Raven, J. A., Rebel, K. T., Reed, S., Vicca, S., Wiltshire, A., and Zaehle, S.: Terrestrial nitrogen cycling in Earth system models revisited, New Phytol., 210, 1165–1168, 2016.
Sulman, B. N., Phillips, R. P., Oishi, A. C., Shevliakova, E., and Pacala, S. W.: Microbe-driven turnover offsets mineral-mediated storage of soil carbon under elevated CO2, Nat. Clim. Change, 4, 1099, https://doi.org/10.1038/NCLIMATE2436, 2014.
Thomas, R. Q., Brookshire, E. N. J., and Gerber, S.: Nitrogen limitation on land: how can it occur in Earth system models?, Glob. Change Biol., 21, 1777–1793, 2015.
Thornton, P. E., Lamarque, J. F., Rosenbloom Nan, A., and Mahowald, N. M.: Influence of carbon-nitrogen cycle coupling on land model response to CO2 fertilization and climate variability, Global Biogeochem. Cy., 21, GB4018, https://doi.org/10.1029/2006GB002868, 2007.
Thornton, P. E., Doney, S. C., Lindsay, K., Moore, J. K., Mahowald, N., Randerson, J. T., Fung, I., Lamarque, J.-F., Feddema, J. J., and Lee, Y.-H.: Carbon-nitrogen interactions regulate climate-carbon cycle feedbacks: results from an atmosphere-ocean general circulation model, Biogeosciences, 6, 2099–2120, https://doi.org/10.5194/bg-6-2099-2009, 2009.
van Groenigen, K. J., Qi, X., Osenberg, C. W., Luo, Y., and Hungate, B. A.: Faster Decomposition Under Increased Atmospheric CO2 Limits Soil Carbon Storage, Science, 344, 508–509, https://doi.org/10.1126/science.1249534, 2014.
Walker, A. P., Hanson, P. J., De Kauwe, M. G., Medlyn, B. E., Zaehle, S., Asao, S., Dietze, M., Hickler, T., Huntingford, C., Iversen, C. M., Jain, A., Lomas, M., Luo, Y. Q., McCarthy, H., Parton, W. J., Prentice, I. C., Thornton, P. E., Wang, S. S., Wang, Y. P., Warlind, D., Weng, E. S., Warren, J. M., Woodward, F. I., Oren, R., and Norby, R. J.: Comprehensive ecosystem model-data synthesis using multiple data sets at two temperate forest free-air CO2 enrichment experiments: Model performance at ambient CO2 concentration, J. Geophys. Res.-Biogeo., 119, 937–964, 2014.
Walker, A. P., Zaehle, S., Medlyn, B. E., De Kauwe, M. G., Asao, S., Hickler, T., Parton, W., Ricciuto, D. M., Wang, Y.-P., Wårlind, D., and Norby, R. J.: Predicting long-term carbon sequestration in response to CO2 enrichment: How and why do current ecosystem models differ?, Global Biogeochem. Cy., 29, 476–495, 2015.
Wang, Y. P., Houlton, B. Z., and Field, C. B.: A model of biogeochemical cycles of carbon, nitrogen, and phosphorus including symbiotic nitrogen fixation and phosphatase production, Global Biogeochem. Cy., 21, GB1018, https://doi.org/10.1029/2006GB002797, 2007.
Wang, Y. P., Kowalczyk, E., Leuning, R., Abramowitz, G., Raupach, M. R., Pak, B., van Gorsel, E., and Luhar, A.: Diagnosing errors in a land surface model (CABLE) in the time and frequency domains, J. Geophys. Res.-Biogeo., 116, G01034, https://doi.org/10.1029/2010JG001385, 2011.
Wårlind, D., Smith, B., Hickler, T., and Arneth, A.: Nitrogen feedbacks increase future terrestrial ecosystem carbon uptake in an individual-based dynamic vegetation model, Biogeosciences, 11, 6131–6146, https://doi.org/10.5194/bg-11-6131-2014, 2014.
Weng, E. and Luo, Y.: Soil hydrological properties regulate grassland ecosystem responses to multifactor global change: A modeling analysis, J. Geophys. Res.-Biogeo., 113, G03003, https://doi.org/10.1029/2007JG000539, 2008.
Xia, J. Y., Luo, Y. Q., Wang, Y.-P., Weng, E. S., and Hararuk, O.: A semi-analytical solution to accelerate spin-up of a coupled carbon and nitrogen land model to steady state, Geosci. Model Dev., 5, 1259–1271, https://doi.org/10.5194/gmd-5-1259-2012, 2012.
Xia, J. Y., Luo, Y., Wang, Y.-P., and Hararuk, O.: Traceable components of terrestrial carbon storage capacity in biogeochemical models, Glob. Change Biol., 19, 2104–2116, 2013.
Yang, X., Wittig, V., Jain, A. K., and Post, W.: Integration of nitrogen cycle dynamics into the Integrated Science Assessment Model for the study of terrestrial ecosystem responses to global change, Global Biogeochem. Cy., 23, GB4029, https://doi.org/10.1029/2009GB003474, 2009.
Zaehle, S. and Friend, A. D.: Carbon and nitrogen cycle dynamics in the O-CN land surface model: 1. Model description, site-scale evaluation, and sensitivity to parameter estimates, Global Biogeochem. Cy., 24, GB1005, https://doi.org/10.1029/2009GB003521, 2010.
Zaehle, S., Friend, A. D., Friedlingstein, P., Dentener, F., Peylin, P., and Schulz, M.: Carbon and nitrogen cycle dynamics in the O-CN land surface model: 2. Role of the nitrogen cycle in the historical terrestrial carbon balance, Global Biogeochem. Cy., 24, GB1006, https://doi.org/10.1029/2009GB003522, 2010.
Zaehle, S., Medlyn, B. E., De Kauwe, M. G., Walker, A. P., Dietze, M. C., Hickler, T., Luo, Y. Q., Wang, Y. P., El-Masri, B., Thornton, P., Jain, A., Wang, S. S., Warlind, D., Weng, E. S., Parton, W., Iversen, C. M., Gallet-Budynek, A., McCarthy, H., Finzi, A. C., Hanson, P. J., Prentice, I. C., Oren, R., and Norby, R. J.: Evaluation of 11 terrestrial carbon-nitrogen cycle models against observations from two temperate Free-Air CO2 Enrichment studies, New Phytol., 202, 803–822, 2014.
Zaehle, S., Jones, C. D., Houlton, B., Lamarque, J.-F., and Robertson, E.: Nitrogen Availability Reduces CMIP5 Projections of Twenty-First-Century Land Carbon Uptake, J. Climate, 28, 2494–2511, 2015.
Zhou, S., Liang, J., Lu, X., Li, Q., Jiang, L., Zhang, Y., Schwalm, C. R., Fisher, J. B., Tjiputra, J., Sitch, S., Ahlström, A., Huntzinger, D. N., Huang, Y., Wang, G., and Luo, Y.: Sources of Uncertainty in Modeled Land Carbon Storage within and across Three MIPs: Diagnosis with Three New Techniques, J. Climate, 31, 2833–2851, 2018.