the Creative Commons Attribution 4.0 License.
the Creative Commons Attribution 4.0 License.
 | 08 Jul 2019
The AROME-WMED reanalyses of the first special observation period of the Hydrological cycle in the Mediterranean experiment (HyMeX)
Mathieu Nuret
Pierre Brousseau
Olivier Caumont
Alexis Doerenbecher
Eric Wattrelot
Patrick Moll
Hervé Bénichou
Dominique Puech
Olivier Bock
Pierre Bosser
Patrick Chazette
Cyrille Flamant
Paolo Di Girolamo
Evelyne Richard
Frédérique Saïd
To study key processes of the water cycle, two special observation periods (SOPs) of the Hydrological cycle in the Mediterranean experiment (HyMeX) took place during autumn 2012 and winter 2013. The first SOP aimed to study high precipitation systems and flash flooding in the Mediterranean area. The AROME-WMED (western Mediterranean) model (Fourrié et al., 2015) is a dedicated version of the mesoscale Numerical Weather Prediction (NWP) AROME-France model, which covers the western Mediterranean basin providing the HyMeX operational center with daily real-time analyses and forecasts. These products allowed for adequate decision-making for the field campaign observation deployment and the instrument operation. Shortly after the end of the campaign, a first reanalysis with more observations was performed with the first SOP operational software. An ensuing comprehensive second reanalysis of the first SOP, which included field research observations (not assimilated in real time) and some reprocessed observation datasets, was made with AROME-WMED. Moreover, a more recent version of the AROME model was used with updated background error statistics for the assimilation process.
This paper depicts the main differences between the real-time version and the benefits brought by HyMeX reanalyses with AROME-WMED. The first reanalysis used 9 % additional data and the second one 24 % more compared to the real-time version. The second reanalysis is found to be closer to observations than the previous AROME-WMED analyses. The second reanalysis forecast errors of surface parameters are reduced up to the 18 and 24 h forecast range. In the middle and upper troposphere, fields are also improved up to the 48 h forecast range when compared to radiosondes. Integrated water vapor comparisons indicate a positive benefit for at least 24 h. Precipitation forecasts are found to be improved with the second reanalysis for a threshold up to 10 mm (24 h)−1. For higher thresholds, the frequency bias is degraded. Finally, improvement brought by the second reanalysis is illustrated with the Intensive Observation Period (IOP8) associated with heavy precipitation over eastern Spain and southern France.


The HYdrological cycle in the Mediterranean EXperiment (HyMeX; Drobinski et al., 2014) is a 10-year scientific program aiming at a better understanding and quantification of the hydrological cycle and related processes in the Mediterranean region. Emphasis is on high-impact weather events, interannual to decennial variability of the Mediterranean coupled system, and associated trends in the context of global climate change. The first special observing period took place in autumn 2012 (5 September to 6 November 2012) to study heavy precipitation and flash flooding events (Ducrocq et al., 2014).
An AROME (Application of Research to Operations at Mesoscale; Seity et al., 2011) model version dedicated to the HyMeX program, the AROME-WMED (western Mediterranean) model (Fourrié et al., 2015) centered over the western Mediterranean basin, was developed in 2009 to study heavy precipitation in this region. Several studies have indeed shown the importance of an accurate description of the low-level moist flow feeding mesoscale convective systems, which can result in heavy precipitation events (Duffourg and Ducrocq, 2011; Bresson et al., 2012; Ricard et al., 2012). During the HyMeX special observation periods, a real-time version of the AROME-WMED model (Fourrié et al., 2015) with data assimilation, hereafter called SOP1, was run to provide scientists with analyses and forecasts of meteorological situations. These forecast fields were also used to drive ocean and hydrological models and provide guidance for observation deployment planning and safety management of the observation platforms and the instruments.
During the campaign, innovative observations came from boundary layer pressurized balloons (BLPBs) (Doerenbecher et al., 2016) developed by CNES (Centre National d'Etudes Spatiales) and airborne in situ and remote sensing observations from the French SAFIRE Falcon 20 and ATR-42 and the German Dornier aircraft. Radiosondes were also launched from mobile platforms along the French and Italian Mediterranean coasts and in Corsica depending on meteorological situations. Moreover, additional operational radiosondes were activated on request at 06:00 and 18:00 UTC through the Data Targeting System (DTS) implemented by the ECMWF (European Centre for Medium-Range Weather Forecasts; Prates et al., 2009) within the EUMETNET Observation Programme.
In the past, several reanalyses were performed after experimental campaigns such as for the Fronts and Atlantic Storm-Track EXperiment (FASTEX; Desroziers et al., 2003) and the Mesoscale Alpine Programme (MAP; Keil and Cardinali, 2004) with a view to providing a new reference description for process studies. In the framework of the Innovative Observing and Data Assimilation Systems for severe weather events in the Mediterranean project, it was decided to perform reanalyses of the HyMeX special observation period to benefit from additional research observations, as well as from advances in assimilation algorithms and modeling.
Shortly after the HyMeX campaign, a first reanalysis (REANA1), which did not include any new data processing, was performed to provide scientists with a unified dataset for process studies. The real-time AROME-WMED version was indeed upgraded during the field campaign on 25 September 2012 at 06:00 UTC. More recently, a second reanalysis of the HyMeX special observation period (REANA2) was undertaken to take advantage of observations deployed during the field campaign not included in SOP1 or REANA1, as well as enhanced reprocessed datasets. REANA2 also benefited from the latest model updates.
The aim of this paper is to review the main characteristics of the AROME-WMED reanalysis versions in terms of data assimilation and forecast and to compare them with their real-time counterpart. The outline of the paper is as follows. Section 2 compares both configurations of the AROME-WMED reanalysis and the real-time versions. The different datasets assimilated in the reanalyses are specified in Sect. 3. Section 4 evaluates the assimilation and forecast with respect to various observations. The qualitative and quantitative precipitation evaluation of the three AROME-WMED versions for the Intensive Observation Period (IOP8) case study is discussed in Sect. 5. Conclusions are found in Sect. 6.
2.1 Model configurations
The AROME-WMED model strongly relies on the AROME-France model, which is the Météo-France operational limited-area model (Seity et al., 2011; Brousseau et al., 2016). This model is based on a non-hydrostatic equation system (Bénard et al., 2010). At the time of the campaign (2012), it had a 2.5 × 2.5 km horizontal mesh and 60 vertical levels ranging from 10 m above the surface to 1 hPa. A one-moment microphysical parametrization (Pinty and Jabouille, 1998; Caniaux et al., 1994), which takes into account five classes of hydrometeors (cloud liquid water, cloud ice, rain, snow, and graupel) is used. Two schemes represent the vertical turbulent transport in the boundary layer: an eddy diffusivity scheme based on a prognostic turbulent kinetic energy parameterization (Cuxart et al., 2000) and a mass flux scheme (Pergaud et al., 2009) to account for dry thermal and shallow convection. There is no deep convection parameterization. A specific algorithm named CANOPY (Masson and Seity, 2009) diagnoses the 2 m temperature, 2 m humidity, and 10 m wind at every time step in the surface scheme (SURFEX; Masson et al., 2013).
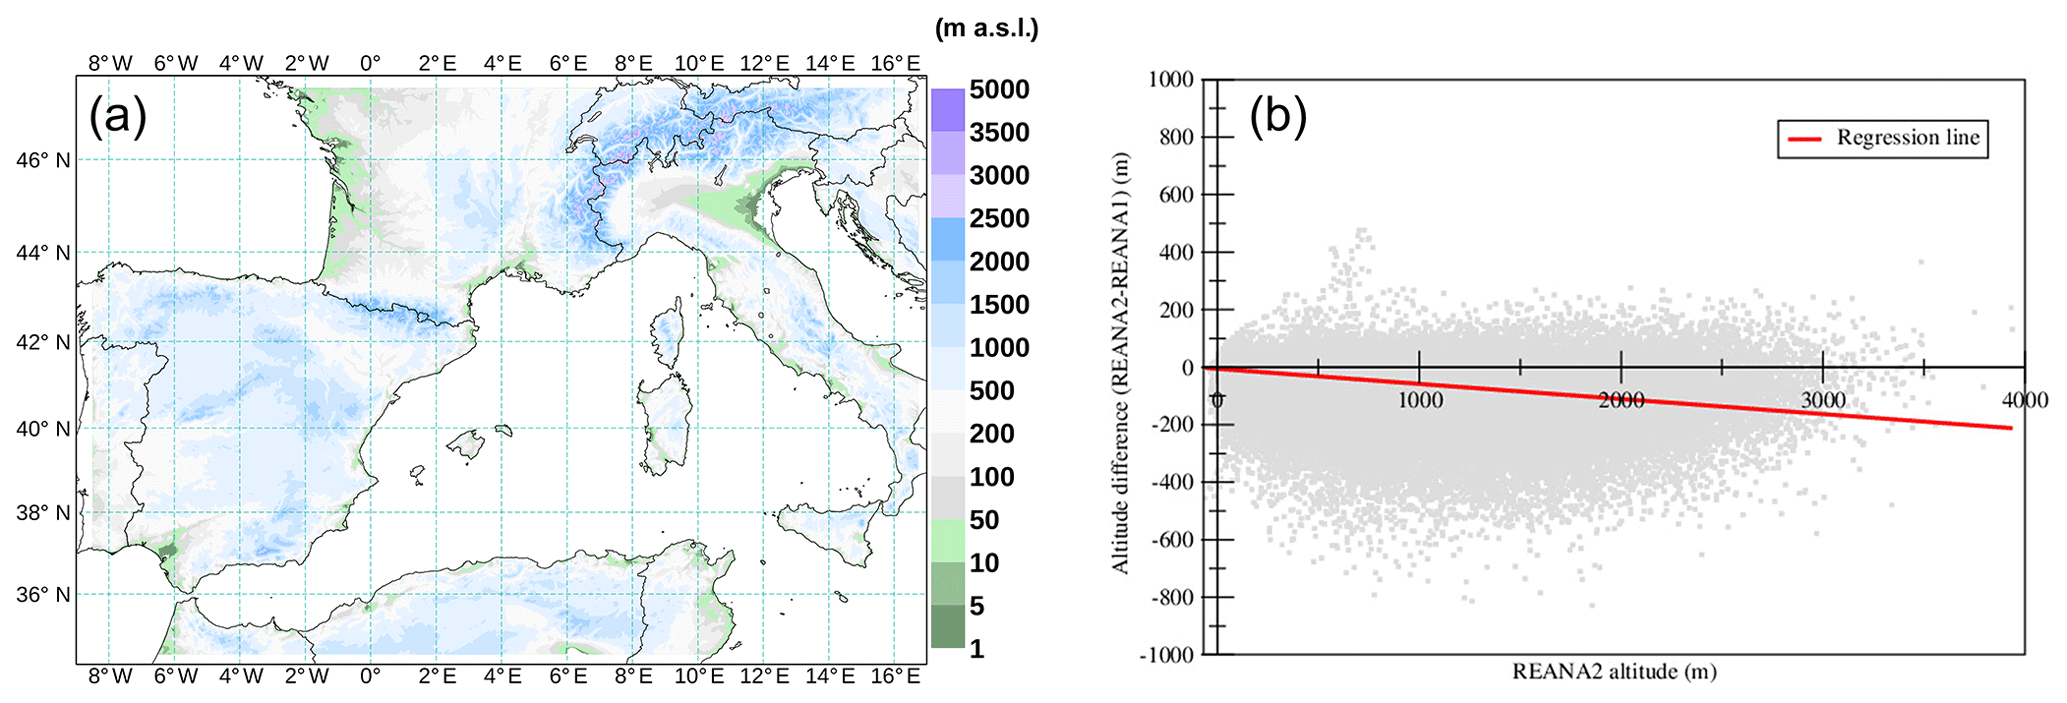
Figure 1REANA2 orography (a) and difference between REANA2 vs. REANA1 (b). The red line corresponds to the regression between the two datasets.
The AROME-WMED domain (34∘ N, 11∘ W; 48∘ N, 20∘ E) ranges from Portugal to Italy and from North Africa to France (Fig. 1). It was designed to study high precipitation events that occur over the northwestern Mediterranean from Catalonia to central Italy. The horizontal model grid is a 960 × 640 point matrix centered on 41.5∘ N, 4.1∘ E.
Table 1AROME-WMED reanalysis and model configurations (main differences): SOP1 for real time, REANA1 for first reanalysis, REANA2 for second reanalysis.
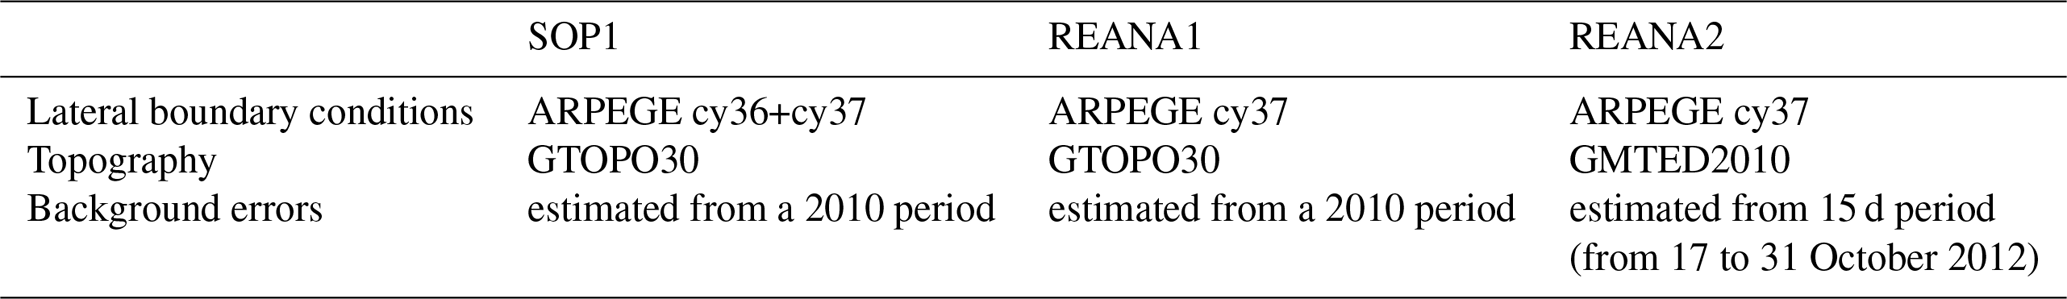
Table 1 lists the main differences of configuration in the model. The same method as in AROME-France was used to set up the surface characteristics for the SURFEX scheme. Physiographic data are initialized over the AROME-WMED domain using the so-called ECOCLIMAP database at 1 km resolution (Masson et al., 2003). The topography is extracted from the Global 30 Arc-Second Elevation Data Set (GTOPO30; https://www.usgs.gov/media/files/gtopo30-readme, last access: 3 July 2019) for the real-time version and the first reanalysis. In the second reanalysis, the Global Multi-resolution Terrain Elevation Data 2010 (GMTED2010; Danielson and Gesch, 2011) database was used. A mean difference of −21 m was found between the orography interpolated onto the AROMEWMED grid from GMTED2010 used in the REANA2 and the one interpolated from GTOPO30 used in the REANA2 and SOP1 versions (Fig. 1).
Lateral boundary conditions are provided by the Météo-France global NWP ARPEGE system (Courtier et al., 1991). For REANA2, ARPEGE forecasts benefit from a maximum of assimilated data using longer cutoff analyses than for REANA1 and SOP1. Once per day, a 54 h forecast is run at 00:00 UTC for both reanalyses compared to the 48 h forecast range of the real-time version. This allows for the comparison of 24 h forecasted precipitation with rain gauges, which are mainly available for the period 06:00–06:00 UTC on the following day.
2.2 Data assimilation and background error statistics
Initial atmospheric states of AROME-WMED come from 3D-Var analyses. These analyses are performed every 3 h by assimilating observations taken within a ±1.5 h assimilation window. For non-frequent observations at the same location, all observations included in this time range are considered. However, for frequent observation types such as radars or radiances from geostationary satellites, the observations closest to the analysis time are kept within the time range (−1.5 h; +1.5 h) for the assimilation. The first guess is the 3h forecast from the previous analysis time. The analyzed variables are temperature, specific humidity, the two horizontal components of the wind, and surface pressure. For the surface analysis, an optimal interpolation scheme is used to analyze soil temperature, soil humidity over land, and sea surface temperature from data measured with surface stations and buoy observations (Masson et al., 2013).
The background error covariance matrix (the so-called B matrix) is a key component of the variational assimilation system, as it weights the spread of the observation impact in the data assimilation system. As in AROME-France, a climatological background error covariance matrix is used and has been computed from an AROME-WMED data assimilation ensemble using the approach proposed by Brousseau et al. (2011). In the real-time version and in the first reanalysis, the background error covariance matrix was computed over a 1-week period in October 2010, characterized by convective systems over southern France and Catalonia.
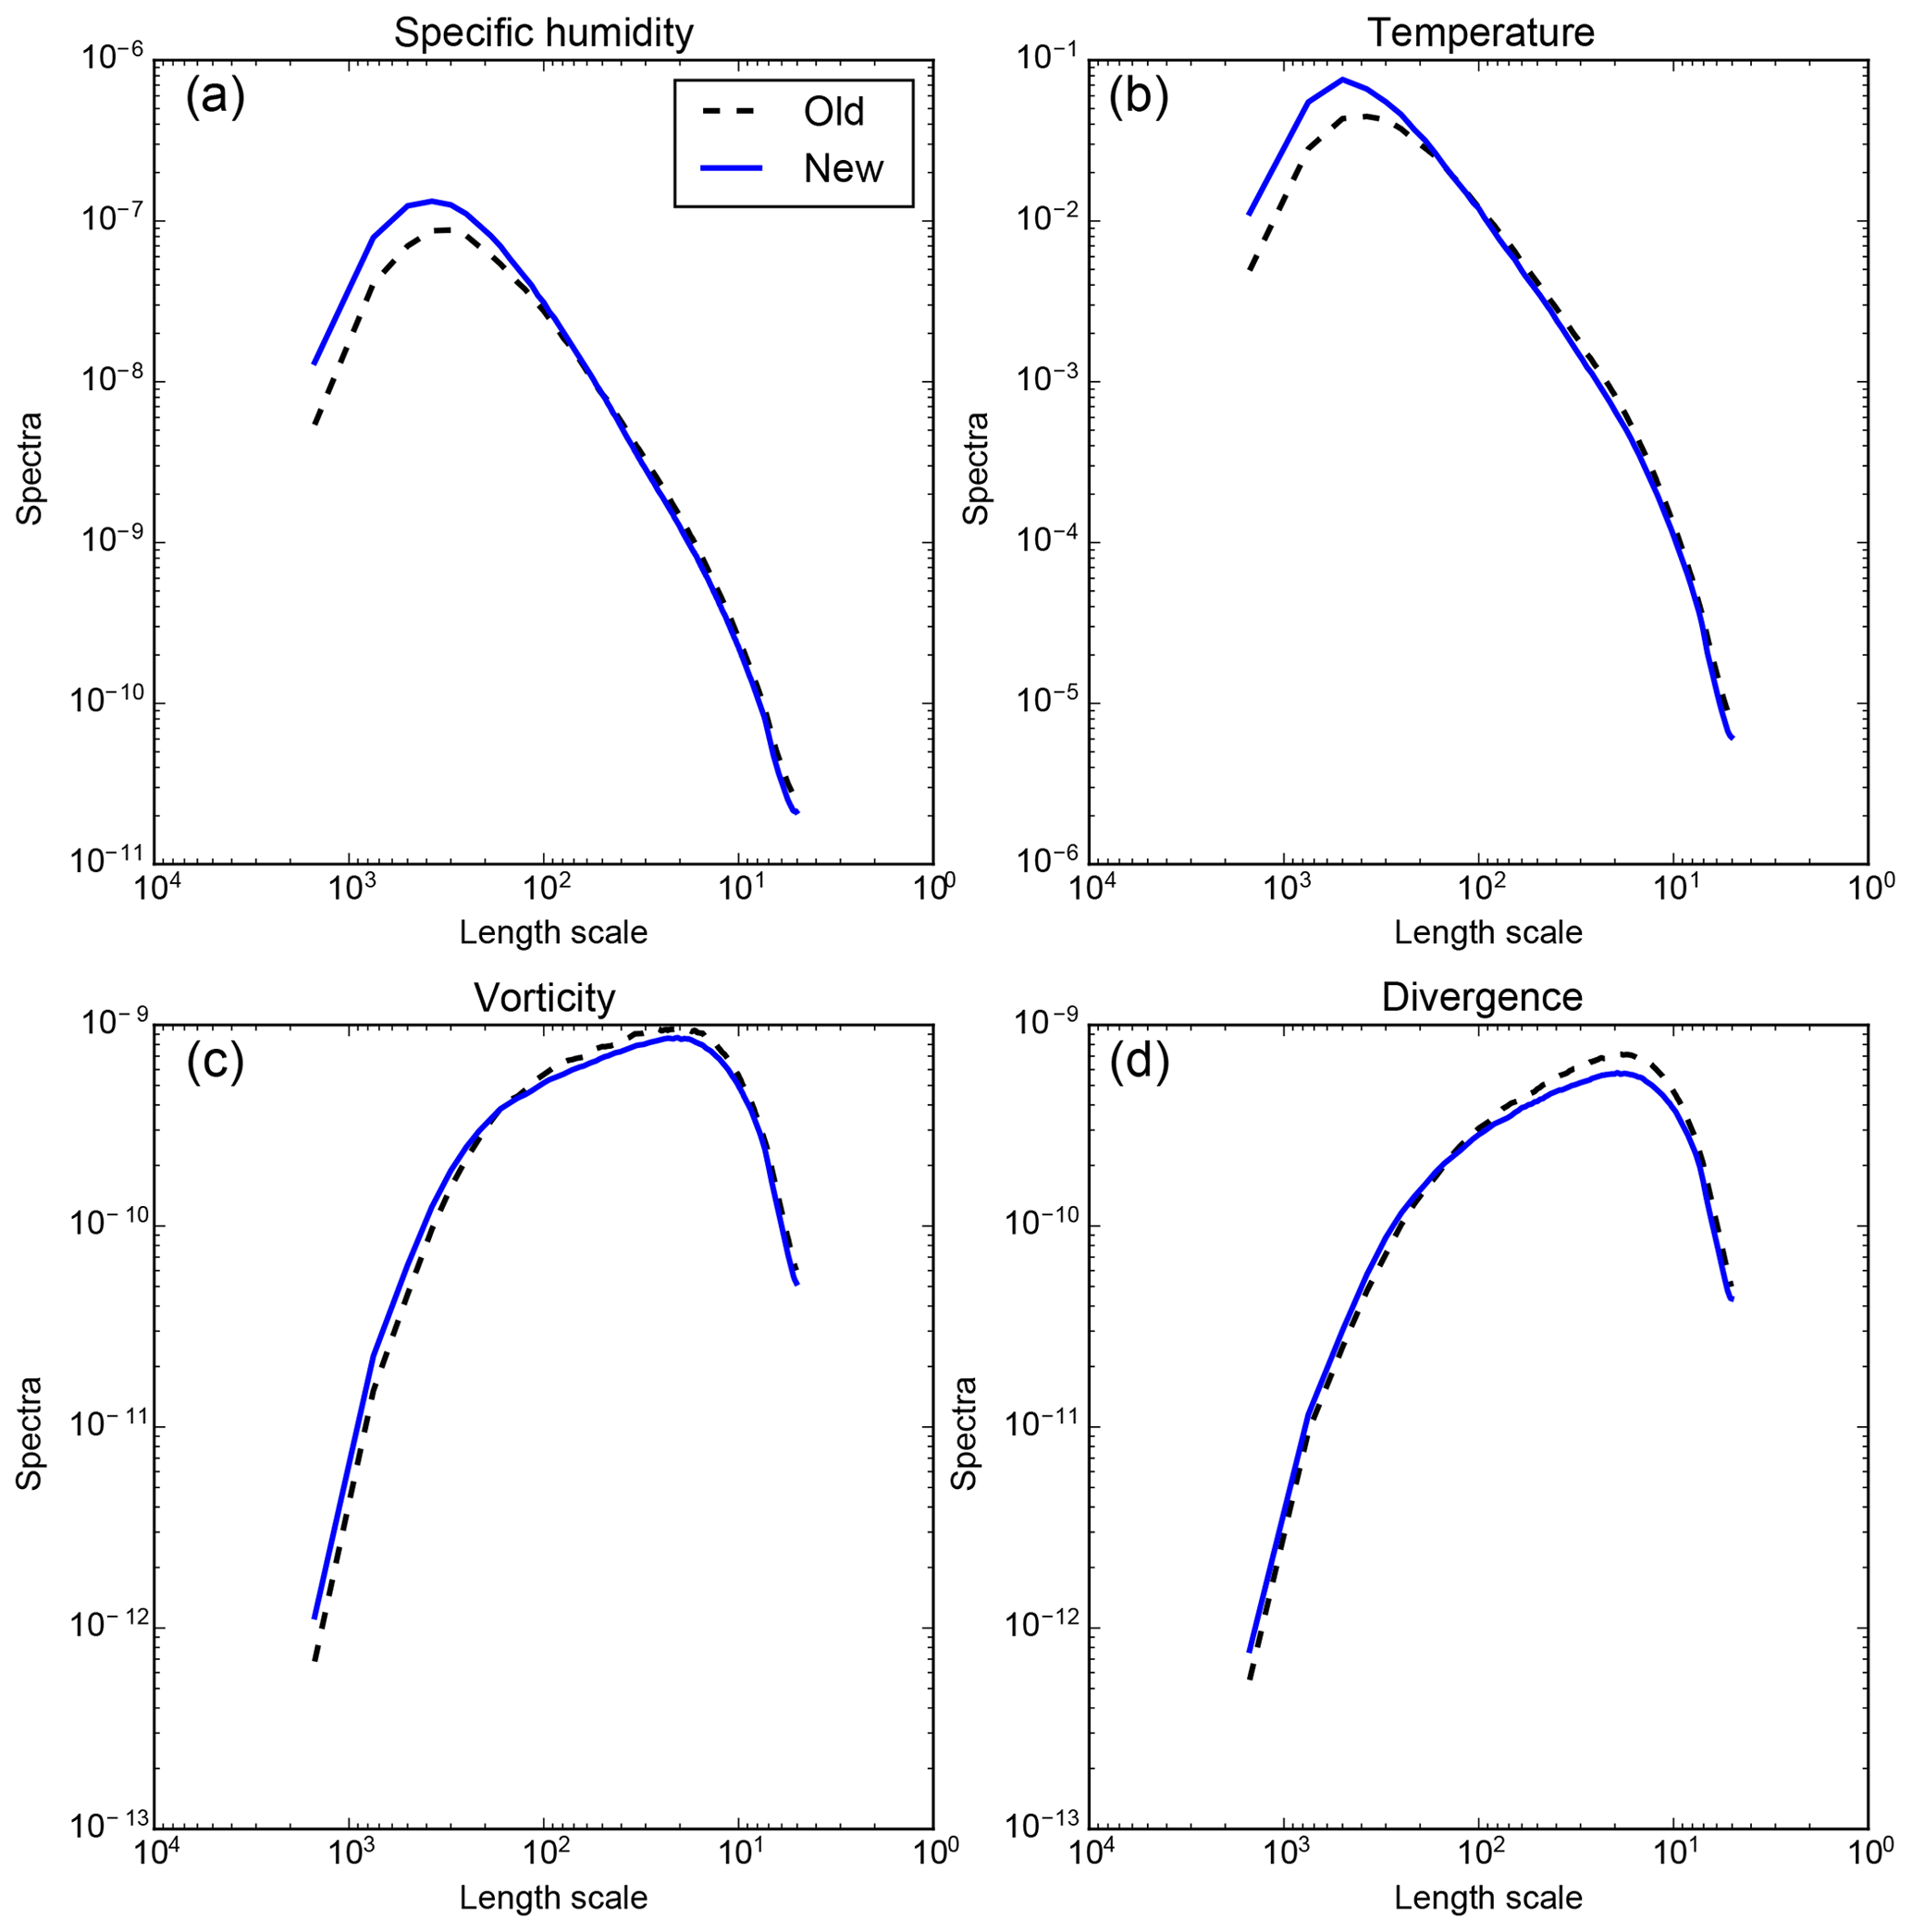
Figure 2Variance spectrum for specific humidity (a), temperature (b), vorticity (c), and divergence (d) for the SOP1 and REANA1 version (dashed black line) and REANA2 (blue line) at about 600 hPa. The x axis is in kilometers.
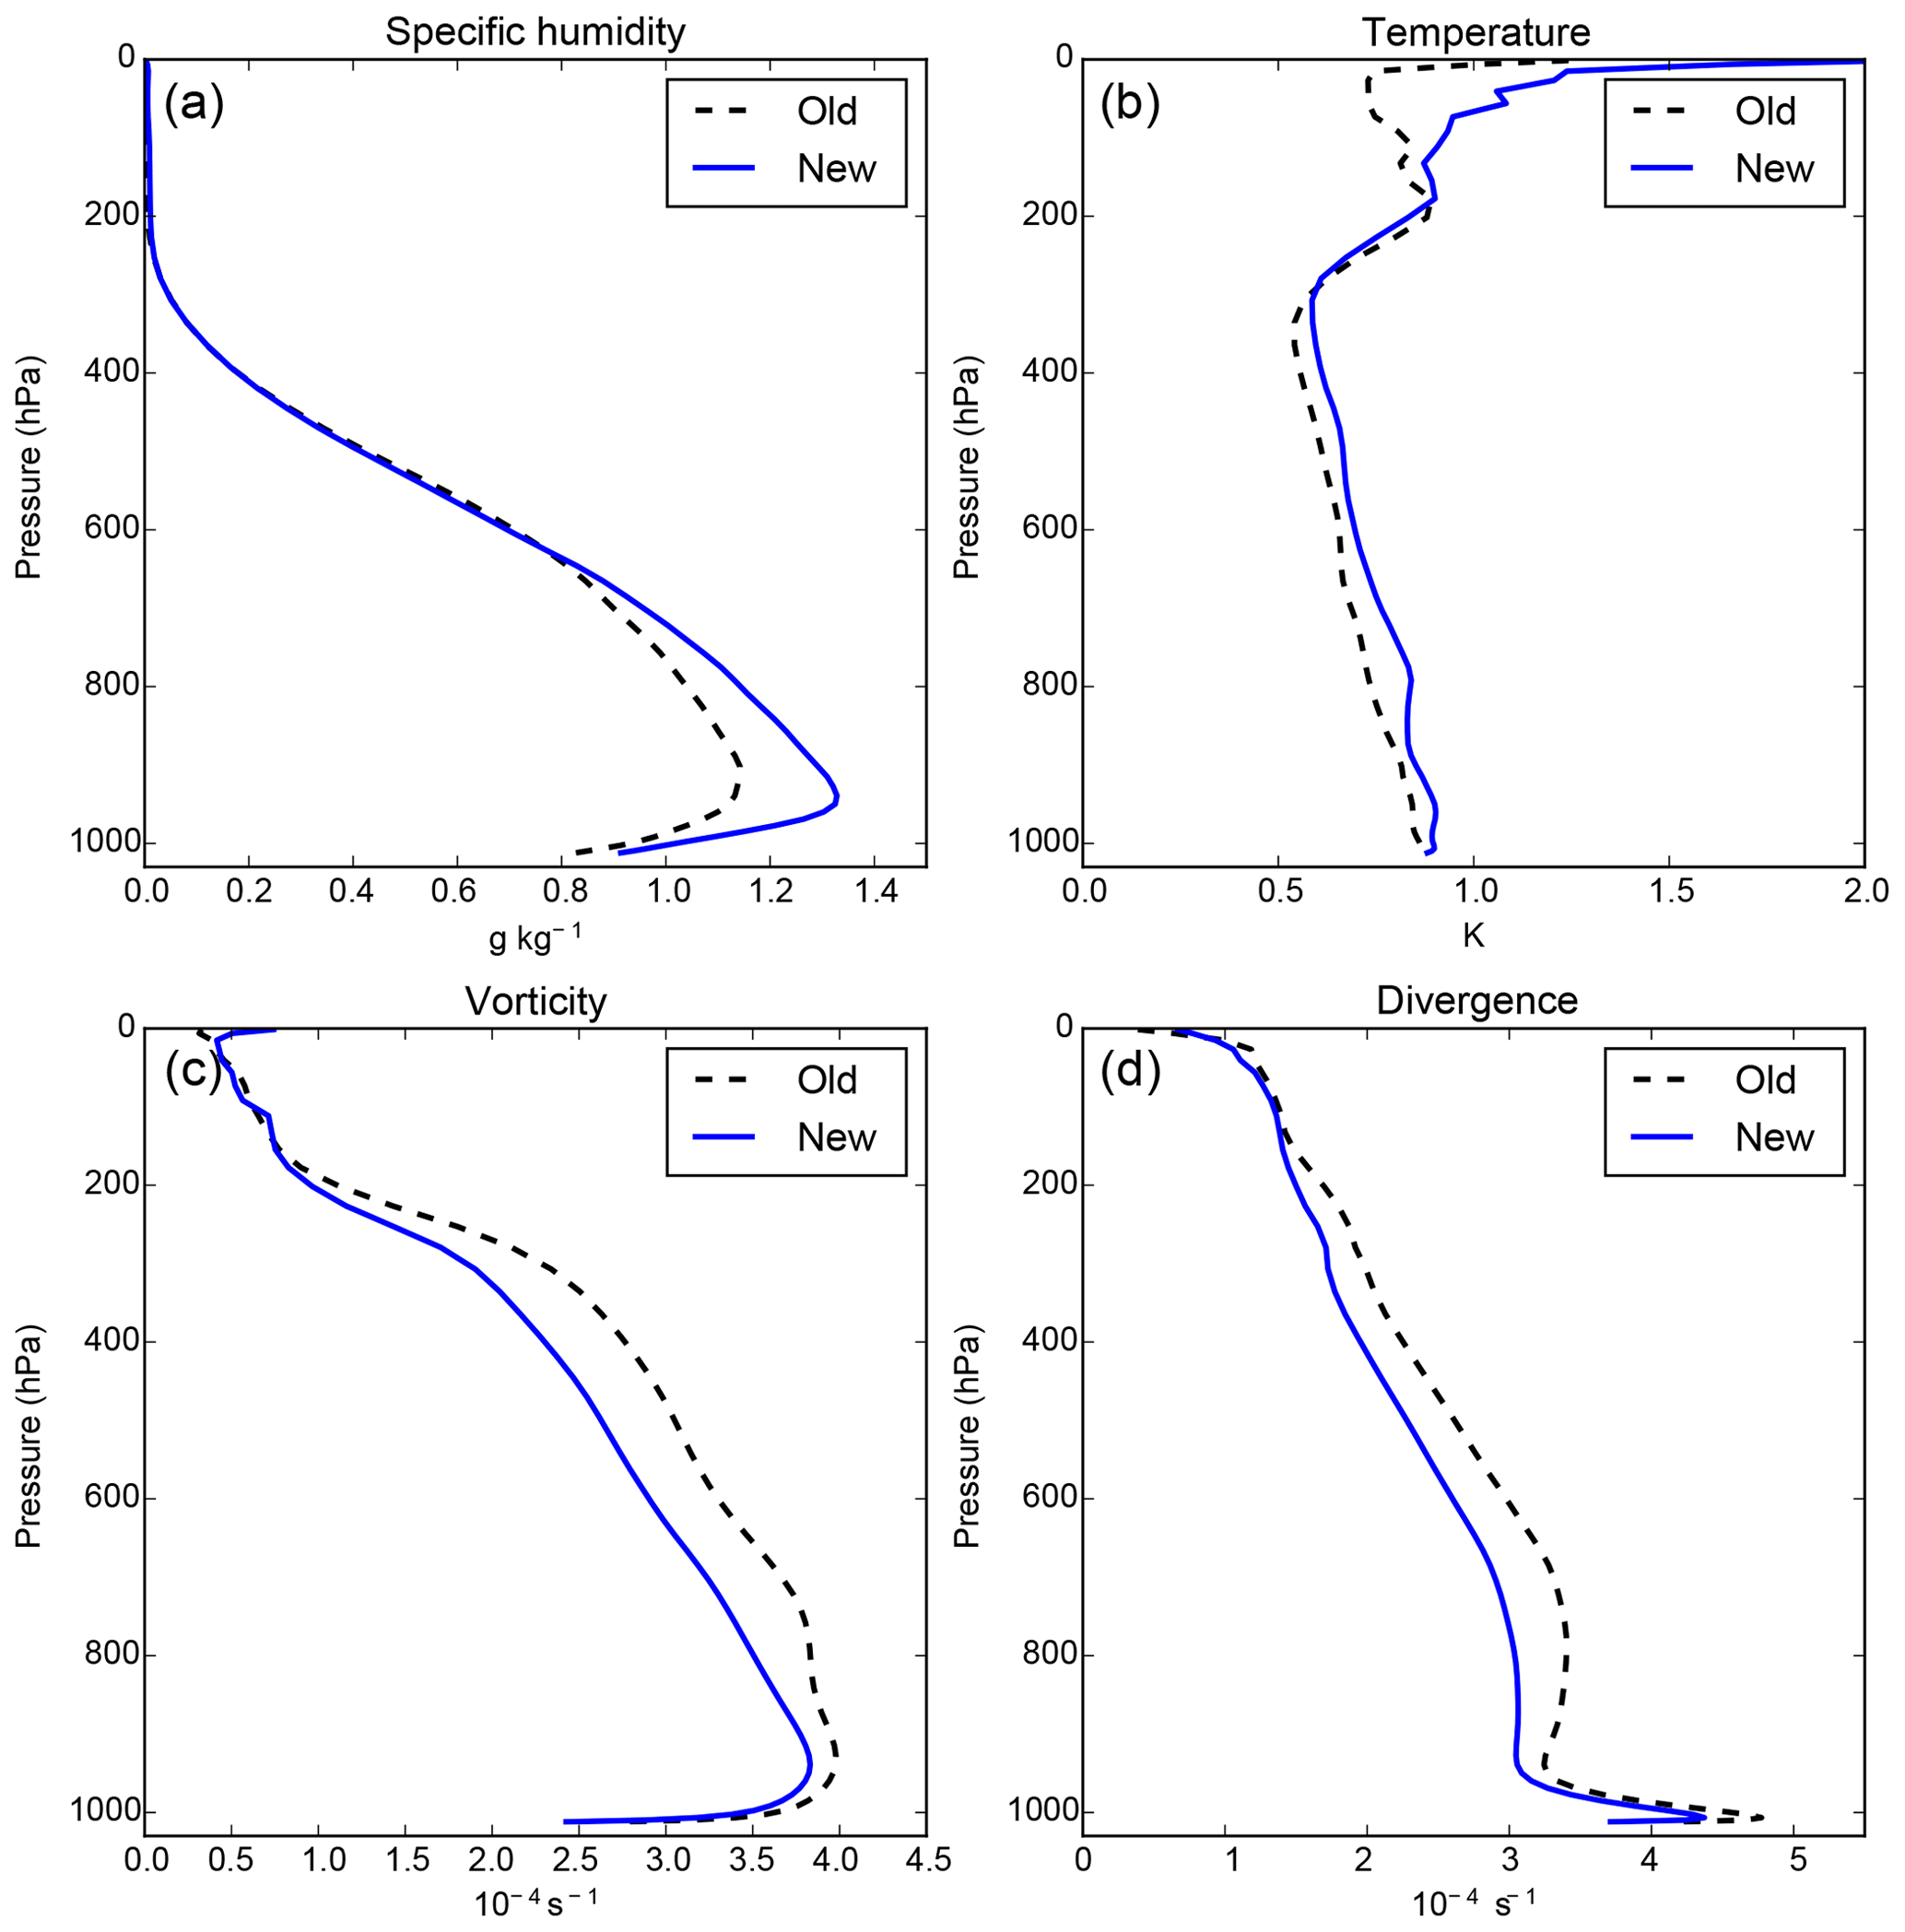
Figure 3Background error standard deviation for specific humidity (a), temperature (b), vorticity (c), and divergence (d) for the SOP1 and REANA1 versions (dashed black line) as well as REANA2 (blue line) at around 600 hPa.
For the second reanalysis, the background error covariance matrix was computed over a longer period of the HyMeX special observation period (17 to 31 October 2012); this new B matrix is more representative of the encountered meteorological conditions. Comparing the variance error spectra of both matrices (see, for example, the error variance spectra at around 600 hPa in Fig. 2), it appears that for all parameters, the error variances for REANA2 are smaller for the smaller horizontal scales of the model and, in contrast, are above for the larger ones due to meteorological situations involving fewer small-scale features than during the period in October 2010 used to estimate the B matrix for SOP1 and REANA1. These changes in variance spectra are twofold.
First, for temperature and specific humidity (vorticity and divergence), this increase (decrease) occurring for scales in the maximum of the variance spectra leads to a general increase (decrease) in spectrally averaged background errors (Fig. 3) in the new B matrix. This means that using the same background and the same observation, the analysis fits (does not fit) the temperature and humidity (wind) observations better using the REANA2 B matrix than the SOP1–REANA1 one.
Secondly, horizontal correlation length scales are slightly longer in REANA2 than in REANA1 and SOP1, which allows each observation to modify the analysis over a more horizontally extended area.
The other components of the background error covariances (i.e., vertical correlations and cross-correlations between the different analyzed model fields) are similar for both B matrices (not shown).
3.1 Observations common to all AROME-WMED versions
Both the REANA1 and REANA2 reanalyses used all available data with no time constraint (cutoff), contrary to the SOP1 (real-time) version. These observations come from radiosondes, including mobile sites along the French Mediterranean coast, surface stations and buoys, aircraft, and wind profilers. Satellite data are dominant in the analysis, contributing to more than 50 % of the assimilated data flow, since a large part of the domain is over the sea. Satellite data comprise infrared and microwave radiances from polar-orbiting satellites, radiances from SEVIRI onboard the Meteosat Second Generation (MSG), surface wind from scatterometers over the Mediterranean Sea, and atmospheric motion vectors.
Table 2Main differences, in terms of assimilated data, between the first (REANA1) and the second (REANA2) reanalysis.
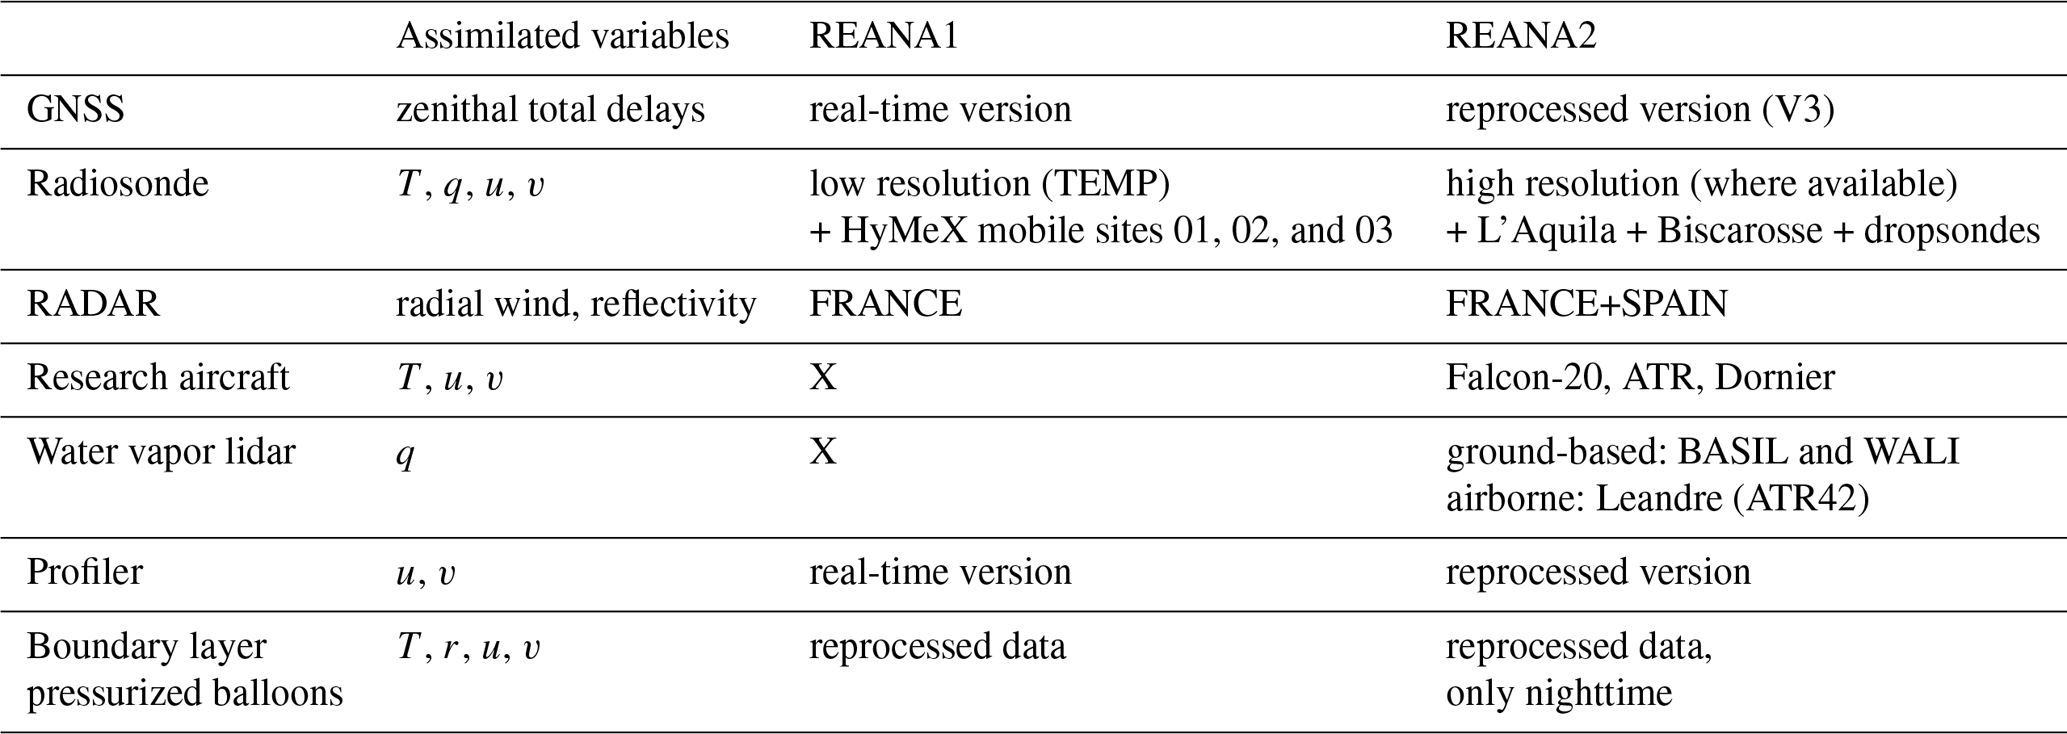

Figure 4REANA2 assimilated data focus: green disks represent the location of radiosondes (fixed and mobile) taken into account at high resolution, red diamonds the position of the Doppler radars, violet squares the lidar sites, and blue triangles the global positioning system (GPS) and GNSS stations.
GNSS (global navigation satellite system) zenith total delay (ZTD) observations from the EUMETNET EIG GNSS water vapor program (E-GVAP) network are assimilated as well. Another major data source is the French Doppler radar network (around 18 radars in the AROME-WMED domain), which provides Doppler winds (Montmerle and Faccani, 2009) and reflectivities used to derive relative humidity profiles (Caumont et al., 2010; Wattrelot et al., 2014), but their density is weather dependent, i.e., the presence of rain or not. Fourrié et al. (2015) provide complementary information about the assimilated data.
3.2 Observations specific to REANA2
In addition, new datasets and reprocessed observations were assimilated in REANA2. Table 2 summarizes the main differences in terms of assimilated observations between the two reanalyses. The GNSS zenithal total delays from the reprocessed dataset available in the HyMeX database (Bock et al., 2016) have been used. The methodology for their assimilation is described in Mahfouf et al. (2015). All available GNSS data were reprocessed homogeneously with a single software program, more precise satellite orbits and clocks, and additional sites taken into account (e.g., Sardinia). This led to better coverage as shown in Fig. 4, especially over France, the Iberian Peninsula, and Italy. Furthermore, an updated static bias correction for each couple (GNSS station, analysis center) was computed for the REANA2 version. Data from BLPBs (temperature, humidity, and wind) were assimilated in both reanalyses REANA1 and REANA2. The raw data were averaged over an approximate 20 min period. Moreover, to guarantee the consistency of such data, averaging was only performed over periods corresponding to stabilized flight segments. In REANA2, temperature data were discarded during daytime due to radiative bias and model errors in the boundary layer.
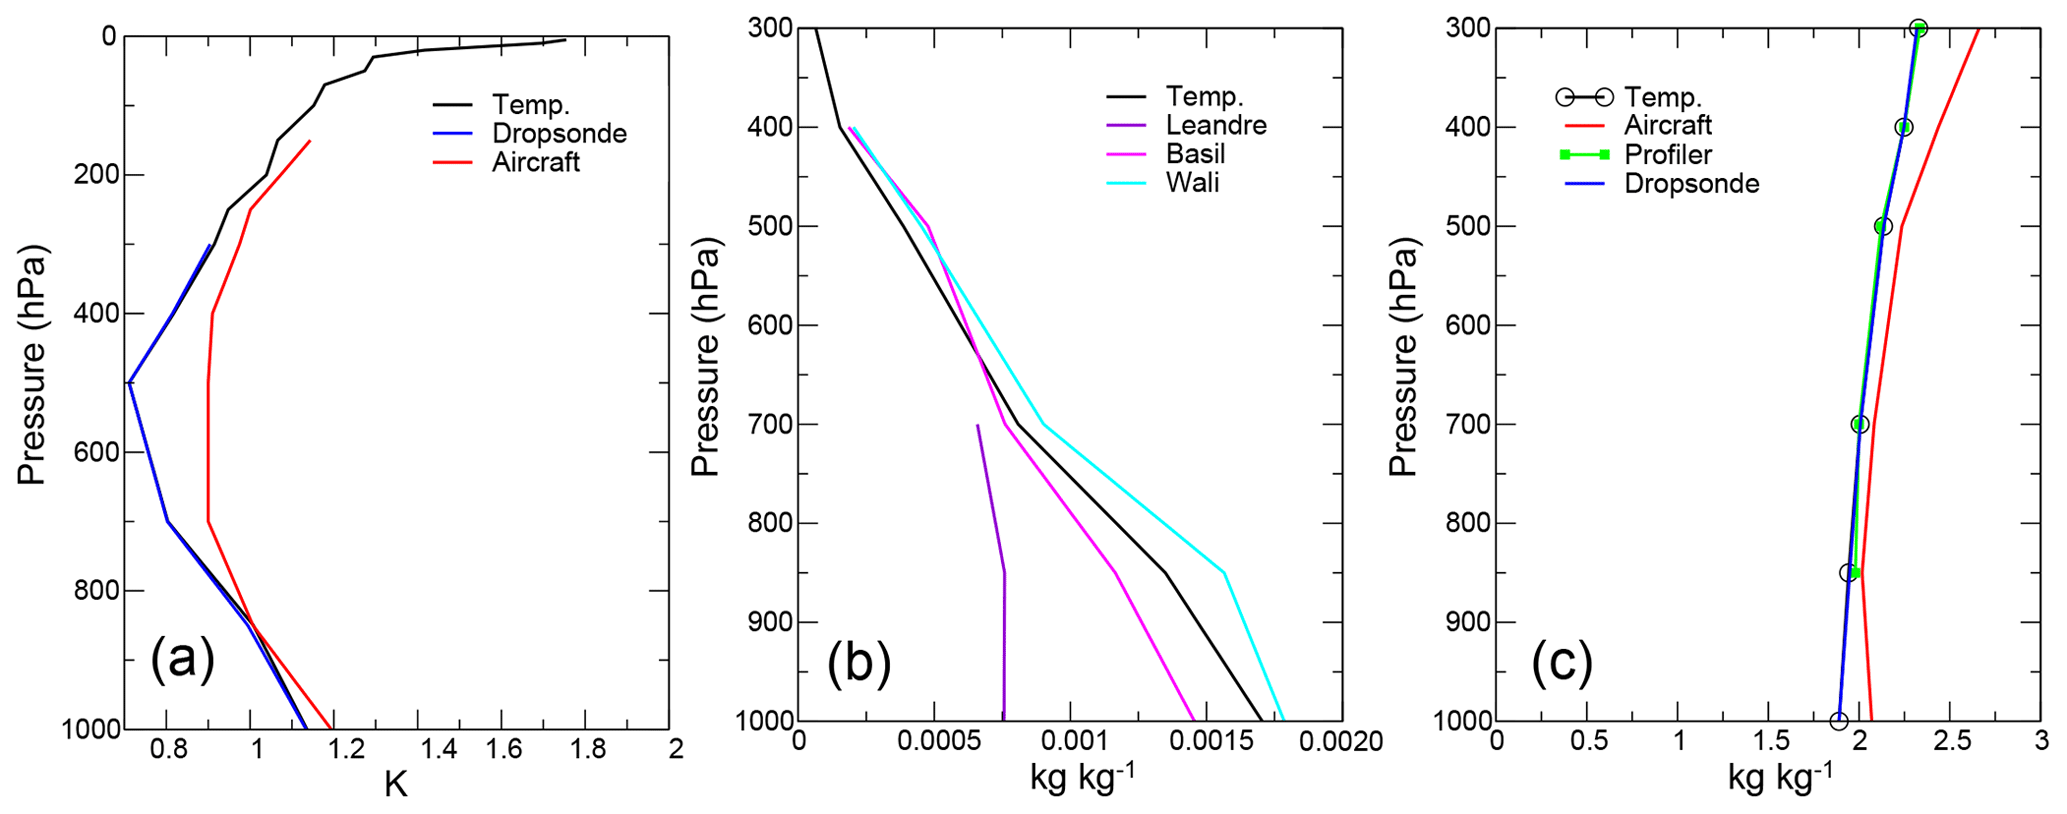
Figure 5Observation error associated with different data types in REANA2 for temperature (a), humidity (b), and wind (c).
High-vertical-resolution radiosondes available in France (including dedicated HyMeX mobile soundings) and in some sites in Spain, as shown in Fig. 4, were used instead of the classical TEMP (upper air sounding) messages assimilated in the SOP1 and REANA1 versions as proposed in Ingleby et al. (2016). This leads to an increased data flow (100 to 150 data points per profile instead of 30 for the TEMP message); extra sounding sites were also processed, such as L'Aquila (a research center in Italy) and Biscarosse, a French military site close to the Atlantic coast. Data from several Spanish Doppler radars (Valencia, Barcelona, Murcia, Almeria, and Palma) were also used in the second reanalysis after careful quality control. Wind profiler data were also carefully checked in order to remove spurious signals (Saïd et al., 2016). Humidity data retrieved from ground-based and airborne lidars were processed. Two ground-based research lidars were processed: one located in Candillargues (BASIL instrument; Di Girolamo et al., 2016) and the other on Menorca, an island in Spain (WALI instrument; Chazette et al., 2016). These data were smoothed through an interpolation at a 200 m vertical resolution and outliers were removed. The lidar Leandre II data (temperature and wind) from 22 ATR flights were also assimilated according to the method described in Bielli et al. (2012); these data were thinned at a 15 km horizontal resolution to avoid horizontal error correlation problems in the data assimilation process. The associated observation errors were deduced by monitoring the standard deviation of differences between background simulations for new observation data types and observations, and they are displayed in Fig. 5. Some differences are observed on the plot for lidar data. The observation errors for Leandre II data are smaller than the other ones, and WALI assigned observation errors are slightly larger than BASIL and TEMP ones. Concerning temperature and wind the assigned observation errors are the same for dropsondes, radiosondes, and profilers; the aircraft data errors are larger.

Figure 6Number of assimilated data in the AROME-WMED model for the real-time version (SOP1) and the first (REANA1) the second (REANA2) reanalysis.
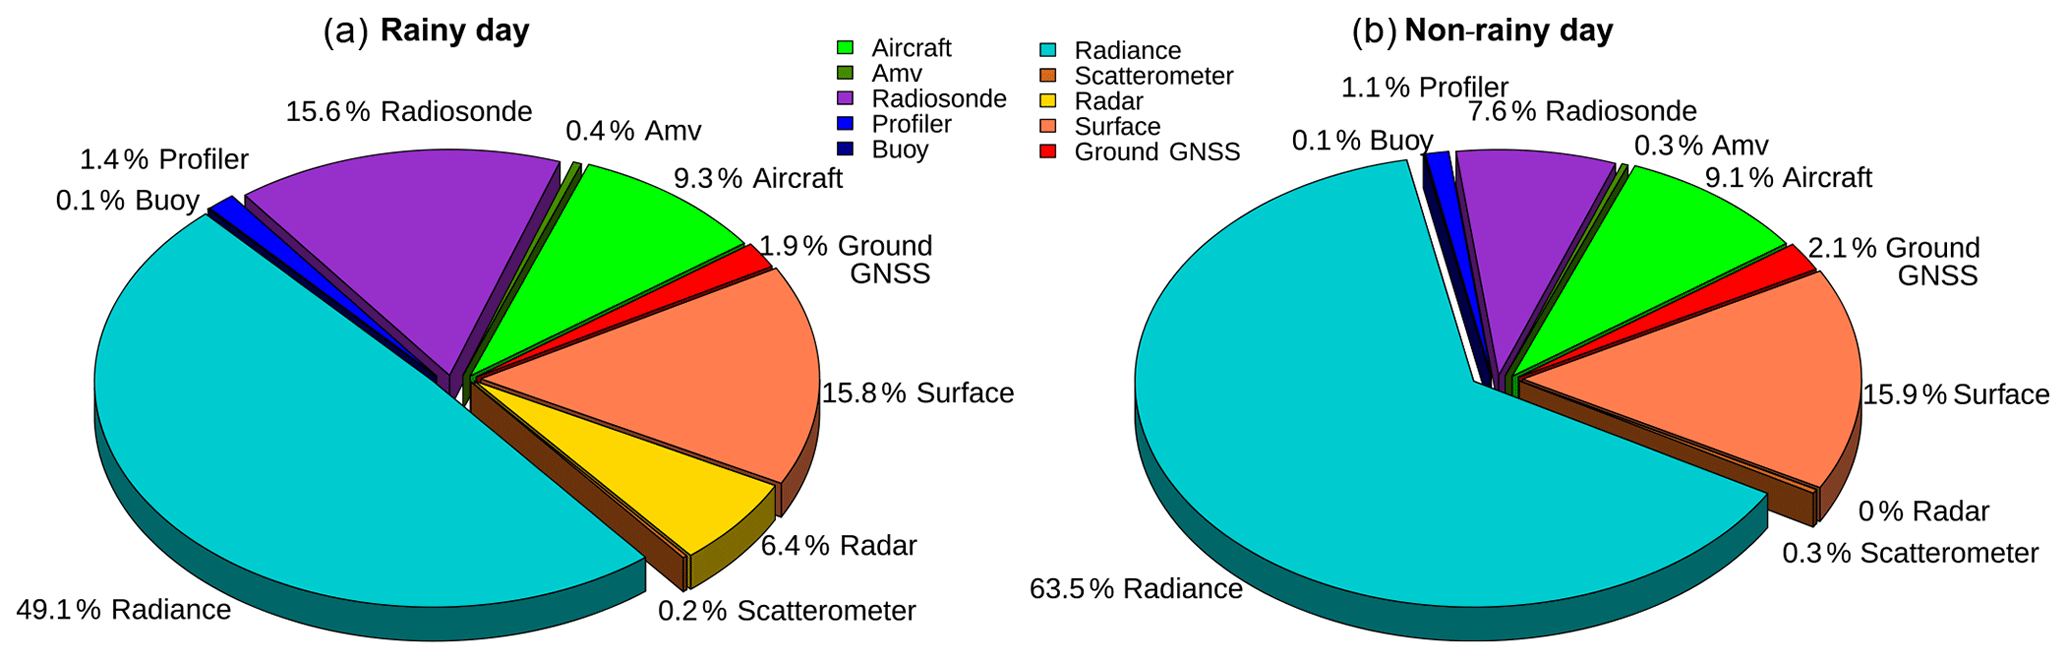
Figure 7Distribution of assimilated data in the second reanalysis (REANA2) for 26 September 2012 (eight analysis times, a, rainy day) and for 5 October 2012 (b, non-rainy day).
The amount of assimilated data per observation type for each AROME-WMED analysis version is given in Fig. 6. The number of assimilated data in REANA1 (red bars) is slightly increased with respect to the SOP1 version (black bars). This can be explained by the fact that all available observations, not only those present in real time in the Météo-France database, were assimilated; +9 % additional data were thus assimilated in REANA1 compared to SOP1. Concerning the REANA2 (blue bars), +24 % additional data with respect to SOP1 and +13 % with respect to REANA1 were assimilated. The higher amount of observations mainly comes from radiosondes (higher resolution and additional sites), profilers, satellite radiances, scatterometer wind estimates, surface parameters, and ground-based GNSS data. However, although five Spanish Doppler radars were included in REANA2, fewer data from radars were assimilated as a consequence of a revised statistic tuning.
Examples of the assimilated data distribution for a rainy day (26 September 2012) and a non-rainy day (5 October 2012) are shown in Fig. 7. First of all, satellite data contribute most to the observational set. This distribution varies depending on weather conditions (rainy vs. non-rainy). For the rainy day, radar data represent 6 % of the total. The percentage of satellite data is reduced from 63.5 % to 50 % for a non-rainy day. Infrared measurements (SEVIRI and IASI) are indeed strongly affected by the presence of clouds and thus discarded. In this case the proportion of radiosonde data increases for the rainy day (twice the amount for the non-rainy day due to additional radiosondes). The large increase in radiosonde data for 26 September 2012 is explained by the fact that the DTS was activated, resulting in an increased frequency of radiosonde launches at specific sites.
4.1 Analysis and first guess
As a first validation step, the performance of the data assimilation systems from the three AROME-WMED sets was evaluated based on the analysis (AN) and first-guess (FG is the 3 h forecast) departures from the assimilated observations. These departures provide information on the analysis increment for AN and on very-short-range forecast quality for FG. Some of these statistics (mean and root mean square, RMS) are plotted in Fig. 8 for observations related to humidity and in Figs. 9 and 10 for wind. These datasets differ with respect to the AROME-WMED version, as the quality check based on the difference between the observation and the simulation can discard (or not) some observations due to a different background value. In addition, some observation types such, as lidar observations and Spanish radars, are specifically assimilated in REANA2. For the radiosondes and the wind profilers, the real-time observations were replaced with high-resolution data and reprocessed data, respectively, in REANA2.

Figure 8First-guess (FG, solid lines) and analysis (AN, dashed lines) departure against radiosounding (mixing ratio, g kg−1) (a–c), against humidity derived from Doppler radar (humidity, percent) (d–f), and against lidars and dropsondes (mixing ratio, g kg−1, only for REANA2) (g–i); columns correspond to mean departure (a, d, g), root mean square departure (b, e, h), and observation numbers (c, f, i). In panels (a–g), black curves are for SOP1, red is for REANA1, and blue is for REANA2. Orange lines are for Spanish radars in REANA2. Computation period extends from 5 September 2012 to 5 November 2012.

Figure 9Statistics for zonal wind departures (mean, panels a, d, g; root mean square, panels b, e, h) for SOP1 (black lines), REANA1 (red lines), and REANA2 (blue lines) for radiosondes (a–c), aircraft (d–f), and wind profilers (g–i). Solid lines correspond to first-guess (FG) statistics and dashed lines to analysis statistics (AN). Panels (c, f, i) represent the number of observations.
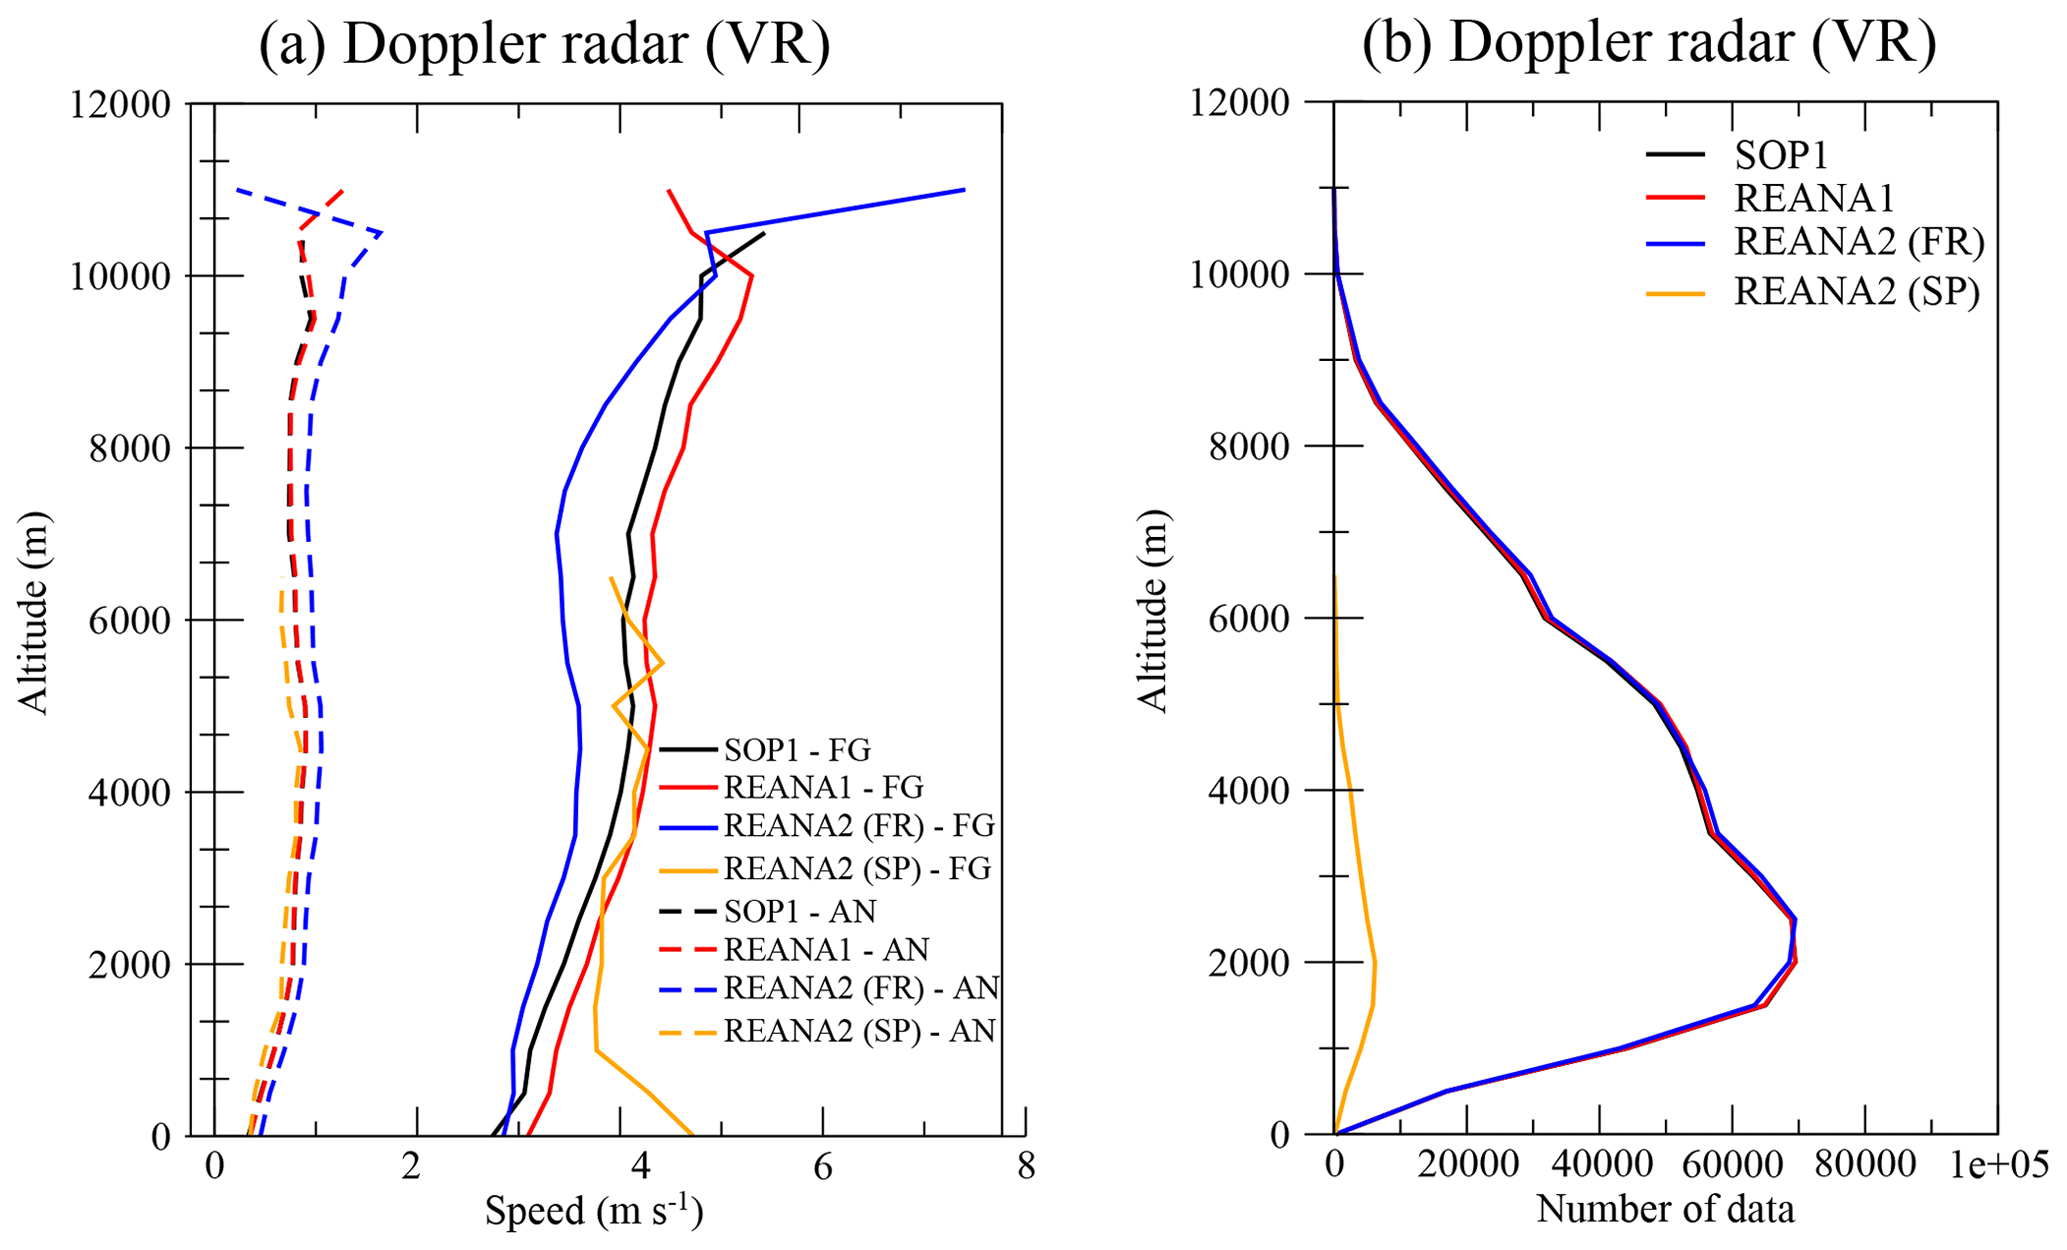
Figure 10Root mean square departure for the Doppler wind between observations, background (solid line), and analysis (dashed lines) for SOP1 (black), REANA1 (red), and REANA2 (blue) over French radars and REANA2 over Spanish radars (orange), with the number of observations available in each dataset (b).
For all observation types, the RMS values of AN departures are always smaller than the corresponding FG departures, as expected from a well-performing assimilation process.
As SOP1 and REANA1 use the same background statistics, results of these two sets are very close and slight differences are mainly explained by the different number of assimilated observations. For REANA2, the use of different background error covariances and additional observations has direct consequences on these statistics. For radiosounding in the troposphere, AN departures are smaller for humidity (in Fig. 8a–c) but higher for wind (in Fig. 9a–c) due to the variations of the background error standard deviation described in Sect. 2.2: an increase for specific humidity and temperature (the background is less trusted and the resulting analysis is closer to observations) and a decrease for vorticity and divergence directly related to the wind field (the background is more trusted and the resulting analysis is farther from the observations). In both cases, this has a positive effect: for these two fields the subsequent 3 h forecasts are closer to the observations, as indicated by lower FG departures, even for the wind, while the RMSs of analyses compared to observations are higher. This result is enhanced by the use of high-resolution vertical radiosondes, which enable an increase in the observation number and a better comparison to the background than the TEMP message. For specific humidity, the RMSs of AN and FG departure are respectively reduced by 30 % and 15 % between 1000 and 600 hPa. For wind, the differences are smaller and reach +20 % for AN departure and −10 % for FG departure. The impact of the background statistic changes is also visible for wind measurements from aircraft (Fig. 9d–f), with a similar number between the three experiments and radial velocity from Doppler radars (Fig. 10). The REANA2 AN departures are slightly larger than the SOP1 and REANA1, but the subsequent FG departures are smaller for REANA2 than for REANA1 and SOP1 between 800 and 300 hPa. The reduction in humidity AN departures is less obvious for radar reflectivities (Fig. 8d–f). These results suggest that the use of background error statistics more representative of the studied period allows for better use of the observations.
Statistics on AN and FG departure are also informative in terms of the quality of the additional observations only assimilated in REANA2. For the second reanalysis, numerous wind profilers have been reprocessed and their number increased from 1000 to 4000 observations at 700 hPa (Fig. 9g–i). This better quality induces a decrease in FG departures and a reduction of AN departures, despite a higher background error for wind.
Concerning the lidars (Fig. 8g–i), it is worth noting that the RMS background departures for BASIL and Leandre are very similar to the values obtained with radiosondes (Fig. 8a–c) showing data of comparable quality. WALI exhibits larger differences, the explanation for which is certainly linked to the fact that the lidar was located over land near the coast of Menorca. Hence, the nearest AROME-WMED grid point is located over the Mediterranean Sea, which may introduce a discrepancy in the computation of the model equivalent, especially in the atmosphere low levels (boundary layer). It should also be mentioned that lidar data represent very few data among the total number of assimilated data.
Dropsondes exhibit a larger humidity bias and RMS differences (more than 2 g kg−1 between 800 and 1000 hPa) than radiosoundings (1.5 g kg−1). Dropsonde measurements are therefore further away from the model values. This might be explained by the dropsonde sampling strategy, which involves launches close to convective areas and sampling low-predictability areas, thereby leading to larger humidity differences between the model and the observations. However, one can note that the AN departures are not impacted by these differences in the FG departure.
Lastly, statistics for Spanish radar observations are compared to those of the French network (in Fig. 8d–f for humidity derived from reflectivities and Fig. 10 for the wind force). Radar observations over Spain were available below 6000 m as a consequence of the sampling strategy. It appears that Spanish radar FG departures are higher than for French radars for Doppler wind below 2000 m (Fig. 10) and for reflectivities (Fig. 8d–f). Particularly, the latter exhibit a stronger dry bias (i.e., observation – background >0), which could be explained by different observation preprocessing (in order to take into account radar signal attenuation due to precipitation, for example) for Spanish radars. If AN departures are increased for reflectivities, they remain very close to the French radar ones for radial velocity.
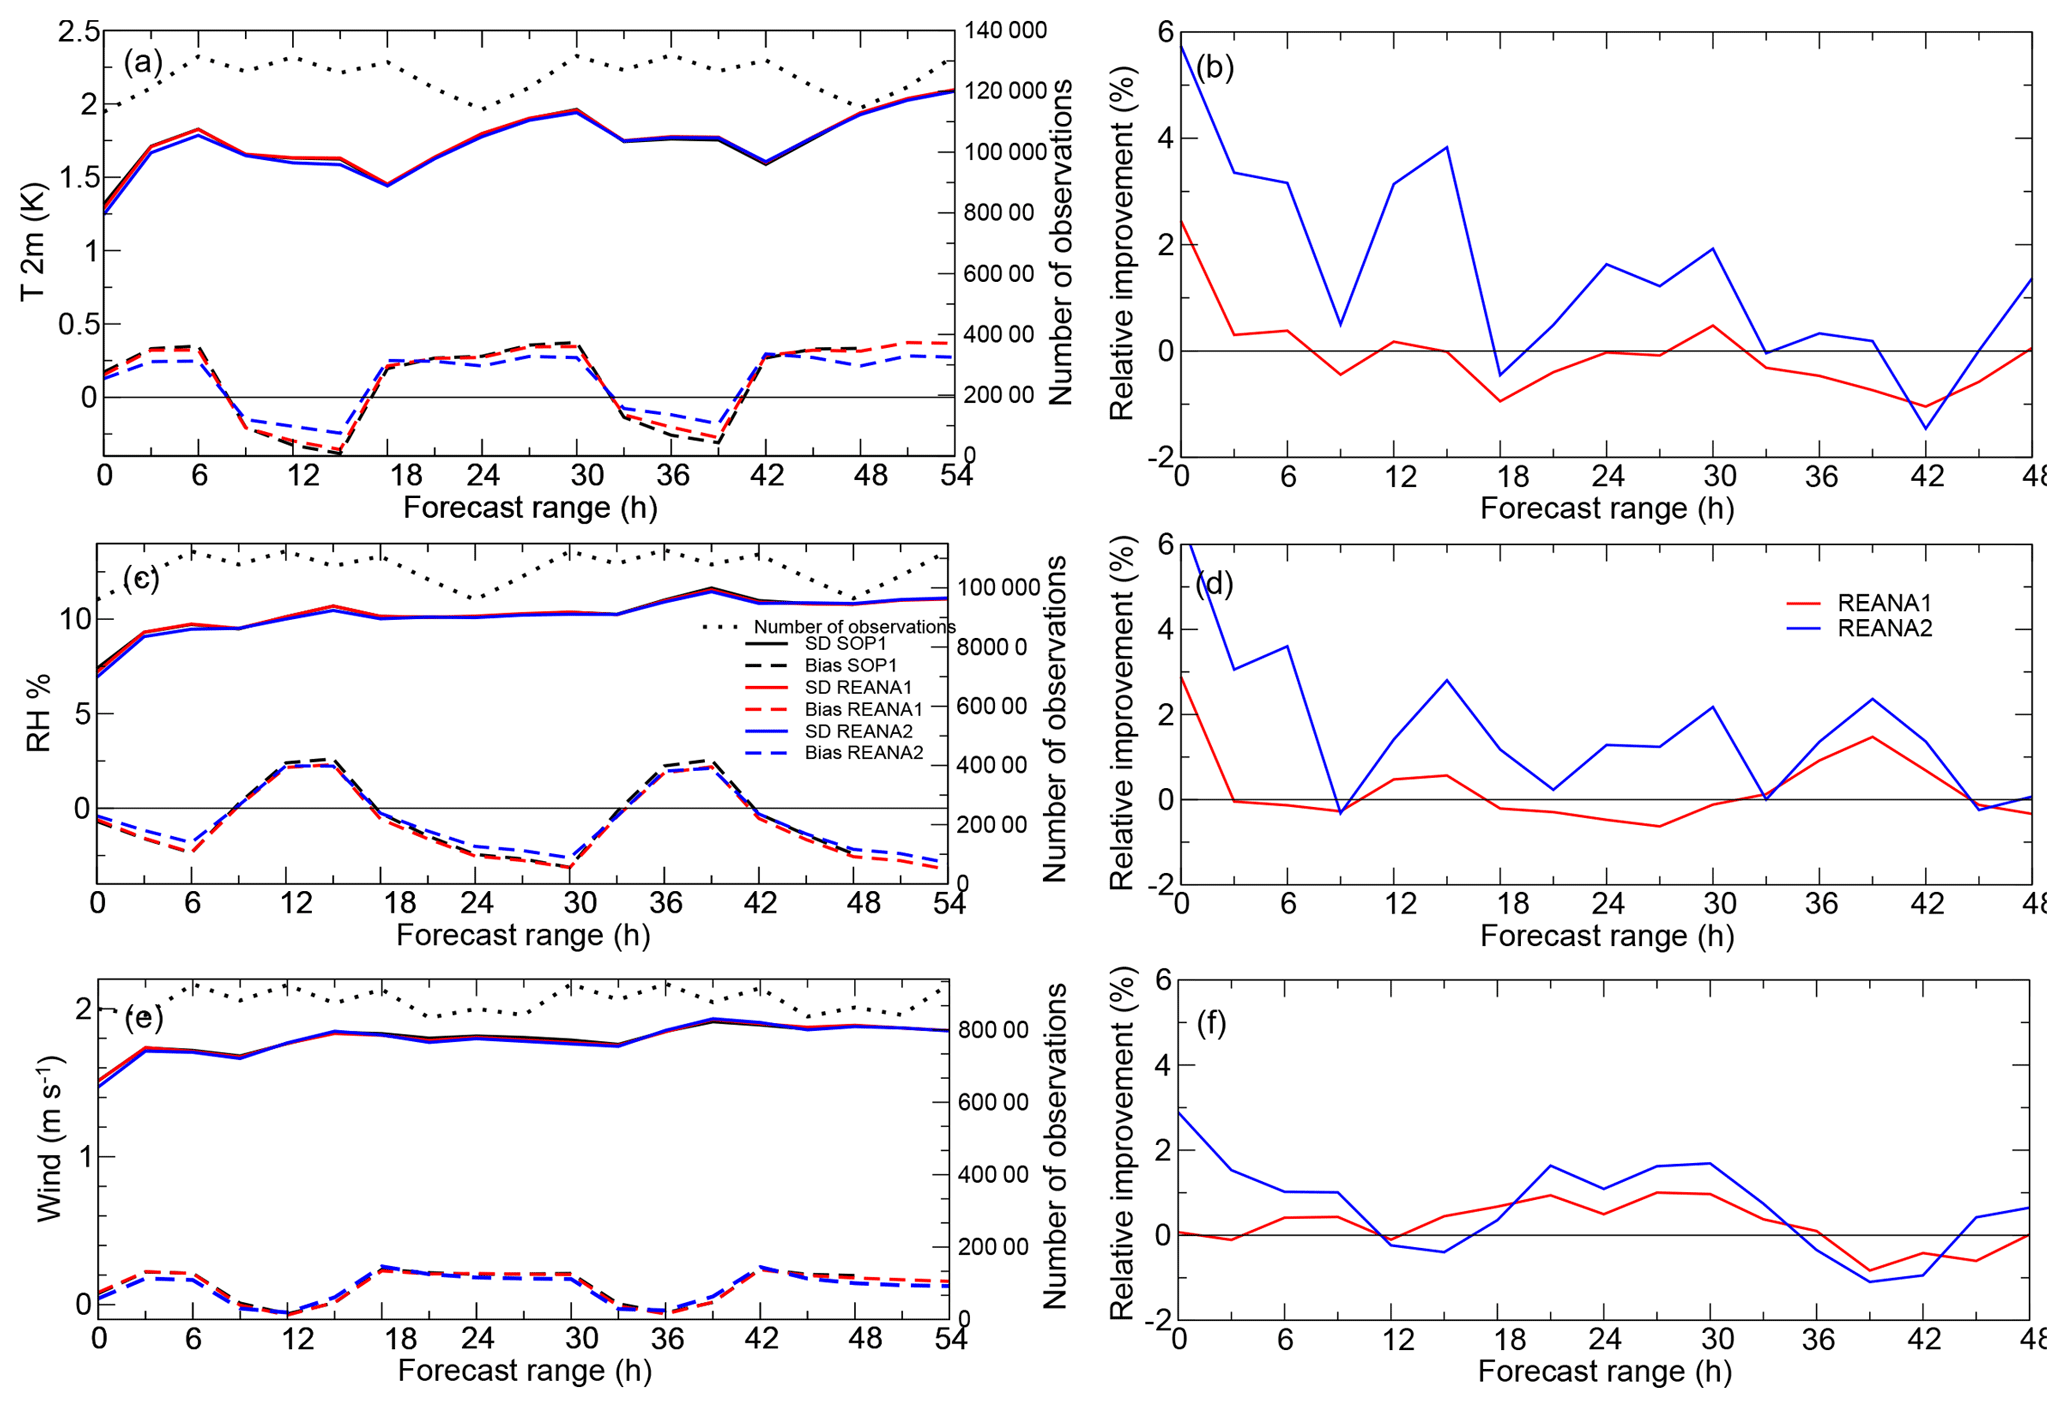
Figure 11Bias (forecast – observation, dashed lines) and root mean square error (solid lines) computed for 2 m temperature (a), 2 m relative humidity (c), and 10 m wind speed (e) with respect to the forecast range for the real-time AROME-WMED model (SOP1, black), the first reanalysis (REANA1, red), and the second reanalysis (REANA2, blue) from 5 September to 5 November 2012. Dotted lines represent the number of observations used for the comparison (right vertical axis). Panels (b, d, f) correspond to the relative root mean square error difference calculated with respect to SOP1.
4.2 Surface parameter analysis and forecast
The surface observations used for the evaluation were extracted from the HyMeX database, which gathers surface synoptic observations over the HyMeX area, additional hourly observations of temperature and humidity at 2 m from Météo-France, AEMET, and MeteoCat and the 10 m wind from some surface stations. The area selected for the evaluation is similar to the HyMeX domain, i.e., 36–47.5∘ N, 9∘ W–17∘ E. The various forecasts were compared with observations up to the 54 h forecast range (REANA1 and REANA2), except for SOP1, which was only run up to the 48 h forecast range (Fig. 11).
The model underestimates the 2 m temperature diurnal cycle (forecast minus observations; Fig. 11), with a maximum absolute value of 0.5 ∘C. The REANA2 simulation has a noticeable reduced bias for each forecast range, which is a positive impact due to modifications in the orography in REANA2. The standard deviation of forecast error, which increases with the forecast range, is also slightly and reduced up to the 18 h forecast range, and this is statistically significant according to a bootstrap test. A bias reduction is also noticed for the 2 m relative humidity, together with a very small gain on the standard deviation (up to the 9 h forecast range). In contrast, no real difference is noticeable for the biases between the three systems for the 10 m wind statistics. The relative improvement in forecast RMS error brought by REANA2 is larger than for REANA1 (more than 3 % for temperature and humidity at the 3 h forecast range and 1 % for the wind). The benefit varies as a function of the forecast range and remains up to the 30 h forecast range (except for the wind).
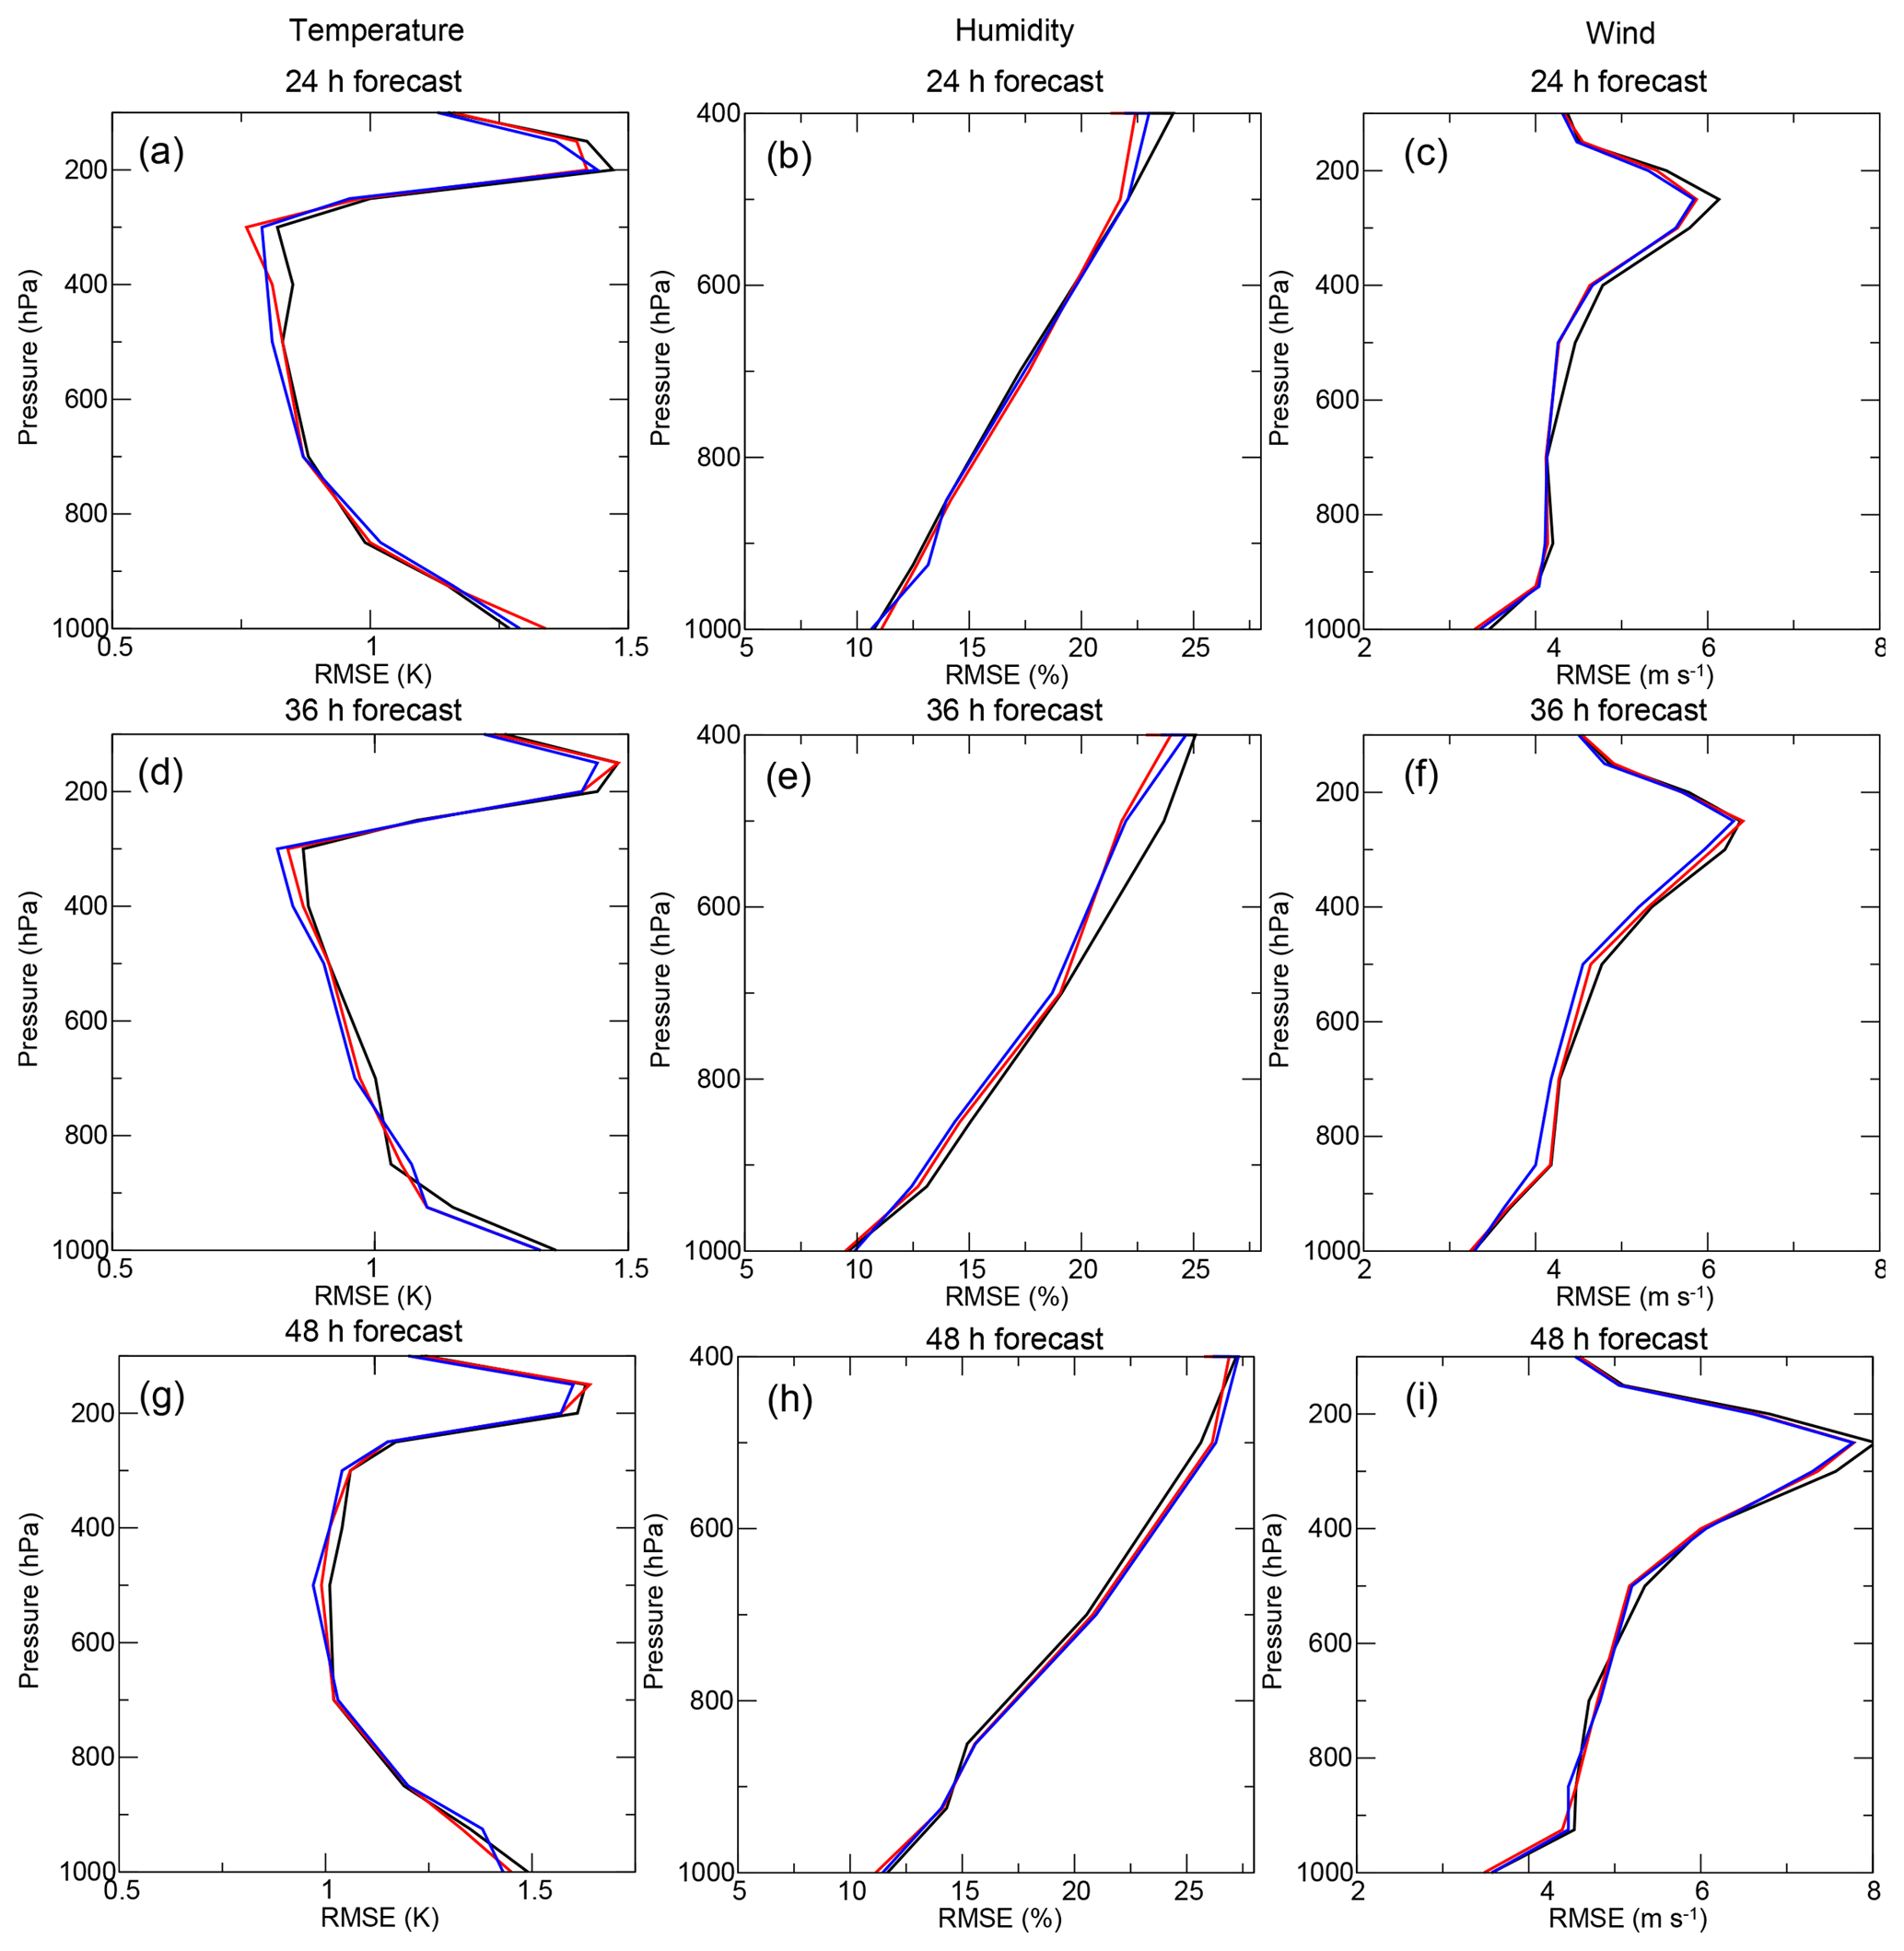
Figure 12RMS forecast error computed with respect to radiosondes for the 24 h forecast range (a–c), the 36 h forecast range (d–f), and the 48 h forecast range (g–i). Panels (a), (d), and (g) represent temperature, panels (b), (e), and (h) relative humidity, and wind is plotted in panels (c), (f), and (i). Scores were computed from 5 September 2012 to 5 November 2012 and are plotted in black for SOP1, in red for REANA1, and in blue for REANA2 from forecasts starting at 00:00 UTC.
4.3 Upper-level atmosphere–troposphere forecast
The forecast quality of the various AROME-WMED versions is first assessed against radiosonde observations. Figure 12 gathers the RMS differences between AROME-WMED forecasts and radiosondes for temperature, relative humidity, and wind at 24, 36, and 48 h ranges. Overall, the scores of forecast starting from reanalyses are improved compared to those starting from SOP1. REANA1 improves the temperature forecast above 500 hPa at 24 h and the wind is improved over the whole troposphere, but the maximum improvement is found above 700 hPa. The gain brought by this reanalysis is significant according to a bootstrap test at a 95 % confidence level between 500 and 250 hPa. The improvement at 400 hPa is also significant. At 36 h, the improvement brought by REANA2 with respect to SOP1 and REANA1 is noticeable all along the troposphere for temperature, humidity, and wind, except for temperature between 800 and 900 hPa and above 500 hPa for relative humidity, for which REANA1 provides an improved forecast. In addition, the REANA1 forecast is better than SOP1 but generally to a lesser extent than REANA2.
At the 48 h range, REANA1 and REANA2 improve the temperature forecast above 700 hPa; the humidity forecasts are not improved, but wind forecast is improved above 600 hPa. These results are statistically significant (95 % confidence bootstrap test) for temperature at 100 hPa. REANA2 brought only a significant improvement at 600 and 100 hPa, as well as near the surface for temperature.
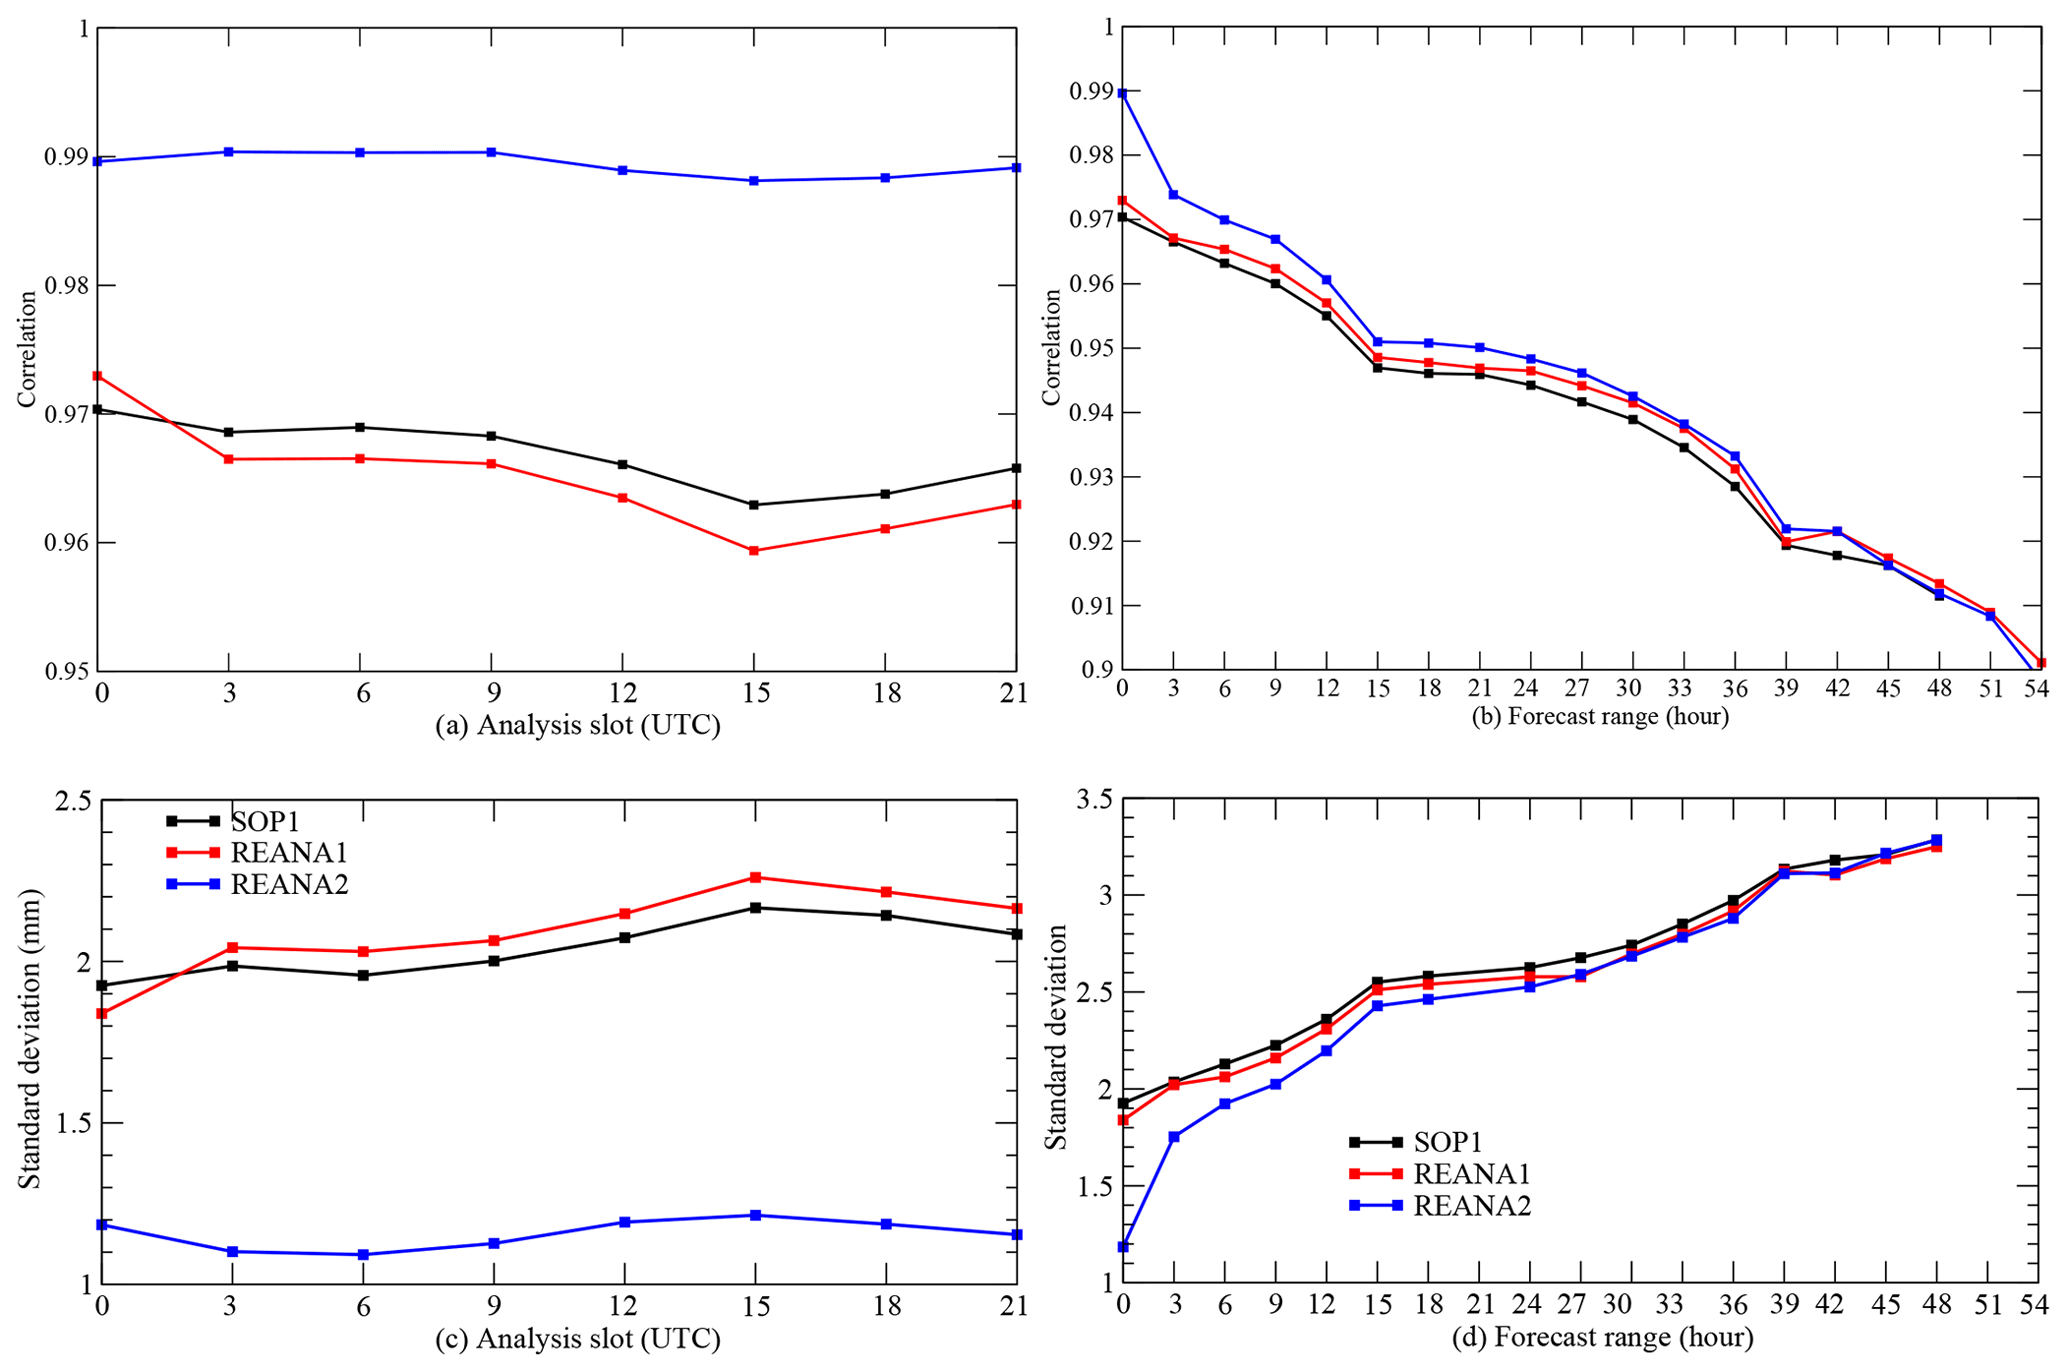
Figure 13Correlation (a, b) and standard deviations (c, d) of total integrated water vapor between AROME-WMED analyses (a, c) or forecasts (b, d) and GNSS observations (Bock et al., 2016).
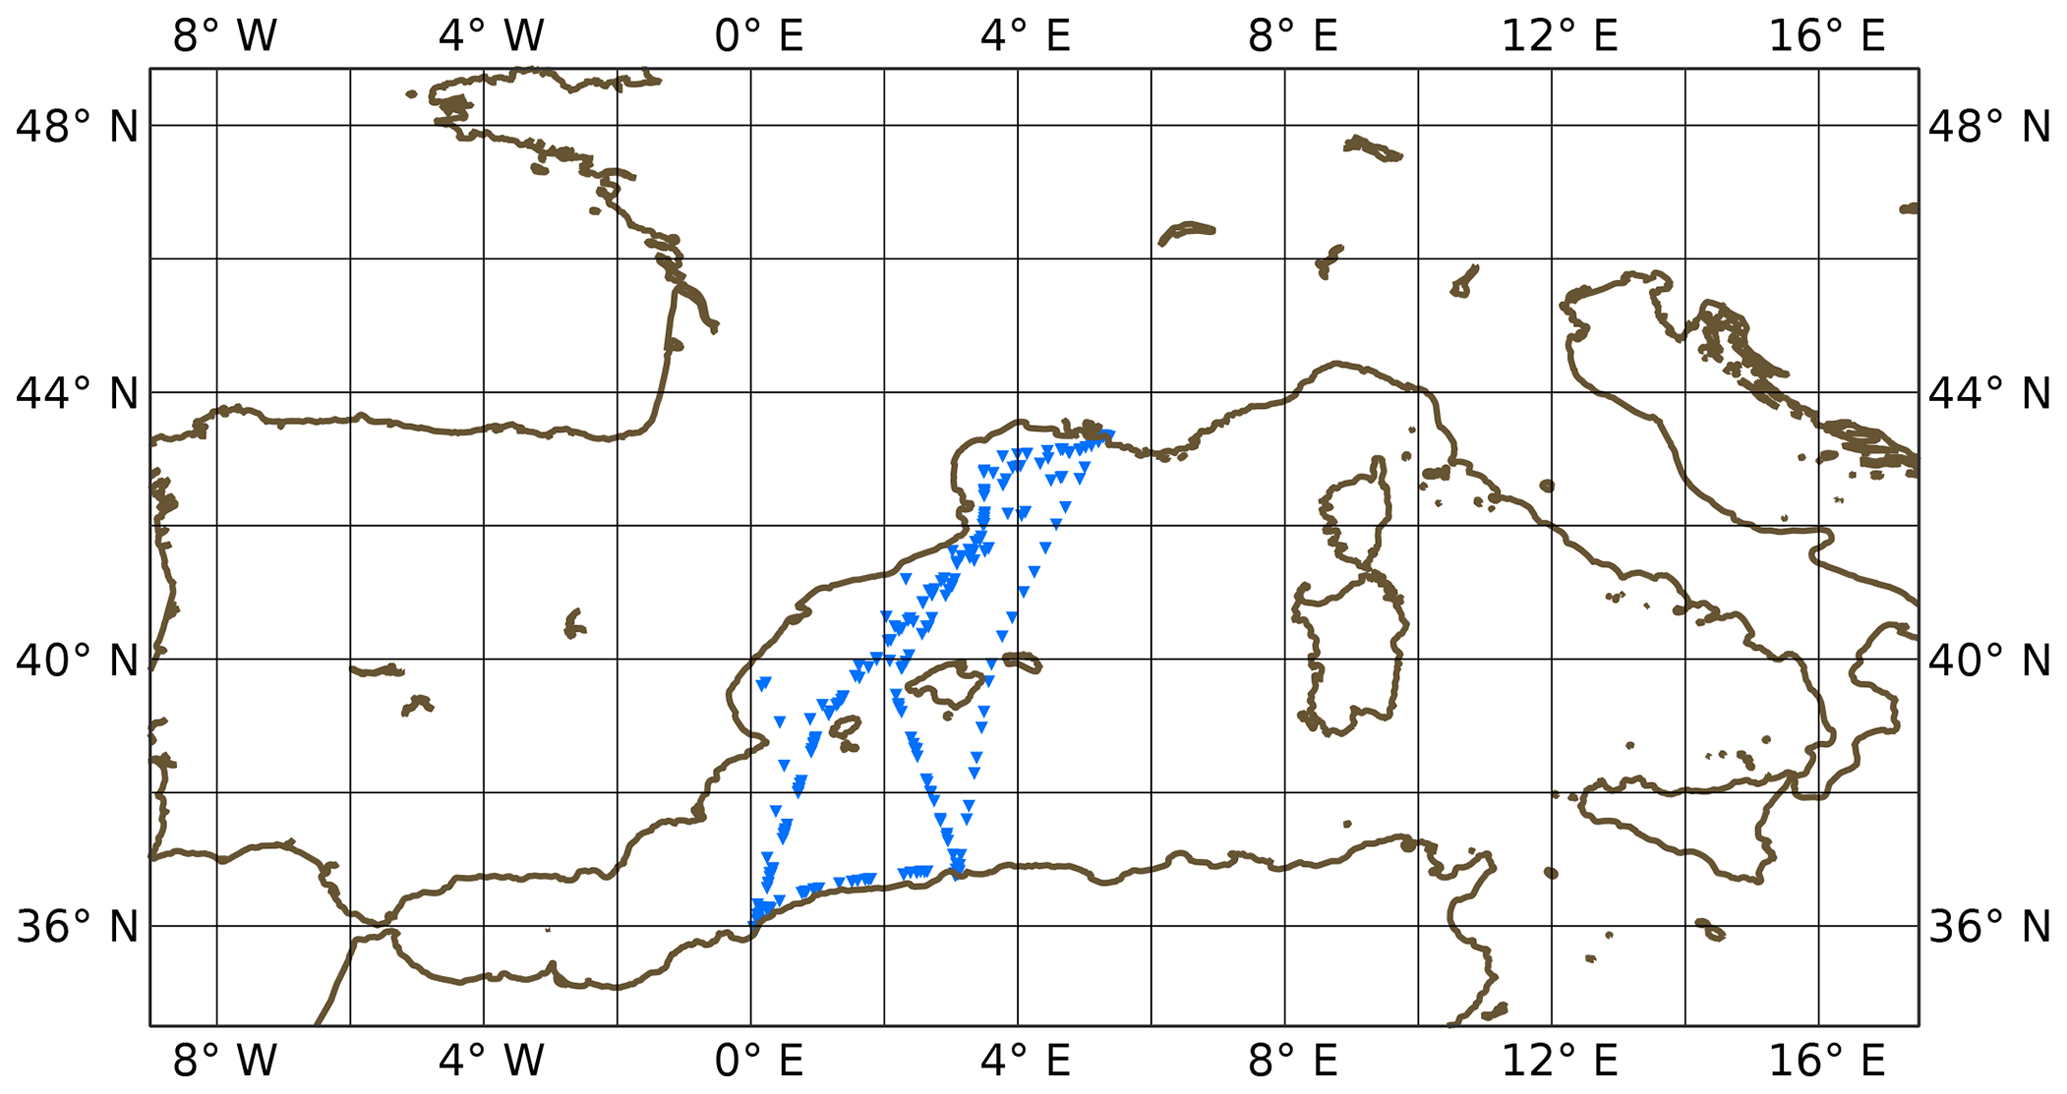
Figure 14Locations of the Marfret Niolon ZTD GNSS observations used for the comparison with AROME-WMED (re)analyses during the period from 9 September 2012 00:00 UTC to 1 November 2012 21:00 UTC.
4.4 IWV
The AROME-WMED model was also assessed using integrated water vapor (IWV) obtained from version 1 data of GNSS ground-based stations. IWV was indeed found to be linked to heavy precipitation, with a maximum observed before heavy precipitation events and a drop in its value occurring during the maximum of precipitation (Bock et al., 2016). Results are presented in Fig. 13. With these data assimilated in REANA2 (and not in SOP1 and REANA1), the highest correlation (0.99) is found for each slot of the eight times at which a REANA2 analysis was performed. More than 32 000 colocations were available to perform these computations. As expected, REANA1 and SOP1 correlations are lower (around 0.97); the maximum is observed for the 00:00 UTC analysis slot and the minimum is noticed in the afternoon at 15:00 UTC. The standard deviation of differences between IWV analyses and observations is lower (between 1.1 and 1.2 mm) for REANA2 than for SOP1 and REANA1 (above 1.8 mm). The standard deviation is maximum at the 15:00 UTC analysis slot (above 2 mm).
Concerning the forecast quality, as expected the IWV correlation between forecasts and observations decreases as the forecast range increases (from 0.99 down to 0.9 at 54 h). The largest score decrease is noticed in the very short forecast ranges. A diurnal cycle of the score is also found (local minima at +15 and +39 h ranges); REANA1 is characterized by a slightly higher correlation than SOP1, and the gain of REANA2 against REANA1–SOP1 is noticeable up to 24 h. The same conclusions apply for the standard deviation.
These results are confirmed over the sea with the validation against GNSS ZTD data (Fig. 15), derived from a GNSS sensor onboard the Marfret Niolon (Fig. 14). These data, which were not assimilated, represent an interesting independent source of validation. This dataset is made up of 418 measurements collected during the period from 9 September 2012 00:00 UTC to 1 November 2012 21:00 UTC and mainly in the western Mediterranean part of the AROME-WMED domain. Due to the small amount of data available, results are noisy. Nevertheless, it is noteworthy that the correlation between forecasts and observations is higher up to the 24 h forecast range; the standard deviation is lower up to the 24 h forecast range for REANA2 compared to SOP1 and REANA1. For the three simulations, there is a diurnal cycle of the ZTD bias. A stronger positive (moist) bias can be seen for the early forecast ranges of REANA2. At longer ranges the bias is more or less similar in the three simulations.
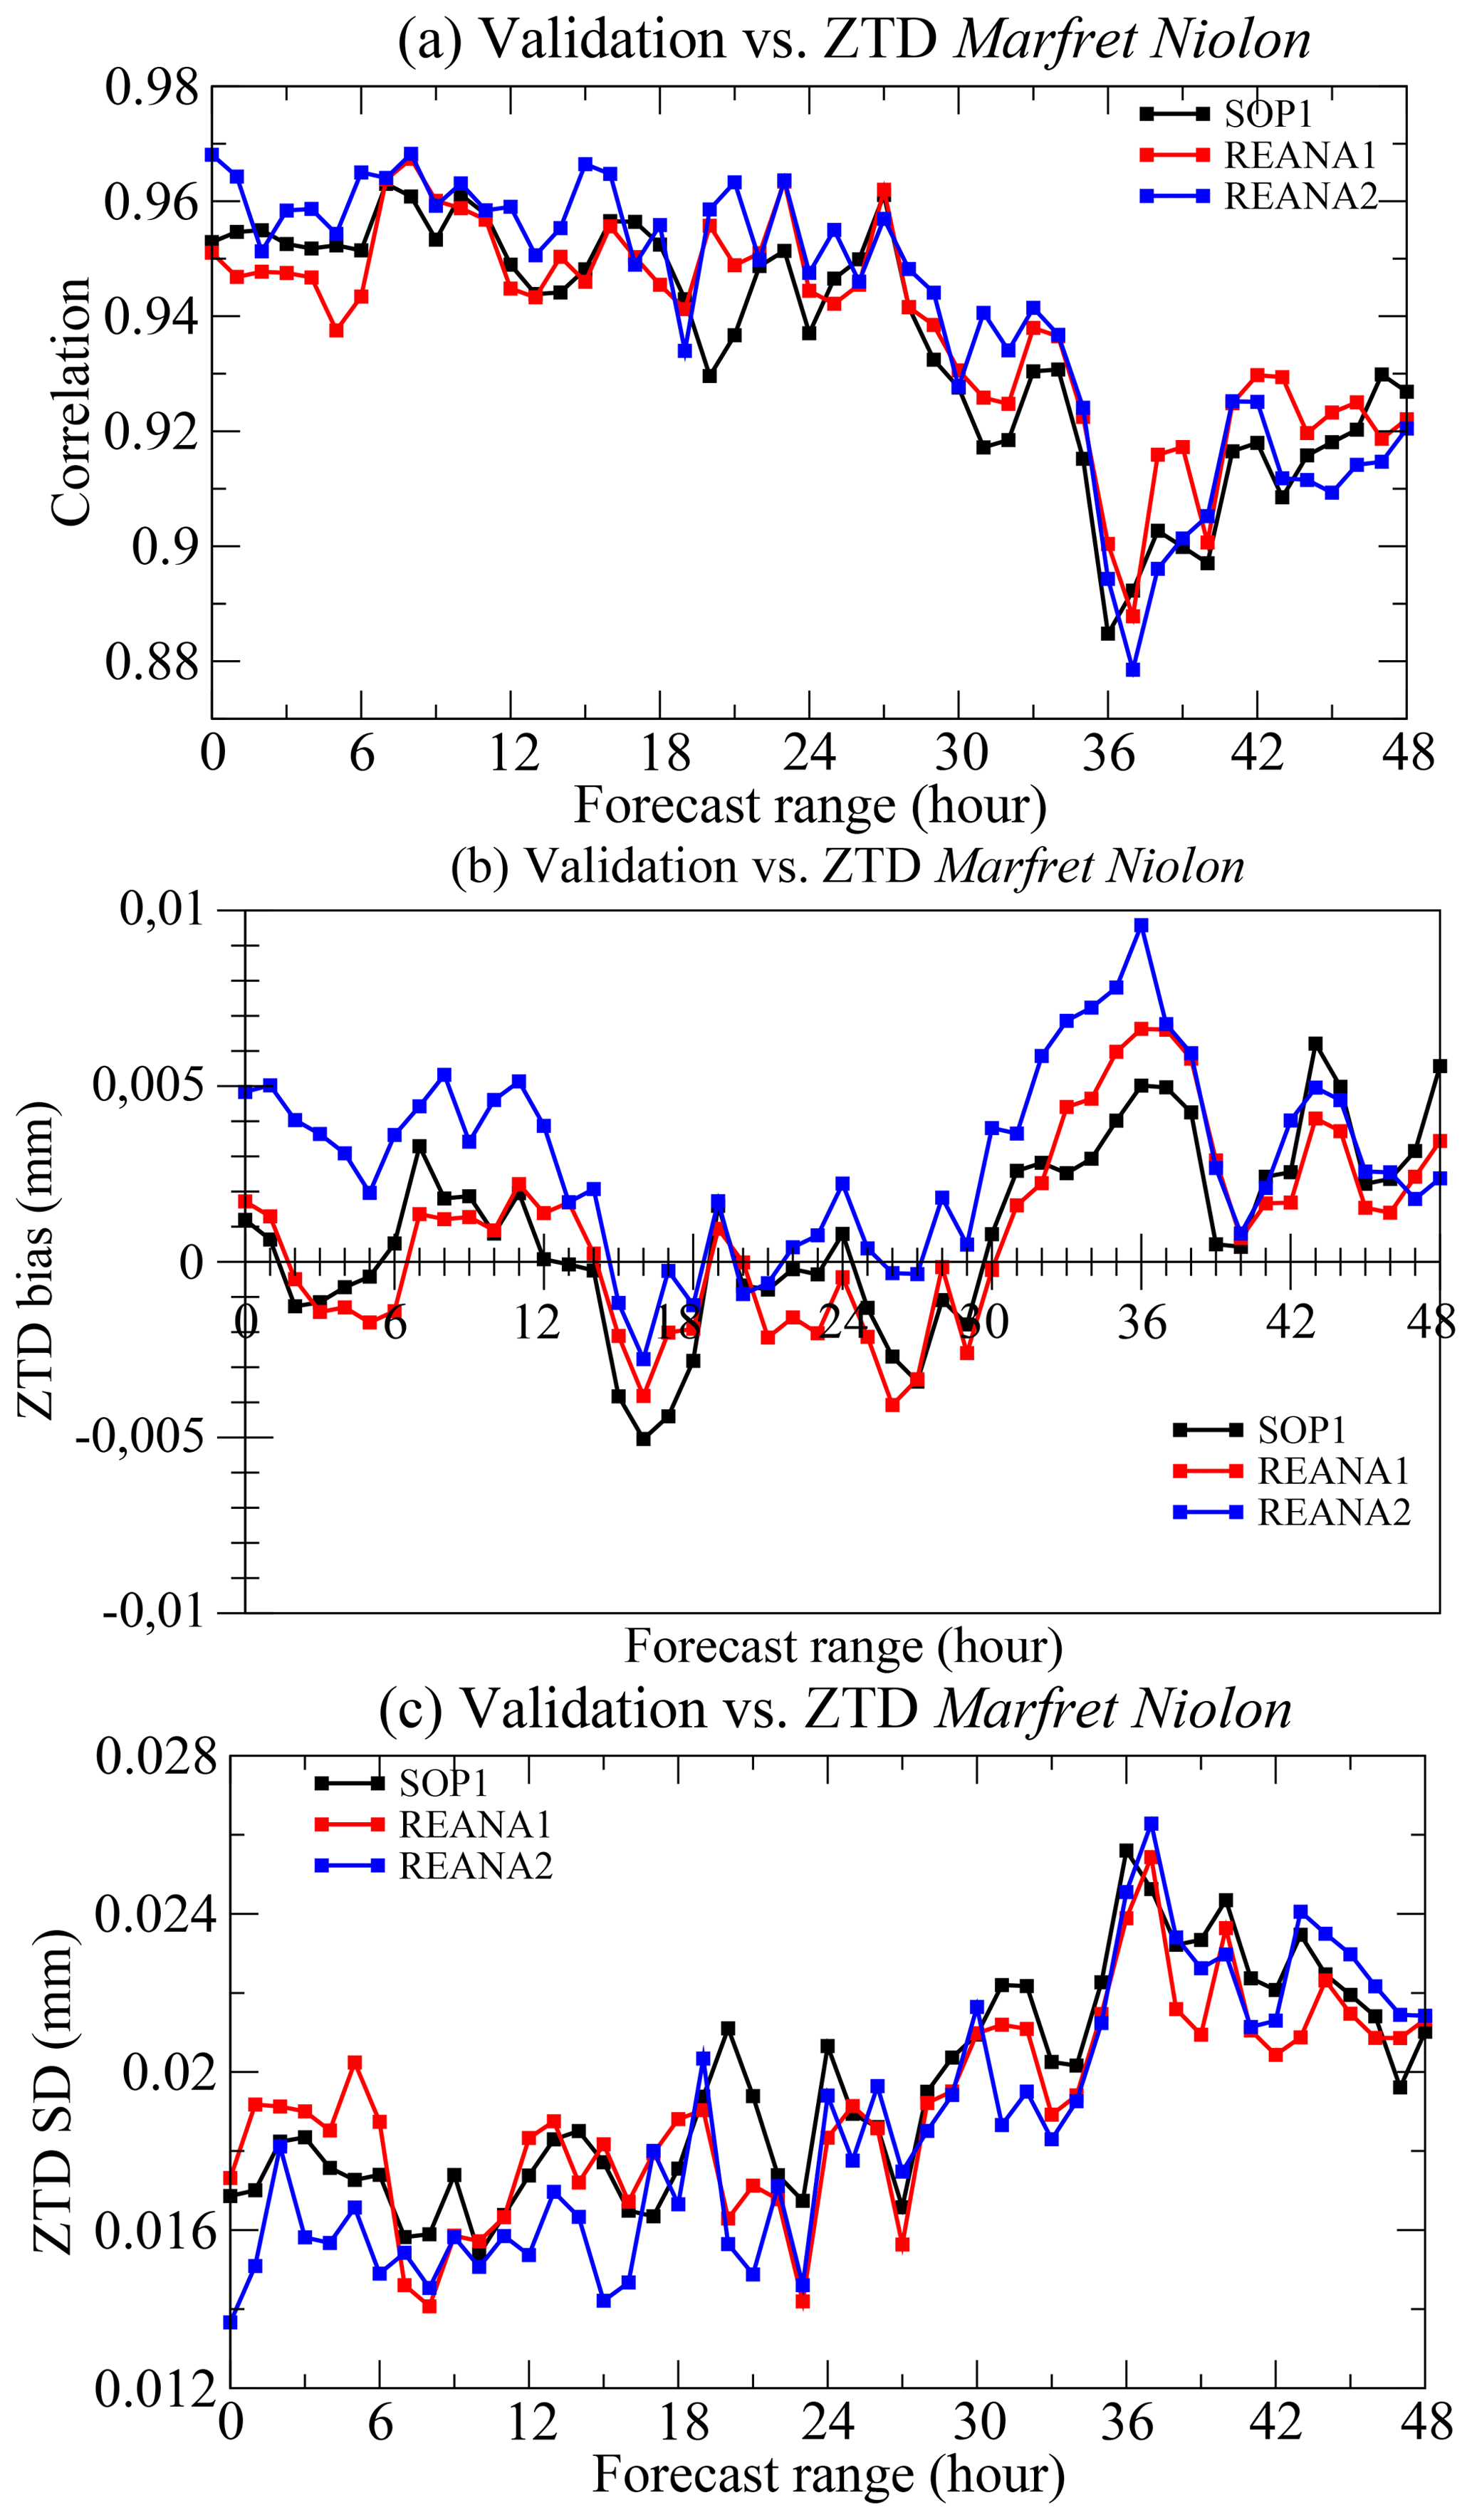
Figure 15Verification with respect to GNSS zenithal total delay data from the Marfret Niolon as a function of the forecast range. Statistics of differences between reanalysis forecasts and observations are displayed in terms of correlation (a), mean (b), and standard deviations (c) computed with all data available during the HyMeX 2-month period.
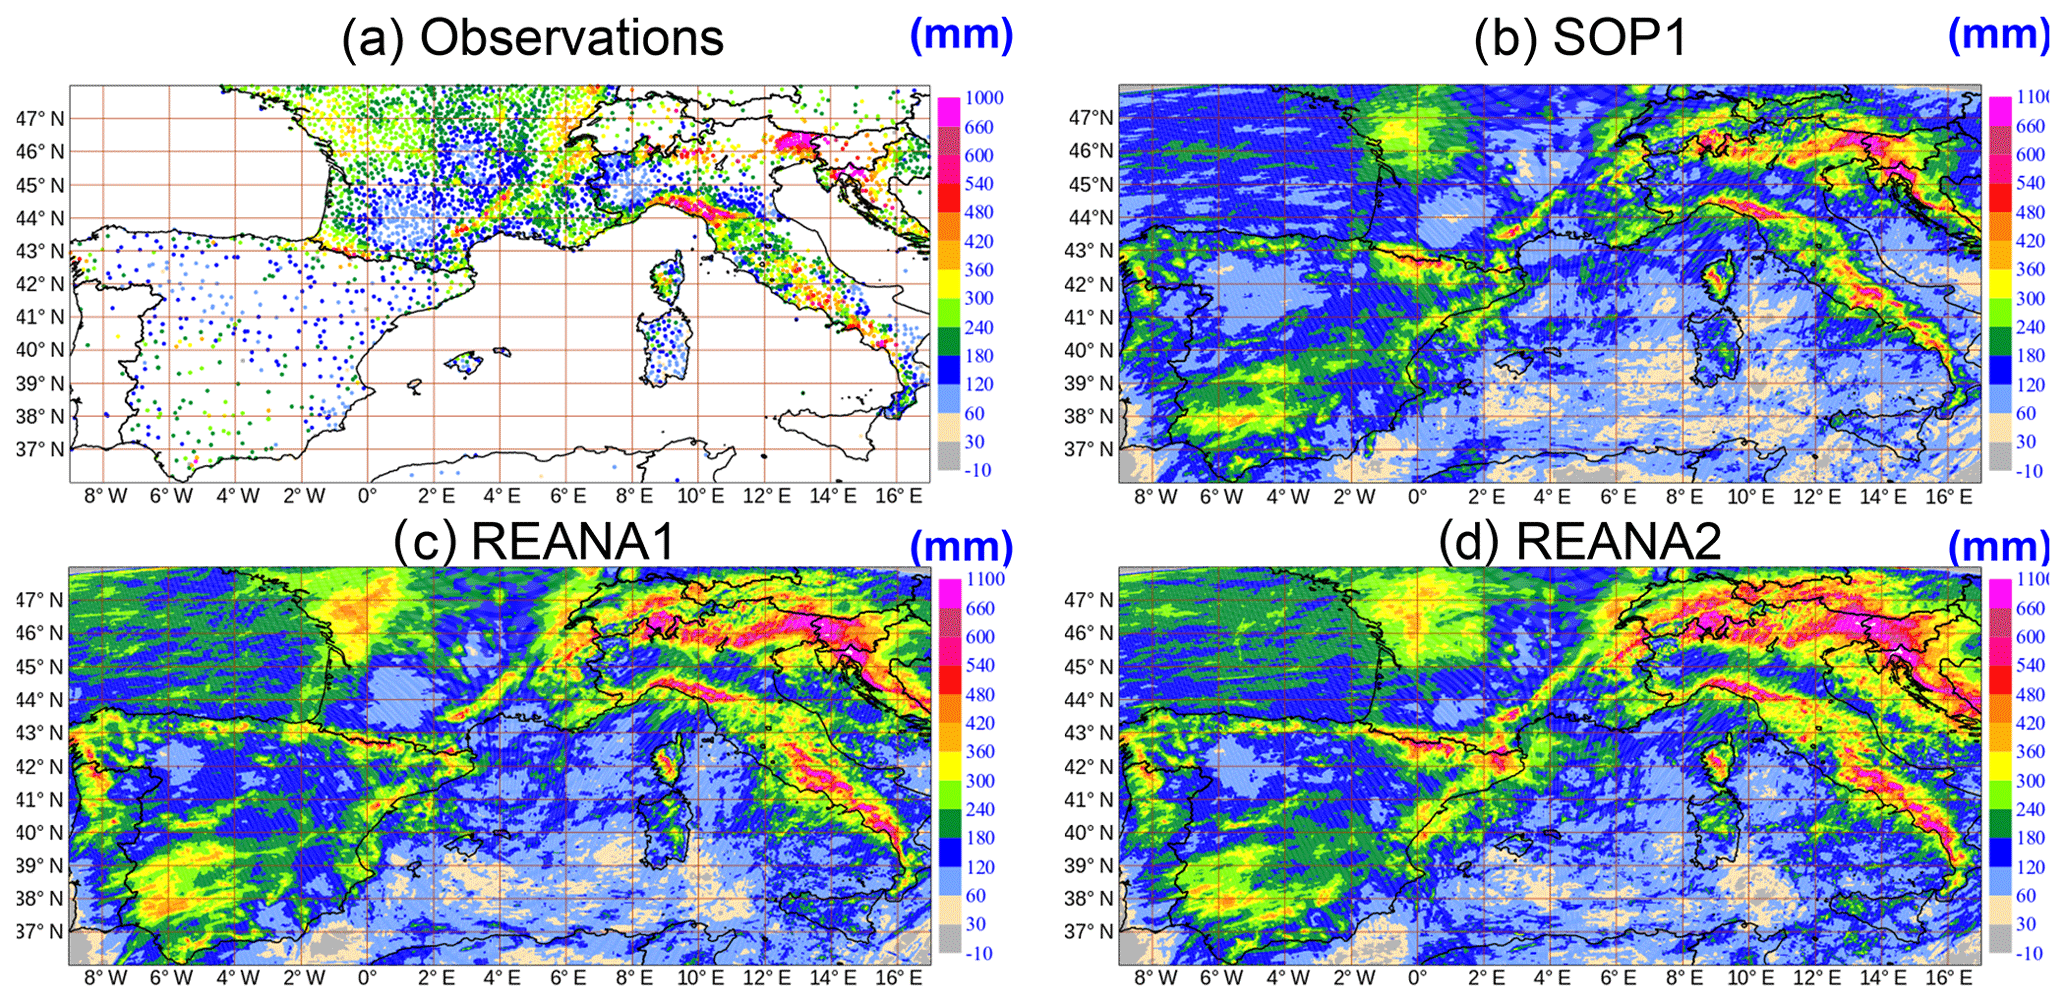
Figure 16Precipitation amounts (mm) over a 2-month period from 5 September 2012 06:00 UTC to 5 November 2012 06:00 UTC, measured by surface stations. Accumulation for 24 h from 06:00 to 06:00 the next day (a) predicted by SOP1 (b), REANA1 (c), and REANA2 (d).
4.5 Surface precipitation
The evaluation is carried out with 24 h accumulated precipitation (from 5 September to 5 November 2012) from the HyMeX database available in July 2017 (version 4). These data were checked before computing scores. Only surface stations with daily precipitation for the full period (i.e., with an uninterrupted series) were taken into account. Good coverage is obtained over France, Italy, and Spain (Fig. 16). REANA2 seems to yield more precipitation compared to the other versions, especially over elevated terrain. This is confirmed with the frequency bias computed against rain gauges over the whole AROME-WMED domain (Fig. 17). This bias is improved for small thresholds (<1 mm (24 h)−1) in REANA2 and these results are statistically significant. The degradation for thresholds exceeding 1 mm (24 h)−1 in REANA2 is not significant according to a bootstrap test due to the lower number of observations. Even though the general precipitation pattern is similar in the three versions, some differences can be noticed. For example, the maximum precipitation over Sardinia is not located at the same place. In REANA2 this local maximum is located in the central part of the island, whereas in REANA1 it is located over the eastern part. In addition, more precipitation is simulated over the sea in the Gulf of Lion for REANA2. The 2-month period accumulated rainfall amount shows some moister bias for REANA2 compared to REANA1 (not shown) and SOP1, mainly over elevated terrain (Pyrenees, Alps, Sierra Nevada in Spain); some negative difference is found over central Italy and elsewhere (figure not shown).
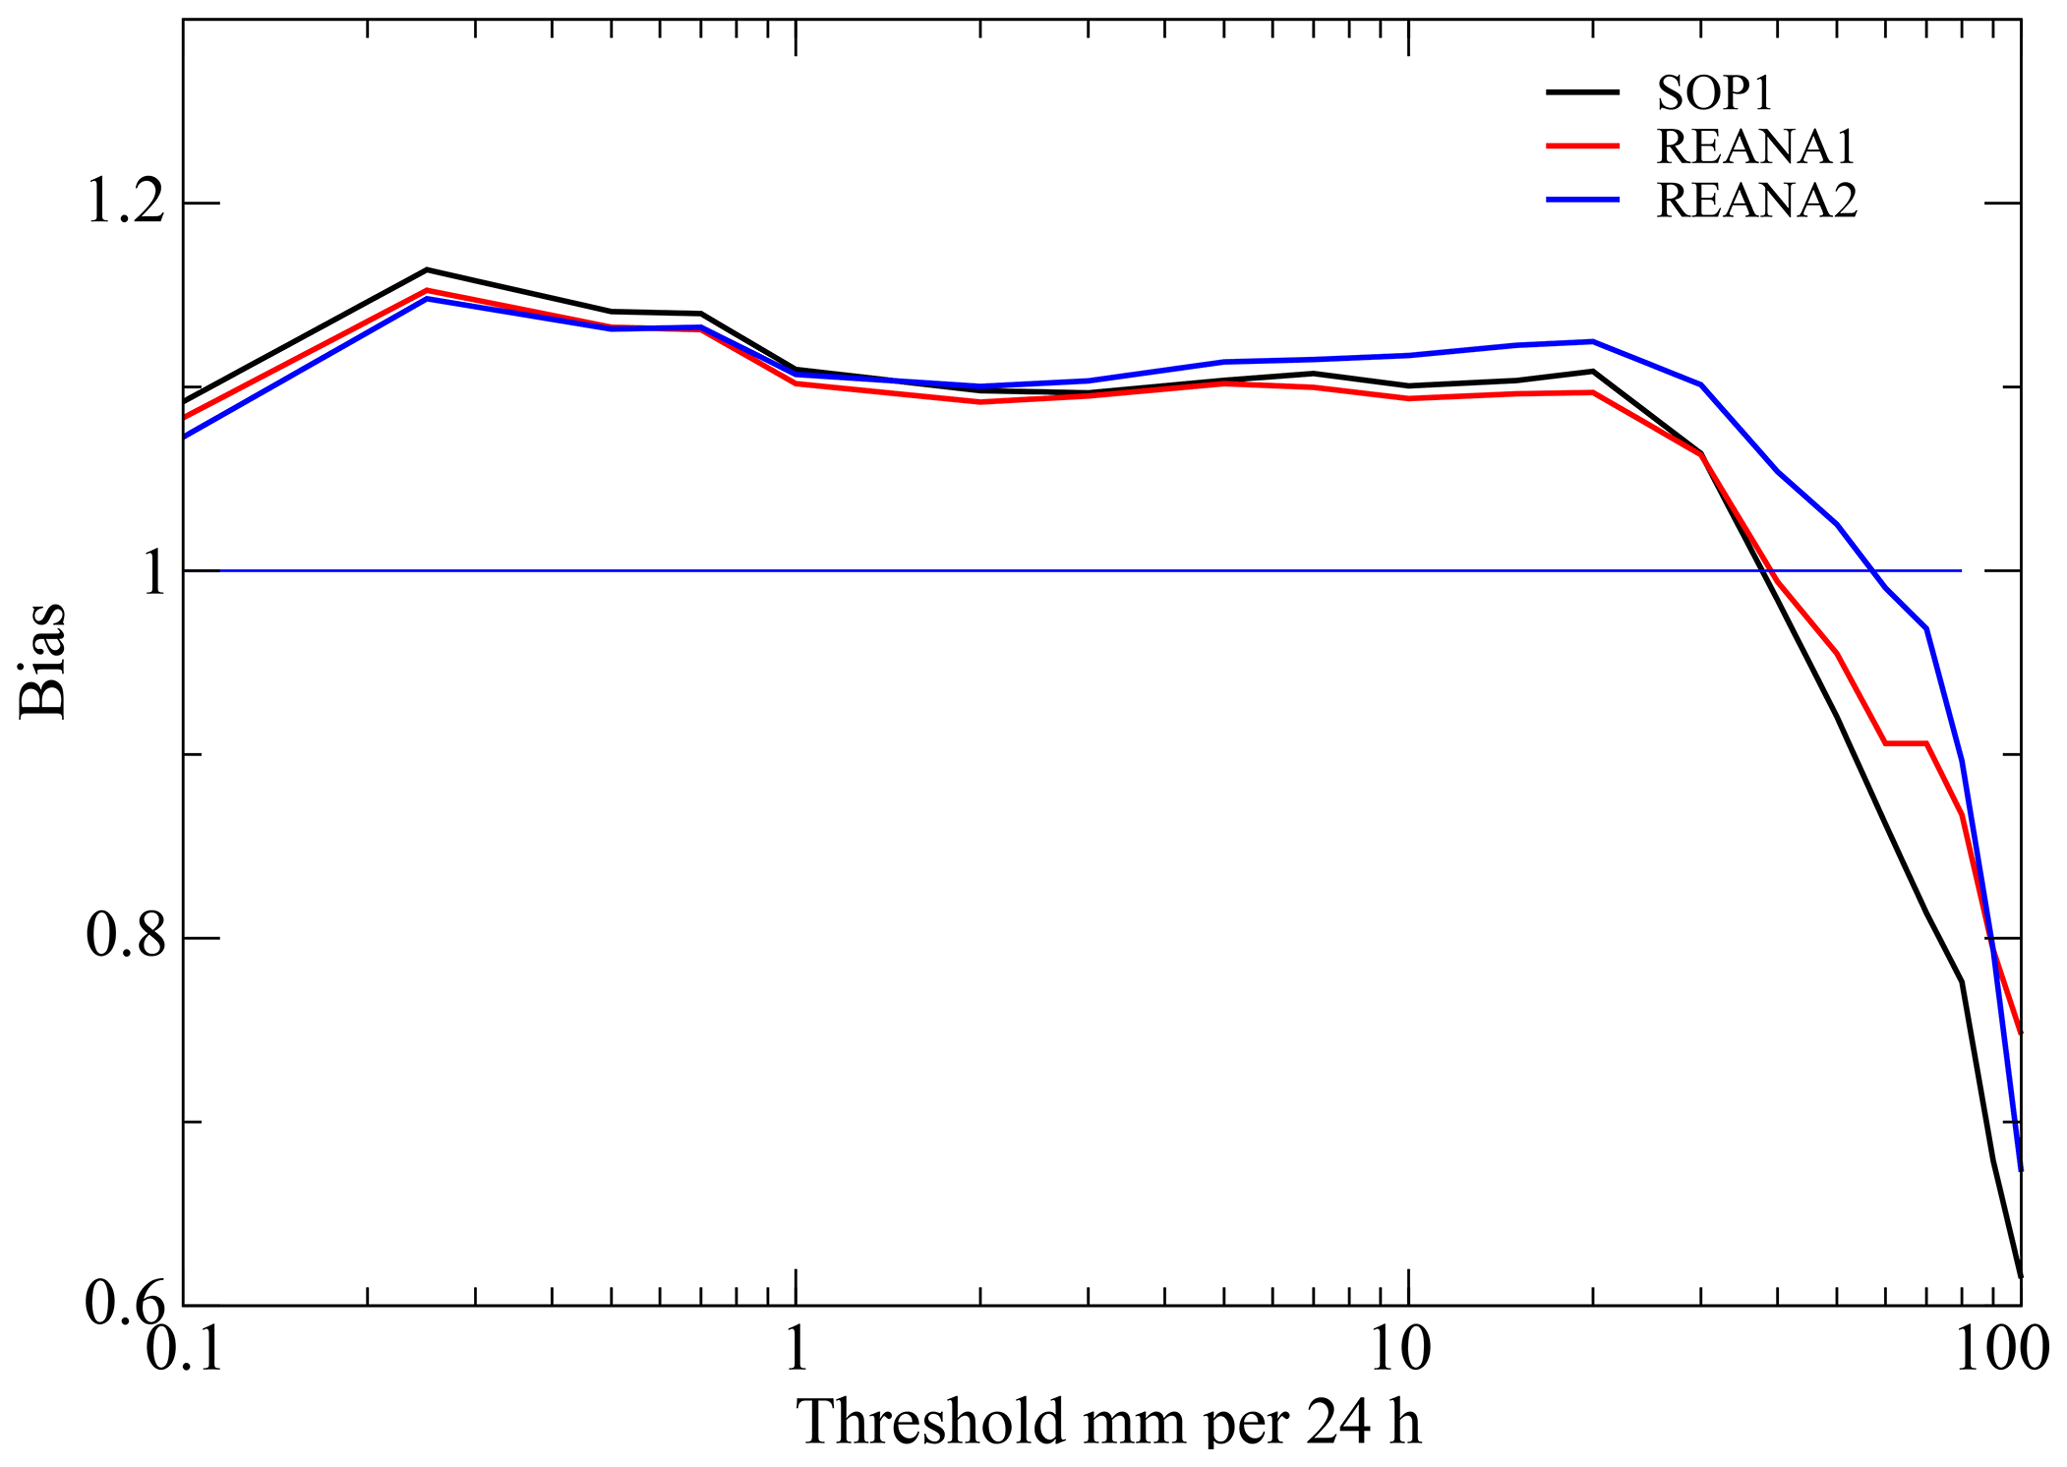
Figure 17Bias of the 6–30 h accumulated precipitation simulated real-time version, REANA1, and REANA2 computed over the AROME-WMED domain with rain gauges for the 2-month period during the HyMeX campaign. Logarithm scale on the x axis.
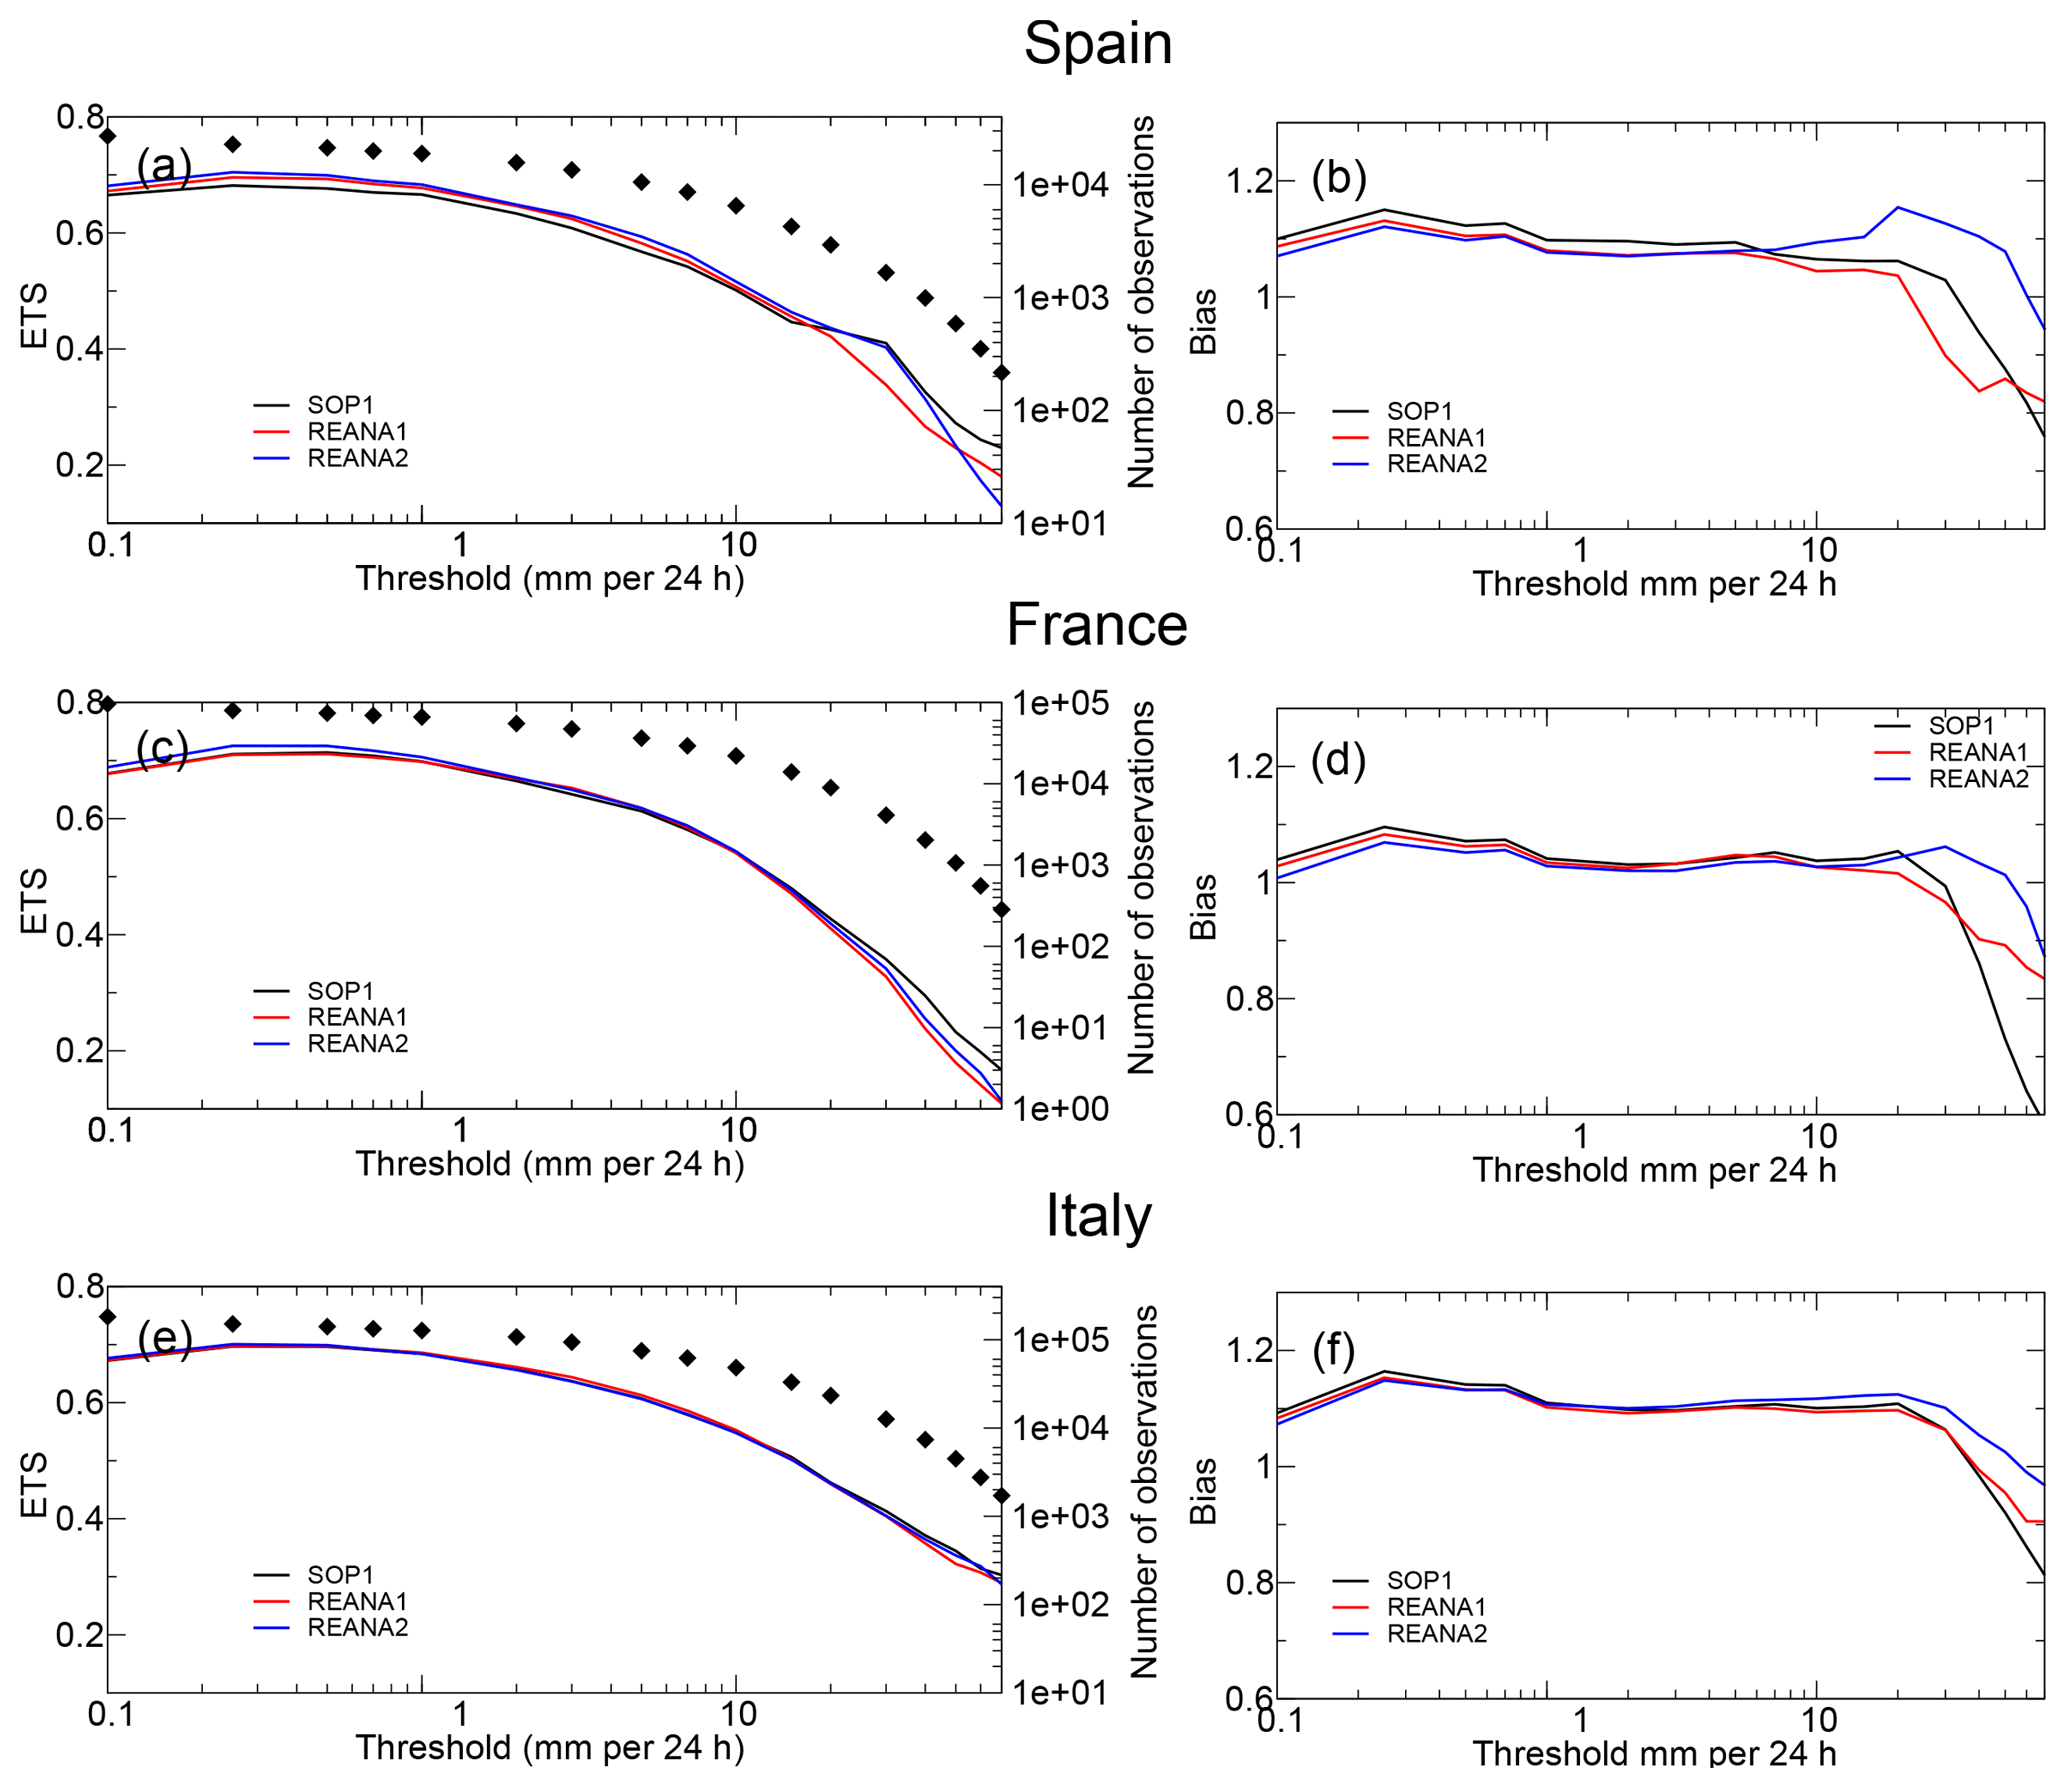
Figure 18Equitable threat score (a, c, e) and bias (b, d, f) of the 6–30 h accumulated precipitation simulated by the AROME-WMED real-time version, REANA1, and REANA2 computed over Spain (a, b), France (c, d), and Italy (e, f) with rain gauges for the 2-month period during the HyMex campaign. Logarithm scale on the x axis. Diamonds represent the number of observations used for the comparison (logarithm scale).
Figure 18 shows the equitable threat score (ETS; the definition is given in the Appendix of Ebert, 2008) and the frequency bias for the 24 h accumulated precipitation computed with all data available in version 4 for Spain, France, and Italy. The closer to 1 the ETS is, the better the forecast. Over Spain, the ETS is improved for both reanalyses and the gain is seen up to the 20 mm (24 h)−1 threshold. The ETS values for small thresholds are improved with REANA2 (up to 1 mm (24 h)−1) over France, but no improvement is seen over Italy. In the reanalyses, the frequency bias decreases up to the 5 mm (24 h)−1 threshold over Spain and France and only for small thresholds (less than 1 mm (24 h)−1) over Italy. For large thresholds, the frequency bias is larger for REANA2 than for the other two AROME-WMED versions. These results are in agreement with the overall accumulation of precipitation found in Fig. 16.
As illustrated in the section on quantitative forecast evaluation, tiny improvements are noticed for REANA2 with respect to previous simulations for quantitative precipitation forecasts (QPFs). Such improvements in REANA2 can be found for specific periods of the HyMeX campaign. This is the case for IOP8, which took place during 2 d from 28 to 29 September 2012. The key pattern of this IOP was a cutoff low centered to the southwest of the Iberian Peninsula (28 September 00:00 UTC) moving northeast and located over the Alboran Channel (29 September 00:00 UTC). A detailed description of the early stages of the IOP8 synoptic meteorological environment can be found in Bouin et al. (2017). Figure 19 depicts the large-scale synoptic conditions on 29 September 2012 at 00:00 UTC.
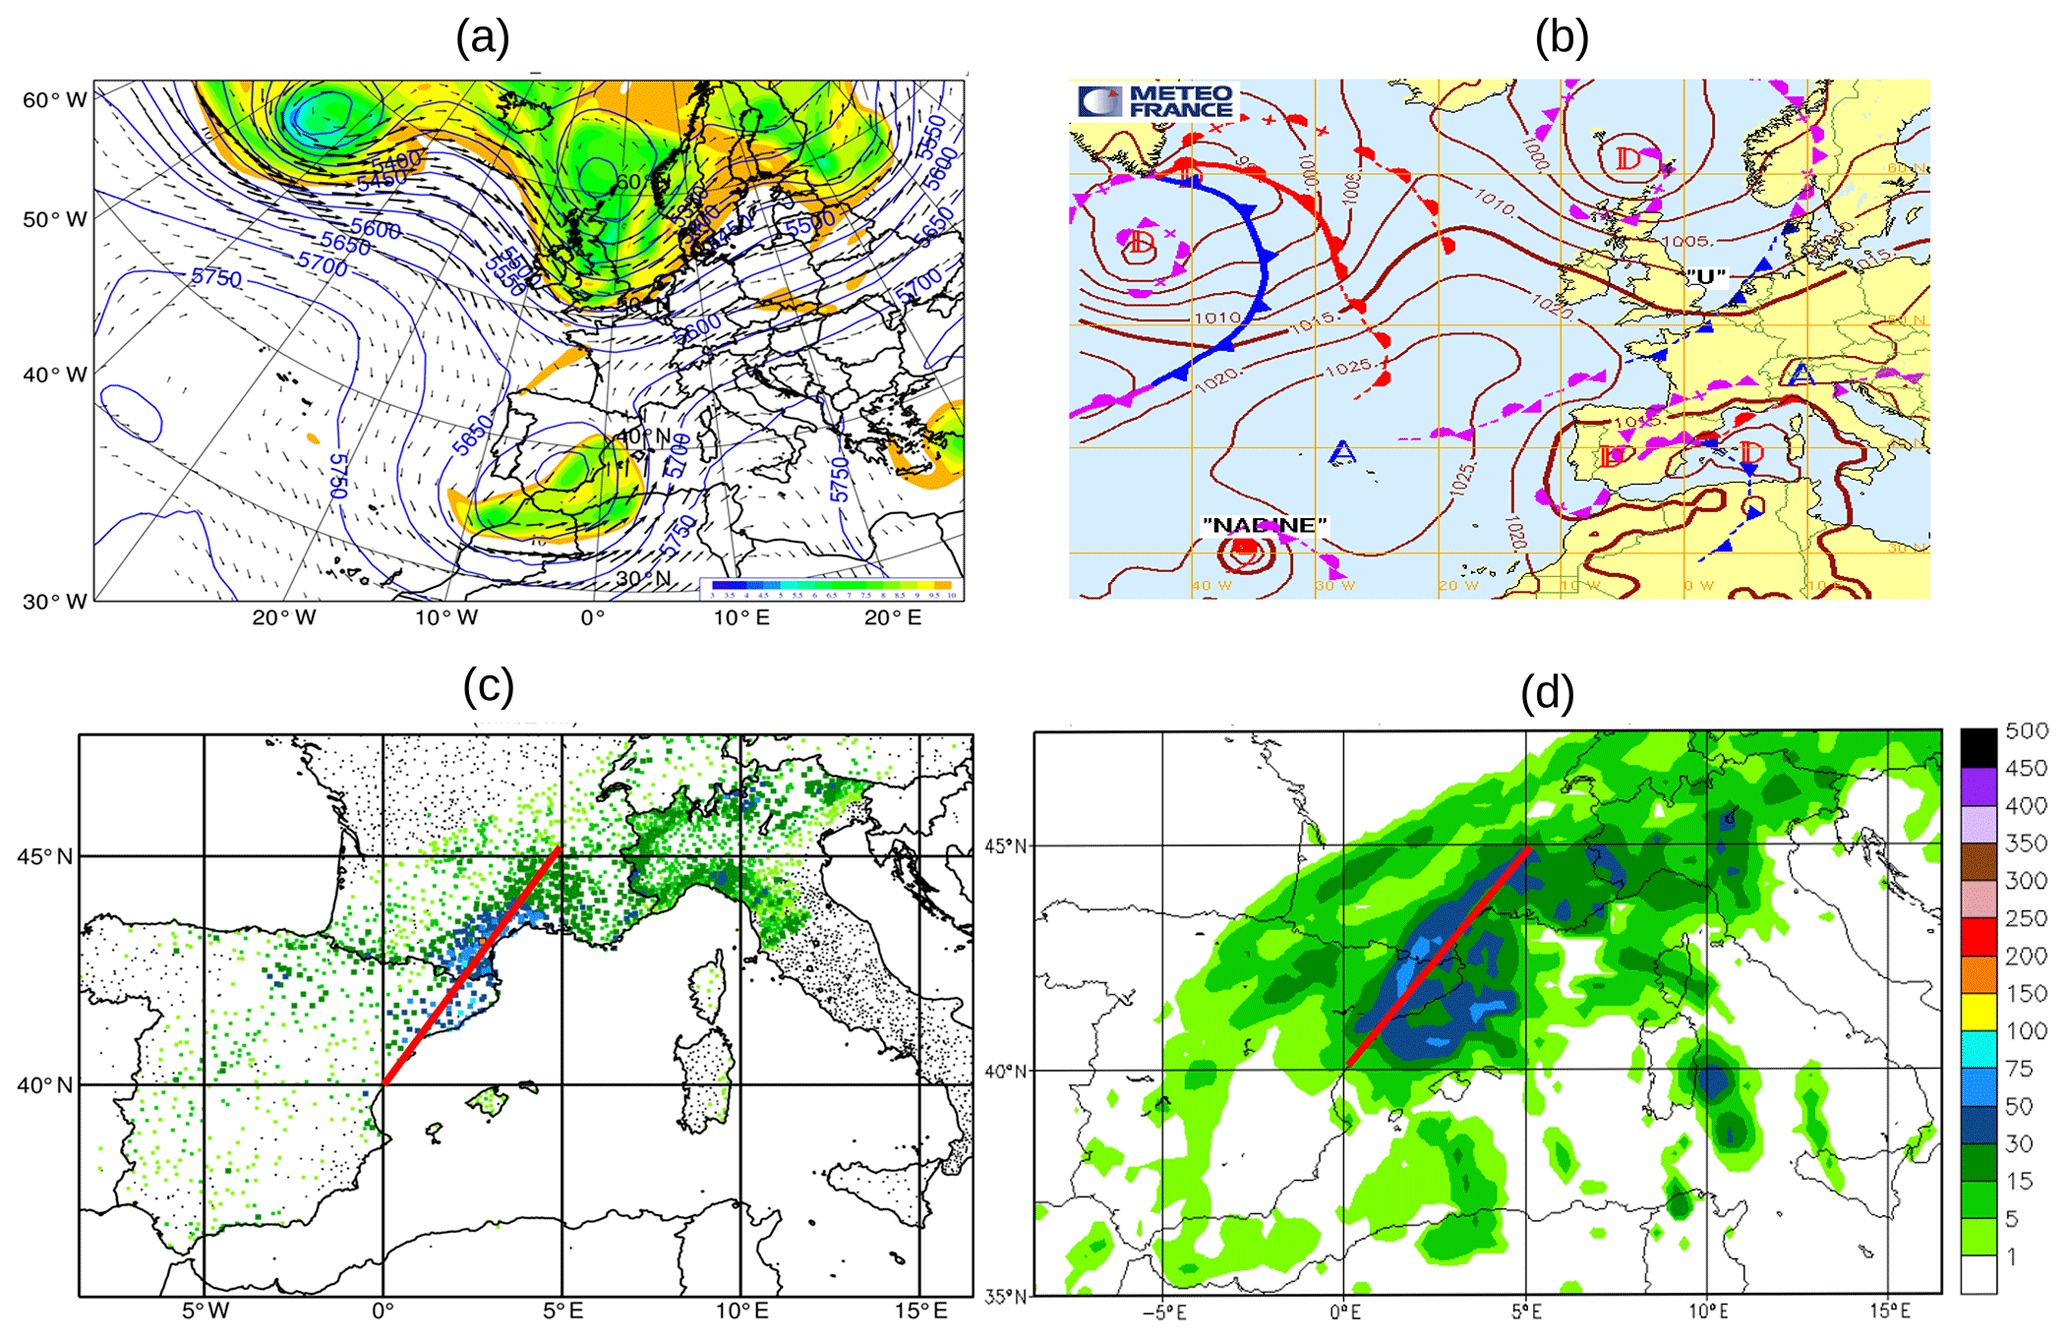
Figure 19(a) The 300 hPa wind (arrow), 1.5 PVU (potential vorticity unit) surface height (color), 500 hPa geopotential height (solid lines), and (b) surface synoptic conditions for 29 September 2012 00:00 UTC. The 29 September (c) daily observed precipitation and (d) 3B42 TRMM daily precipitation estimate.
At low levels, on 29 September at 00:00 UTC, a weak complex surface low was positioned over the Gulf of Lion, associated with the cutoff low as analyzed by the global-scale model ARPEGE. This cutoff drove a moist southeasterly flow on its northeastern flank, towards the French Mediterranean coast, reinforced by orography (Cevennes ridge, which induced a barrier effect as shown in Buzzi et al., 2003). On 29 September, this pressure minimum triggered heavy rainfall with embedded convection over the Gulf of Lion (morning) and later on over the northern part of Catalonia and the western part of Cévennes–Vivarais. Daily precipitation amounts reaching 100 mm (24 h)−1 were recorded on the coastal zones along an axis from northern Catalonia to the Cevennes area, depicted by the red line extending from 40∘ N–0∘ E to 45∘ N–5∘ E in Fig. 19c. Such an amount of rainfall was also observed in the northeastern part of the Gulf of Lion from the 3B42 TRMM (Tropical Rainfall Measuring Mission) estimates (Fig. 19d), which compare well qualitatively and quantitatively with in situ measurements over land.
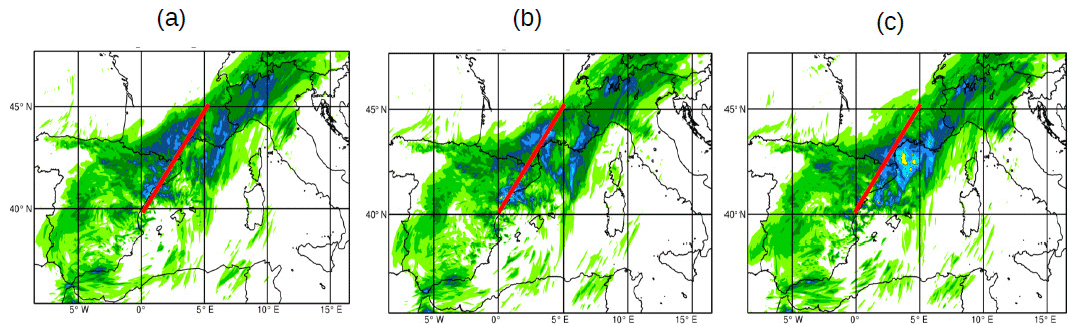
Figure 20Daily precipitation amounts for 29 September 2012 simulated by the three different AROME-WMED versions: (a) SOP1, (b) REANA1, and (c) REANA2.
The daily accumulated precipitation amounts for the real-time and first reanalysis exceeding 50 mm d−1 are shifted too far westward when compared to rain gauges (Fig. 20a and b). The maximum rainfall amount located over the Gulf of Lion is better localized, though overestimated, in the second reanalysis (Fig. 20c). The ETS was computed for the various forecasts (0–24, and 24–48 h range) valid for 29 September (00:00–24:00 UTC period). The score was also computed for the 6–30 h forecast range (corresponding to the 24 h period between 29 September 06:00 UTC and 30 September 06:00 UTC). Figure 21 presents these ETS curves; one can see that generally the reanalyses (1 or 2) perform better than the real-time version of AROME-WMED; surprisingly the ETS scores are better for the 24–48 h forecast range than for the shorter (0–24 h) forecast period. This degradation of the short-range forecast could originate from a spin-up present in the very short ranges of the forecast that degrades the predicted precipitation during the first hours of the forecast.
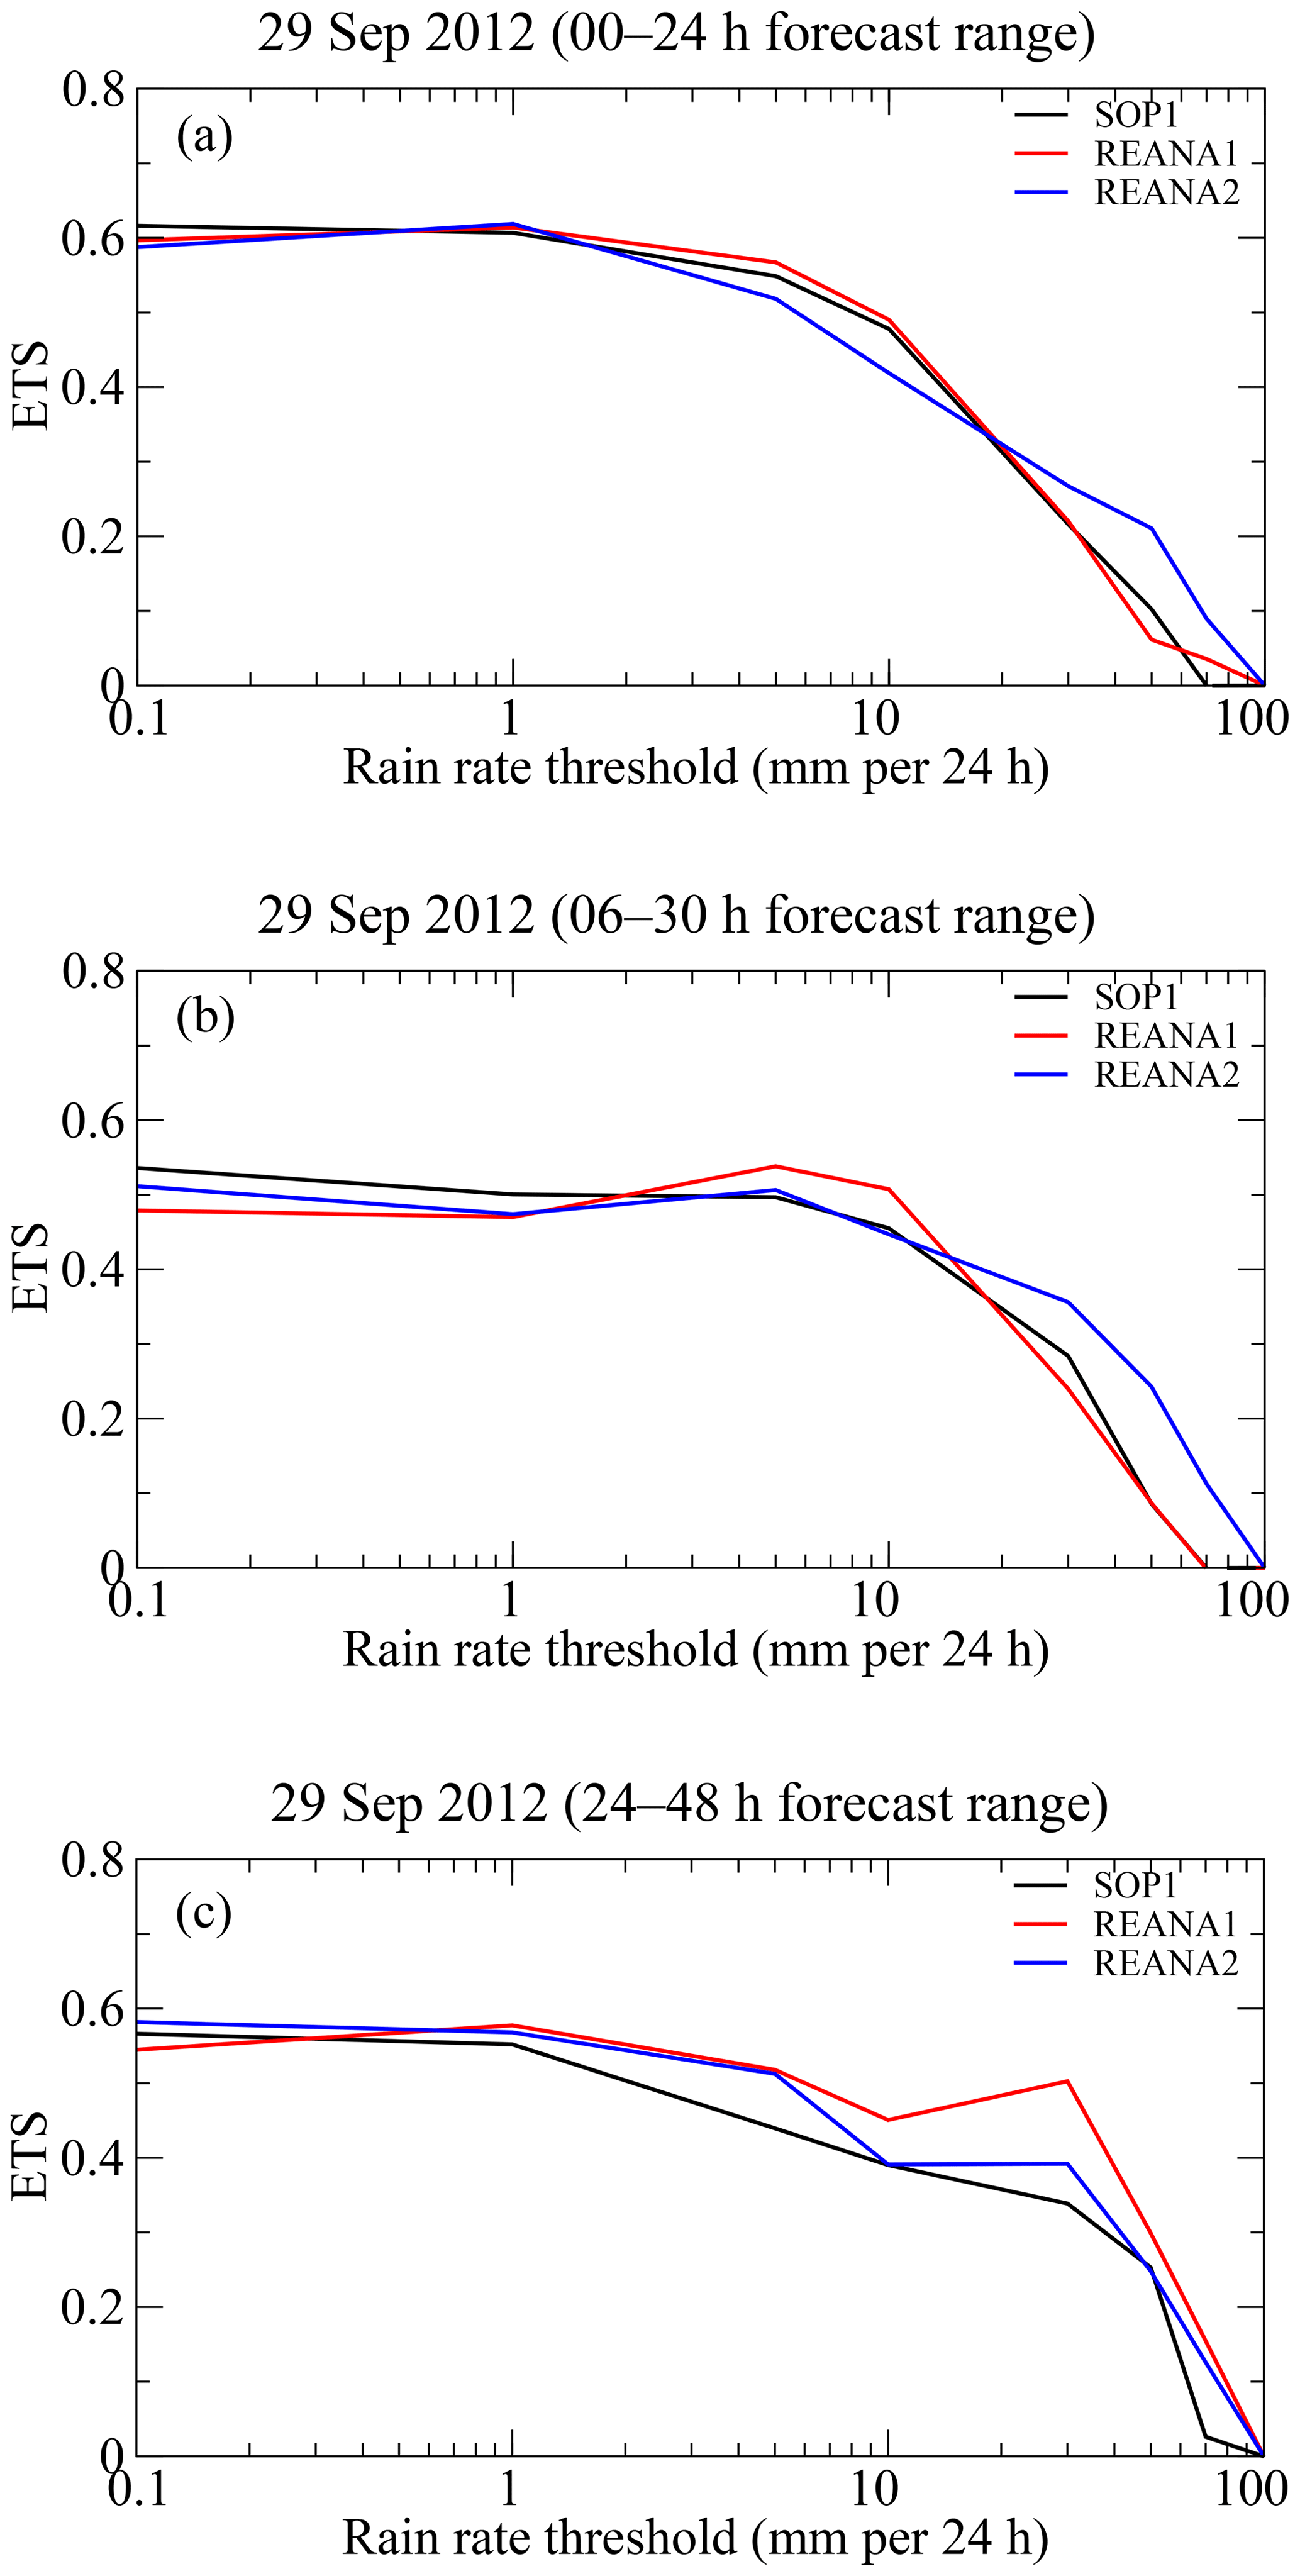
Figure 21ETS scores valid for 29 September 2012 for simulated precipitation accumulated between 0 and 24 h (a), 6 and 30 h (b), and 24 and 48 h (c) forecast ranges; initial conditions of 29 September 2012 00:00 UTC for panels (a) and (b), 28 September 2012 00:00 UTC for panel (c).
The positive impact in QPF may be linked to the better simulation of the deepening of the surface pressure low in the second reanalysis for the morning of 29 September located in the Gulf of Lion. At the Lion buoy (42.102∘ N, 4.703∘ E), the minimum surface pressure observed on 29 September is 1008 hPa at 14:00 UTC; the minimum surface pressure predicted by the 00:00 UTC forecast initialized with the first reanalysis is 1010 hPa at 03:00 UTC (not deep enough and too early), while the forecast simulation initialized at 00:00 UTC by the second reanalysis indicates a minimum of 1008 hPa at 09:00 UTC.
The AROME-WMED model was initially developed to study and forecast heavy-precipitating events over the western Mediterranean basin in the framework of the HyMeX program. This model ran in real time during both SOPs of HyMeX in autumn 2012 and winter 2013. Two reanalyses were run after the HyMeX autumn campaign. The first one was carried out just after the campaign to provide the same model configuration over the whole period because an upgrade of the AROME-WMED version occurred during the period. In addition, a second reanalysis was performed a few years after and took into account as many data as possible from the experimental campaign (i.e., lidar and dropsonde humidity profiles) or from reprocessed datasets (such as GNSS ground station ZTD, wind profilers, high-vertical-resolution radiosondes, and Spanish doppler radars). It also benefited from a more recent version of the AROME code, including an orography change, and from improved background error statistics computed over a 15 d period of the first HyMeX observing period. The analysis and forecast fields of these three AROME-WMED versions are available in the HyMeX database (http://mistrals.sedoo.fr/HyMeX/, last access: 3 July 2019).
The characteristics and the quality of the three AROME-WMED versions are discussed in this paper. More observations are assimilated in both reanalyses. The first reanalysis included 9 % additional data, and the second reanalysis assimilated 24 % more data. These data in the case of REANA2 mainly came from the GNSS ground stations, radiosondes, and satellite radiances. The use of background error statistics more representative of the studied period allows for better use of the observations in the second reanalysis. The root mean square differences between first-guess simulations and observations are the smallest for the second reanalysis. Depending on the change in the background statistics, the root mean square differences between analysis simulations and observations are adjusted. The observation departure study showed that the quality of research data, such as lidar data, is found to be comparable with the operational radiosonde data.
Concerning the forecast quality, the surface field forecast is better for the second reanalysis; the 2 m temperature diurnal bias is reduced up to the 54 h forecast range. The forecast error standard deviation is improved for the first 18 h forecast ranges. This improvement is mainly due to the change in the orography in REANA2. A reduction of the 2 m relative humidity bias is also found.
Upper-level forecasts of the three AROME-WMED versions were compared to radiosonde observations and the forecast root mean square errors for temperature, relative humidity, and wind are decreased in the middle and upper troposphere for both reanalyses up to the 48 h forecast range. The comparison with the reprocessed version 3 of GNSS data (Bock et al., 2016) shows that the second reanalysis IWV, in terms of analyses and forecasts, is better correlated than the first one and the real-time version up to the 24 h forecast range. The standard deviation of IWV differences is also lower. Moreover, a comparison to GNSS zenithal total delay independent data (i.e., not assimilated) from the vessel Marfret Niolon also shows this positive impact up to +24 h. This is an interesting result over a sensitive area where no conventional measurement is available.
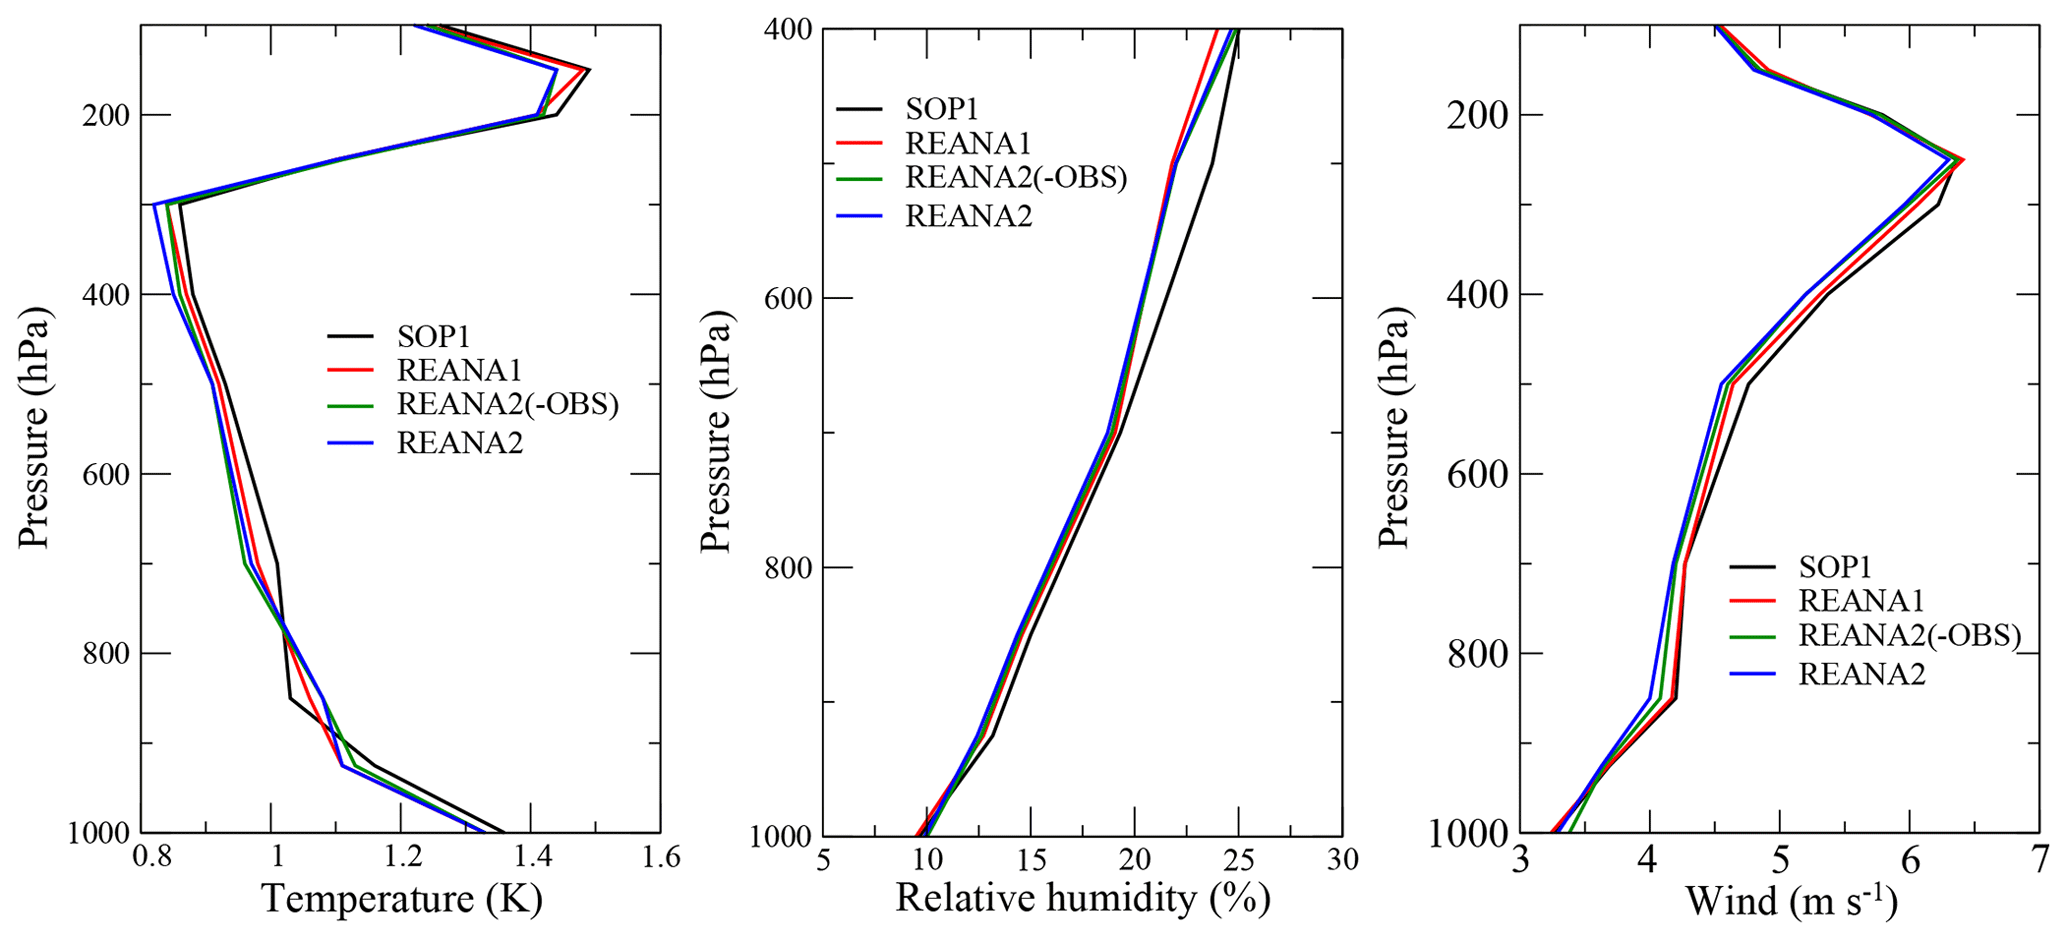
Figure 22Root mean square forecast errors with respect to radiosondes at the 36 h forecast range for temperature, humidity, and wind for real time (in black), REANA1 (in red), REANA2 (in blue), with an experiment demonstrating the change of the code version and the new background statistics: REANA2(-OBS), in green.
Larger values of accumulated precipitation during the 2-month period were obtained with the second reanalysis, and the comparison with observations suggests an overestimation of the large precipitation amount, mainly over relief. However, the frequency bias is decreased for smaller thresholds over the AROME-WMED domain. Concerning the 24 h precipitation evaluation, this positive impact is less noticeable, but at least some improvement is diagnosed for the Iberian Peninsula and France for thresholds lower than 10 mm (24 h)−1. The gain brought by the second reanalysis is smaller over Italy. Finally, the positive impact of the second AROME-WMED reanalysis was detailed for the IOP8 high-precipitating event that occurred over Spain and southern France at the end of September 2012.
Preliminary studies with data assimilation experiments with only the code version changes, including the new background statistics, have shown that the gain in forecast score brought by REANA2 is due to the new observations assimilated and the new code version. Figure 22 illustrates this fact for the 36 h forecast range. A small reduction of the root mean square error is obtained with the assimilation of new observations for temperature and wind in the troposphere. The improvement brought by the observations is less clear for humidity. Concerning the 24 h accumulated precipitation, REANA2 improves small thresholds (0.5, 1 mm (24 h)−1) compared to the preliminary experiment, REANA1, and SOP1. It is clear that the 2 m temperature and humidity forecast bias improvement is related to the orography change. The improvement found in the REANA2 fields is therefore the result of all the changes made compared to REANA1 and SOP1.
Studies are currently being carried out to examine the respective impact of the additional observations, such as reprocessed GNSS data, high-resolution radiosondes, radars, and lidars assimilated in the second reanalysis.
The source code of AROME-WMED, derived from the operational AROME code, cannot be obtained, but the analyses and forecast fields are available in the HyMeX database (http://mistrals.sedoo.fr/HyMeX/, last access: 3 July 2019). SOP1 is available at https://doi.org/10.6096/HYMEX.AROME_WMED.2012.02.20 (Fourrié and Nuret, 2011), REANA1 at https://doi.org/10.6096/HYMEX.REANALYSIS_AROME_WMED_V1.2014.02.10 (Fourrié and Nuret, 2014), and REANA2 at https://doi.org/10.14768/MISTRALS-HYMEX.1492 (Fourrié and Nuret, 2017).
NF and MN prepared and carried out all the numerical experiments of the reanalyses, investigated the results, and wrote the paper with the help of all the coauthors. DP, PBr, and OC helped to investigate the results by performing diagnostics and verification computations, EW prepared the radar data assimilation, PM and HB helped to investigate the GNSS data assimilation, and OB, PBo, PC, CF, PDG, ER, and FS helped to prepare the other assimilation of the research datasets.
The authors declare that they have no conflict of interest.
The authors would like to acknowledge the MISTRALS/HyMeX program and the funding from the ANR under contracts IODA-MED ANR-11-BS56-0005 and MUSIC ANR-14-CE01-0014. Véronique Ducrocq, Jean-Francois Mahfouf, and Jean-Antoine Maziejewski are warmly thanked for helping to improve the paper.
This research has been supported by the ANR (grant nos. ANR-11-BS56-0005 and ANR-14-CE01-0014).
This paper was edited by Olivier Marti and reviewed by two anonymous referees.
Bénard, P., Vivoda, J., Mašek, J., Smolìkovà, P., Yessad, K., Smith, C., Brožkovà, R., and Geleyn, J.-F.: Dynamical kernel of the Aladin-NH spectral limited area model: Revised formulation and sensitivity experiments, Q. J. Roy. Meteor. Soc., 136, 155–169, 2010. a
Bielli, S., Grzeschik, M., Richard, E., Flamant, C., Champollion, C., Kiemle, C., Dorninger, M., and Brousseau, P.: Assimilation of water-vapour airborne lidar observations: impact study on the COPS precipitation forecasts, Q. J. Roy. Meteor. Soc., 138, 1652–1667, https://doi.org/10.1002/qj.1864, 2012. a
Bock, O., Bosser, P., Pacione, R., Nuret, M., Fourrié, N., and Parracho, A.: A high-quality reprocessed ground-based GPS dataset for atmospheric process studies, radiosonde and model evaluation, and reanalysis of HyMeX Special Observing Period, Q. J. Roy. Meteor. Soc., 142, 56–71, https://doi.org/10.1002/qj.2701, 2016. a, b, c, d
Bouin, M. N., Redelsperger, J. L., and Lebeaupin Brossier, C.: Processes leading to deep convection and sensitivity to sea-state representation during HyMeX IOP8 heavy precipitation event, Q. J. Roy. Meteor. Soc., 143, 2600–2615, https://doi.org/10.1002/qj.3111, 2017. a
Bresson, E., Ducrocq, V., Nuissier, O., Ricard, D., and de Saint-Aubin, C.: Idealized numerical simulations of quasi-stationary convective systems over the Northwestern Mediterranean complex terrain, Q. J. Roy. Meteor. Soc., 138, 1751–1763, 2012. a
Brousseau, P., Berre, L., Bouttier, F., and Desroziers, G.: Background error covariances for a convective-scale data-assimilation system: AROME-France 3D-Var, Q. J. Roy. Meteor. Soc., 137, 409–422, https://doi.org/10.1002/qj.750, 2011. a
Brousseau, P., Seity, Y., Ricard, D., and Léger, J.: Improvement of the forecast of convective activity from the AROME-France system, Q. J. Roy. Meteor. Soc., 142, 2231-–2243, https://doi.org/10.1002/qj.2822, 2016. a
Buzzi, A., D'Isidoro, M., and Davolio, S.: A case-study of an orographic cyclone south of the Alps during the MAP SOP, Q. J. Roy. Meteor. Soc., 129, 1795–1818, https://doi.org/10.1256/qj.02.112, 2003. a
Caniaux, G., Redelsperger, J.-L., and Lafore, J.-P.: A numerical study of the stratiform region of a fast-moving squall line. Part I: General description and water and heat budgets, J. Atmos. Sci., 51, 2046–2074, 1994. a
Caumont, O., Ducrocq, V., Wattrelot, E., Jaubert, G., and Pradier-Vabre, S.: 1D+3DVar assimilation of radar reflectivity data: a proof of concept, Tellus A, 62, 173–187, https://doi.org/10.1111/j.1600-0870.2009.00430.x, 2010. a
Chazette, P., Flamant, C., Shang, X., Totems, J., Raut, J.-C., Doerenbecher, A., Ducrocq, V., Fourrié, N., Bock, O., and Cloché, S.: A multi-instrument and multi-model assessment of atmospheric moisture variability over the western Mediterranean during HyMeX, Q. J. Roy. Meteor. Soc., 142, 7–22, https://doi.org/10.1002/qj.2671, 2016. a
Courtier, P., Freydier, C., Rabier, F., and Rochas, M.: The ARPEGE Project at Météo-France, ECMWF Seminar Proceedings, 7, 193–231, 1991. a
Cuxart, J., Bougeault, P., and Redelsperger, J.-L.: A turbulence scheme allowing for mesoscale and large-eddy simulations, Q. J. Roy. Meteor. Soc., 126, 1–30, https://doi.org/10.1002/qj.49712656202, 2000. a
Danielson, J. and Gesch, D.: Global multi-resolution terrain elevation data 2010 (GMTED2010), U.S. Geological Survey Open-File Report 2011–1073, 34 pp., available at: https://pubs.usgs.gov/of/2011/1073/pdf/of2011-1073.pdf (last access: 3 July 2019), 2011. a
Desroziers, G., Hello, G., and Jean-Noel, T.: A 4D-Var re-analysis of FASTEX, Q. J. Roy. Meteor. Soc., 129, 1301–1315, https://doi.org/10.1256/qj.01.182, 2003. a
Di Girolamo, P., Flamant, C., Cacciani, M., Richard, E., Ducrocq, V., Summa, D., Stelitano, D., Fourrié, N., and Saïd, F.: Observation of low-level wind reversals in the Gulf of Lion area and their impact on the water vapour variability, Q. J. Roy. Meteor. Soc., 142, 153–172, https://doi.org/10.1002/qj.2767, 2016. a
Doerenbecher, A., Basdevant, C., Drobinski, P., Durand, P., Fesquet, C., Bernard, F., Cocquerez, P., Verdier, N., and Vargas, A.: Low-Atmosphere Drifting Balloons: Platforms for Environment Monitoring and Forecast Improvement, B. Am. Meteorol. Soc., 97, 1583–1599, https://doi.org/10.1175/BAMS-D-14-00182.1, 2016. a
Drobinski, P., Ducrocq, V., Alpert, P., Anagnostou, E., Béranger, K., Borga, M., Braud, I., Chanzy, A., Davolio, S., Delrieu, G., Estournel, C., Boubrahmi, N. F., Font, J., Grubišić, V., Gualdi, S., Homar, V., Ivančan-Picek, B., Kottmeier, C., Kotroni, V., Lagouvardos, K., Lionello, P., Llasat, M. C., Ludwig, W., Lutoff, C., Mariotti, A., Richard, E., Romero, R., Rotunno, R., Roussot, O., Ruin, I., Somot, S., Taupier-Letage, I., Tintore, J., Uijlenhoet, R., and Wernli, H.: HyMeX: A 10-Year Multidisciplinary Program on the Mediterranean Water Cycle, B. Am. Meteorol. Soc., 95, 1063–1082, https://doi.org/10.1175/BAMS-D-12-00242.1, 2014. a
Ducrocq, V., Braud, I., Davolio, S., Ferretti, R., Flamant, C., Jansa, A., Kalthoff, N., Richard, E., Taupier-Letage, I., Ayral, P.-A., Belamari, S., Berne, A., Borga, M., Boudevillain, B., Bock, O., Boichard, J.-L., Bouin, M.-N., Bousquet, O., Bouvier, C., Chiggiato, J., Cimini, D., Corsmeier, U., Coppola, L., Cocquerez, P., Defer, E., Delanoë, J., Girolamo, P. D., Doerenbecher, A., Drobinski, P., Dufournet, Y., Fourrié, N., Gourley, J. J., Labatut, L., Lambert, D., Coz, J. L., Marzano, F. S., Molinié, G., Montani, A., Nord, G., Nuret, M., Ramage, K., Rison, W., Roussot, O., Said, F., Schwarzenboeck, A., Testor, P., Baelen, J. V., Vincendon, B., Aran, M., and Tamayo, J.: HyMeX-SOP1: The Field Campaign Dedicated to Heavy Precipitation and Flash Flooding in the Northwestern Mediterranean, B. Am. Meteorol. Soc., 95, 1083–1100, https://doi.org/10.1175/BAMS-D-12-00244.1, 2014. a
Duffourg, F. and Ducrocq, V.: Origin of the moisture feeding the Heavy Precipitating Systems over Southeastern France, Nat. Hazards Earth Syst. Sci., 11, 1163–1178, https://doi.org/10.5194/nhess-11-1163-2011, 2011. a
Ebert, E.: Fuzzy verification of high resolution gridded forecasts: a review and proposed framework, Meteorol. Appl., 15, 51–64, 2008. a
Fourrié, N. and Nuret, M.: AROME_WMED, GAME/CNRM (Météo-France), https://doi.org/10.6096/HYMEX.AROME_WMED.2012.02.20, 2011. a
Fourrié, N. and Nuret, M.: AROME_WMED reanalysis_1, GAME/CNRM (Météo-France), https://doi.org/10.6096/HYMEX.REANALYSIS_AROME_WMED_V1.2014.02.10, 2014. a
Fourrié, N. and Nuret, M.: AROME_WMED reanalysis_2, ESPRI/IPSL, https://doi.org/10.14768/MISTRALS-HYMEX.1492, 2017. a
Fourrié, N., Bresson, É., Nuret, M., Jany, C., Brousseau, P., Doerenbecher, A., Kreitz, M., Nuissier, O., Sevault, E., Bénichou, H., Amodei, M., and Pouponneau, F.: AROME-WMED, a real-time mesoscale model designed for the HyMeX special observation periods, Geosci. Model Dev., 8, 1919–1941, https://doi.org/10.5194/gmd-8-1919-2015, 2015. a, b, c, d
Ingleby, B., Pauley, P., Kats, A., Ator, J., Keyser, D., Doerenbecher, A., Fucile, E., Hasegawa, J., Toyoda, E., Kleinert, T., Qu, W., St. James, J., Tennant, W., and Weedon, R.: Progress toward High-Resolution, Real-Time Radiosonde Reports, B. Am. Meteorol. Soc., 97, 2149–2161, https://doi.org/10.1175/BAMS-D-15-00169.1, 2016. a
Keil, C. and Cardinali, C.: The ECMWF reanalysis of the MAP Special Observing Period, Q. J. Roy. Meteor. Soc., 130, 2827–2849, https://doi.org/10.1256/qj.03.89, 2004. a
Mahfouf, J.-F., Ahmed, F., Moll, P., and Teferle, F. N.: Assimilation of zenith total delays in the AROME France convective scale model: a recent assessment, Tellus A, 67, 26106, https://doi.org/10.3402/tellusa.v67.26106,, 2015. a
Masson, V. and Seity, Y.: Including Atmospheric Layers in Vegetation and Urban Offline Surface Schemes, J. Appl. Meteorol. Clim., 48, 1377–1397, https://doi.org/10.1175/2009JAMC1866.1, 2009. a
Masson, V., Champeaux, J.-L., Chauvin, F., Meriguet, C., and Lacaze, R.: A Global Database of Land Surface Parameters at 1-km Resolution in Meteorological and Climate Models, J. Climate, 16, 1261–1282, https://doi.org/10.1175/1520-0442(2003)16<1261:AGDOLS>2.0.CO;2, 2003. a
Masson, V., Le Moigne, P., Martin, E., Faroux, S., Alias, A., Alkama, R., Belamari, S., Barbu, A., Boone, A., Bouyssel, F., Brousseau, P., Brun, E., Calvet, J.-C., Carrer, D., Decharme, B., Delire, C., Donier, S., Essaouini, K., Gibelin, A.-L., Giordani, H., Habets, F., Jidane, M., Kerdraon, G., Kourzeneva, E., Lafaysse, M., Lafont, S., Lebeaupin Brossier, C., Lemonsu, A., Mahfouf, J.-F., Marguinaud, P., Mokhtari, M., Morin, S., Pigeon, G., Salgado, R., Seity, Y., Taillefer, F., Tanguy, G., Tulet, P., Vincendon, B., Vionnet, V., and Voldoire, A.: The SURFEXv7.2 land and ocean surface platform for coupled or offline simulation of earth surface variables and fluxes, Geosci. Model Dev., 6, 929–960, https://doi.org/10.5194/gmd-6-929-2013, 2013. a, b
Montmerle, T. and Faccani, C.: Mesoscale Assimilation of Radial Velocities from Doppler Radars in a Preoperational Framework, Mon. Weather Rev., 137, 1939–1953, https://doi.org/10.1175/2008MWR2725.1, 2009. a
Pergaud, J., Masson, V., Malardel, S., and Couvreux, F.: A Parameterization of Dry Thermals and Shallow Cumuli for Mesoscale Numerical Weather Prediction, Bound.-Lay. Meteorol., 132, 83–106, https://doi.org/10.1007/s10546-009-9388-0, 2009. a
Pinty, J.-P. and Jabouille, P.: A mixed-phased cloud parameterization for use in a mesoscale non-hydrostatic model: simulations of a squall line and of orographic precipitation. Proceeding, Conference on Cloud Physics, 17–21 August 1998, Everett, WA, USA, Amer. Meteor. Soc., 217–220, 1998. a
Prates, C., Richardson, D., and Sahin, C.: Final report of the PREVIEW observation Data Targeting System (DTS), Tech Memo 581, ECMWF, available at: https://www.ecmwf.int/sites/default/files/elibrary/2009/11720-final-report-preview-observation-data-targeting-system-dts.pdf (last access: 3 July 2019), 2009. a
Ricard, D., Ducrocq, V., and Auger, L.: A Climatology of the Mesoscale Environment Associated with Heavily Precipitating Events over a Northwestern Mediterranean Area, J. Appl. Meteorol. Clim., 51, 468–488, 2012. a
Saïd, F., Campistron, B., Delbarre, H., Canut, G., Doerenbecher, A., Durand, P., Fourrié, N., Lambert, D., and Legain, D.: Offshore winds obtained from a network of wind-profiler radars during HyMeX, Q. J. Roy. Meteor. Soc., 142, 23–42, https://doi.org/10.1002/qj.2749, 2016. a
Seity, Y., Brousseau, P., Malardel, S., Hello, G., Bénard, P., Bouttier, F., Lac, C., and Masson, V.: The AROME-France convective scale operational model., Mon. Weather Rev., 139, 976–991, 2011. a, b
Wattrelot, E., Caumont, O., and Mahfouf, J.-F.: Operational Implementation of the 1D+3D-Var Assimilation Method of Radar Reflectivity Data in the AROME Model, Mon. Weather Rev., 142, 1852–1873, https://doi.org/10.1175/MWR-D-13-00230.1, 2014. a