the Creative Commons Attribution 4.0 License.
the Creative Commons Attribution 4.0 License.
 | 28 Aug 2019
CAM6 simulation of mean and extreme precipitation over Asia: sensitivity to upgraded physical parameterizations and higher horizontal resolution
Andrew Gettelman
Yangyang Xu
Chenglai Wu
Zhili Wang
Nan Rosenbloom
Susan C. Bates
Wenjie Dong
The Community Atmosphere Model version 6 (CAM6), released in 2018 as part of the Community Earth System Model version 2 (CESM2), is a major upgrade over the previous CAM5 that has been used in numerous global and regional climate studies. Since CESM2–CAM6 will participate in the upcoming Coupled Model Intercomparison Project phase 6 (CMIP6) and is likely to be adopted in many future studies, its simulation fidelity needs to be thoroughly examined. Here we evaluate the performance of a developmental version of the Community Atmosphere Model with parameterizations that will be used in version 6 (CAM6α), with a default 1∘ horizontal resolution (, CAM6α-1∘) and a high-resolution configuration (approximately 0.25∘, CAM6α-0.25∘), against various observational and reanalysis datasets of precipitation over Asia. CAM6α performance is compared with CAM5 at default 1∘ horizontal resolution (CAM5-1∘) and a high-resolution configuration at 0.25∘ (CAM5-0.25∘). With the prognostic treatment of precipitation processes and the new microphysics module, CAM6α is able to better simulate climatological mean and extreme precipitation over Asia, better capture the heaviest precipitation events, better reproduce the diurnal cycle of precipitation rates over most of Asia, and better simulate the probability density distributions of daily precipitation over Tibet, Korea, Japan and northern China. Higher horizontal resolution in CAM6α improves the simulation of mean and extreme precipitation over northern China, but the performance degrades over the Maritime Continent. Moisture budget diagnosis suggests that the physical processes leading to model improvement are different over different regions. Both upgraded physical parameterizations and higher horizontal resolution affect the simulated precipitation response to the internal variability of the climate system (e.g., Asian monsoon variability, El Niño–Southern Oscillation – ENSO, Pacific Decadal Oscillation – PDO), but the effects vary across different regions. For example, higher horizontal resolution degrades the model performance in simulating precipitation variability over southern China associated with the East Asian summer monsoon. In contrast, precipitation variability associated with ENSO improves with upgraded physical parameterizations and higher horizontal resolution. CAM6α-0.25∘ and CAM6α-1∘ show an opposite response to the PDO over southern China. Basically, the response to increases in horizontal resolution is dependent on the CAM version.


The Community Atmosphere Model (CAM) is an atmospheric general circulation model (AGCM) developed at the National Center for Atmospheric Research (NCAR) with extensive community support. The fifth version of CAM (CAM5) (Neale et al., 2010), as part of the Community Earth System Model version 1 (CESM1) (Hurrell et al., 2013), was widely used for climate studies over Asia. CAM5 included a two-moment cloud microphysics scheme that is missing in the previous CAM versions and improved the representation of low-level clouds (Morrison and Gettelman, 2008), net conversion rates from water vapor to cloud condensation (Neale et al., 2010; Zhang and McFarlane, 1995) and a three-mode aerosol module (Liu et al., 2012).
Among various applications, CESM1–CAM5 has been used in many studies relating to clouds and precipitation over Asia. For example, Y. Zhang et al. (2014) evaluated the sensitivity of simulated stratus clouds over eastern China to horizontal resolution in CAM5. Zhang and Chen (2016) investigated the mean state and diurnal cycle of summer precipitation over continental East Asia in CAM4 and CAM5. Li et al. (2015) used CAM5 with different resolutions (2.8, 1.0 and 0.45∘) to study the impact of horizontal resolution on model performance in simulating precipitation over East Asia. Wang et al. (2018) investigated the sensitivity of the Indian summer monsoon to different convective schemes in CAM5. Jiang et al. (2015) examined anthropogenic aerosol optical depths and their effects on clouds and precipitation in East Asia. Vinoj et al. (2014) found with CAM5 simulations that dust-induced atmospheric heating over North Africa and West Asia modulated monsoon rainfall over central India.
A prereleased version of CAM6 (denoted here as CAM6α, extensively tested in late 2017) shares the same basic physics as the released version of CAM6, except for slightly different tuning parameters and without the updated surface drag scheme. CAM6α was thoroughly evaluated over the continental United States (Gettelman et al., 2018), but the improvement of CAM6α over its predecessors remains unknown for East and Southeast Asia. Since CAM6 and other CMIP6-era (Coupled Model Intercomparison Project phase 6) (Eyring et al., 2016) models are likely to be widely used for hydroclimate studies over Asia in the next 5 to 10 years, model fidelity needs to be carefully evaluated. For example, the UK Met Office atmosphere model Global Atmosphere 6.0 (GA6) was used to study the interannual and intraseasonal precipitation variability over China (Stephan et al., 2018a, b; Walters et al., 2017). Similarly, Martin et al. (2017) analyzed tropical precipitation in GA6 with a range of horizontal resolutions and found that the behavior of the deep convection parameterization in GA6 is largely independent of the grid-box size and time step length over which it operates.
In addition to model physics upgrades, another area of growth in global climate model development is the enhancement of horizontal spatial resolution. Grid spacing of 0.25∘ (approximately 25 km) is the targeted resolution for global atmosphere modeling in the near future (Sharma et al., 2016), while most of default CMIP6 runs at the decadal to centennial scale are still performed at 1∘. Generally, enhanced model resolution tends to reduce model biases (Palmer, 2014; Yao et al., 2017; Chen et al., 2018). Nevertheless, Johnson et al. (2016) indicated that increasing horizontal resolution was not a solution to many South Asian monsoon biases in the Met Office Global Atmosphere 3.0 (GA3) model. For CAM, high-resolution performance has been evaluated in several studies. Wehner et al. (2014) found that extreme precipitation amounts are larger as the resolution increases in CAM5. Other CAM5 studies have also tested resolutions of 0.5∘ (Bacmeister et al., 2014; Lau and Ploshay, 2009) and 1∘ (C. Zhang et al., 2014; Li et al., 2015; Lin et al., 2015, 2016). However, the performance of 0.25∘ CAM6 simulations over Asia has not been examined rigorously.
In order to provide insights into both physical schemes and horizontal resolution, here we analyze a four-model hierarchy. First, we explore the effects of new physical parameterizations by contrasting a CAM6α-1∘ simulation with CAM5-1∘. Second, we evaluate CAM6α with 1 and 0.25∘ resolutions to quantify model sensitivity to horizontal resolution. In addition, we also analyze CAM5 at 0.25 and 1∘ resolution to evaluate if the impact of higher resolution is model dependent.
This technical paper of model evaluation is divided into the following sections. After the Introduction (Sect. 1), Sect. 2 provides detailed information on the model configurations, model experimental setup and observational datasets used as benchmarks. In Sect. 3, we compare the climatological (multi-year) average of monthly mean and daily extreme precipitation simulated by four versions of CAM in the context of observational uncertainty. Section 4 is devoted to the evaluation of precipitation variability at a wide range of timescales that is not tuned during the model development process. Section 5 discusses in detail whether climate simulations are improved over northern China, southwestern China and the Maritime Continent due to new physical parameterizations and/or higher resolution (by conducting a moisture budget analysis using both CAM5 and CAM6). Finally, we present a further discussion and a summary in Sect. 6.
2.1 CAM simulation
The first set of simulations use the publicly released version of CAM5.1 (Neale et al., 2010). CAM5.1 treats stratus cloud microphysics with the double-moment formulation of Morrison and Gettelman (2008) and Gettelman et al. (2008). The spatial distribution of shallow convection is simulated with a set of realistic plume dilution equations (Park and Bretherton, 2009). The ice cloud fraction scheme allows supersaturation via a modified relative humidity over ice and the inclusion of ice condensation amount (Gettelman et al., 2010). A three-mode (lognormal) aerosol model was used to predict aerosol concentration, and the number concentrations of aerosols are connected to ice–warm cloud microphysics, accounting for ice and the liquid activation of cloud crystals and drops (Liu et al., 2012). A finite-volume (FV) dynamical core (1∘) is used. The second set of simulations uses CAM5 with the spectral element (SE) dynamical core at a resolution of 0.25∘ (Meehl et al., 2019). The other settings are identical to the first set of simulations of CAM5-1∘.
The third and fourth sets of simulation considered in this study use a nearly final version of CAM6 (denoted as CAM6α) that has the same basic physics as the final version of CAM6 released in 2018 (Bogenschutz et al., 2013; Gettelman et al., 2018) but with slightly different tuning parameters. CAM6α uses CLUBB (Cloud Layers Unified by Binormals) (Golaz et al., 2002a, b) to unify the boundary layer and shallow convective turbulence with cloud macrophysics, a new ice nucleation parameterization (Hoose et al., 2010), updated cloud microphysics with prognostic precipitation (Gettelman and Morrison, 2015; Gettelman et al., 2018) and a modified aerosol modal model (Liu et al., 2016). CAM6α, with the spectral element (SE) dynamical core (Lauritzen et al., 2018), was run twice with different horizontal resolutions (i.e., ∼1 and ∼0.25∘). The same uniform-resolution SE simulations with CAM6α forced by observed sea surface temperature data for 1979–2005 (saved output for monthly, daily and 3 hourly) are analyzed in Gettelman et al. (2018). Using these simulations, we can evaluate the differences due to resolution increase from 1 to 0.25∘ in CAM5 (sets 1 and 2) and CAM6 (sets 3 and 4). That offers us an opportunity to explore whether the response from higher resolution is dependent on the CAM version.
All model simulations evaluated here (Table 1) followed the protocol of the Atmospheric Model Intercomparison Project (AMIP). Simulations are forced by observed monthly sea surface temperature and sea ice from 1979 to 2005, which are linearly interpolated to obtain specified daily values, as well as the evolution of aerosol emissions and trace gas concentration (including CO2). The 25-year simulations for 1980–2004 are analyzed here to match available observational and reanalysis datasets. Monthly and daily frequency output data are used.
Table 1Four CAM versions with major physical schemes and the time step listed in abbreviations. ZM1995 is Zhang and McFarlane (1995). PB2009 is Park and Bretherton (2009). BP2009 is Bretherton and Park (2009). P2014 is Park et al. (2014). MG1 is Morrison and Gettelman (2008). MG2 is Gettelman and Morrison (2015). G2010 is Gettelman et al. (2010). CLUBB is Golaz et al. (2002a). MAM3 is Liu et al. (2012). MAM4 is Liu et al. (2016).
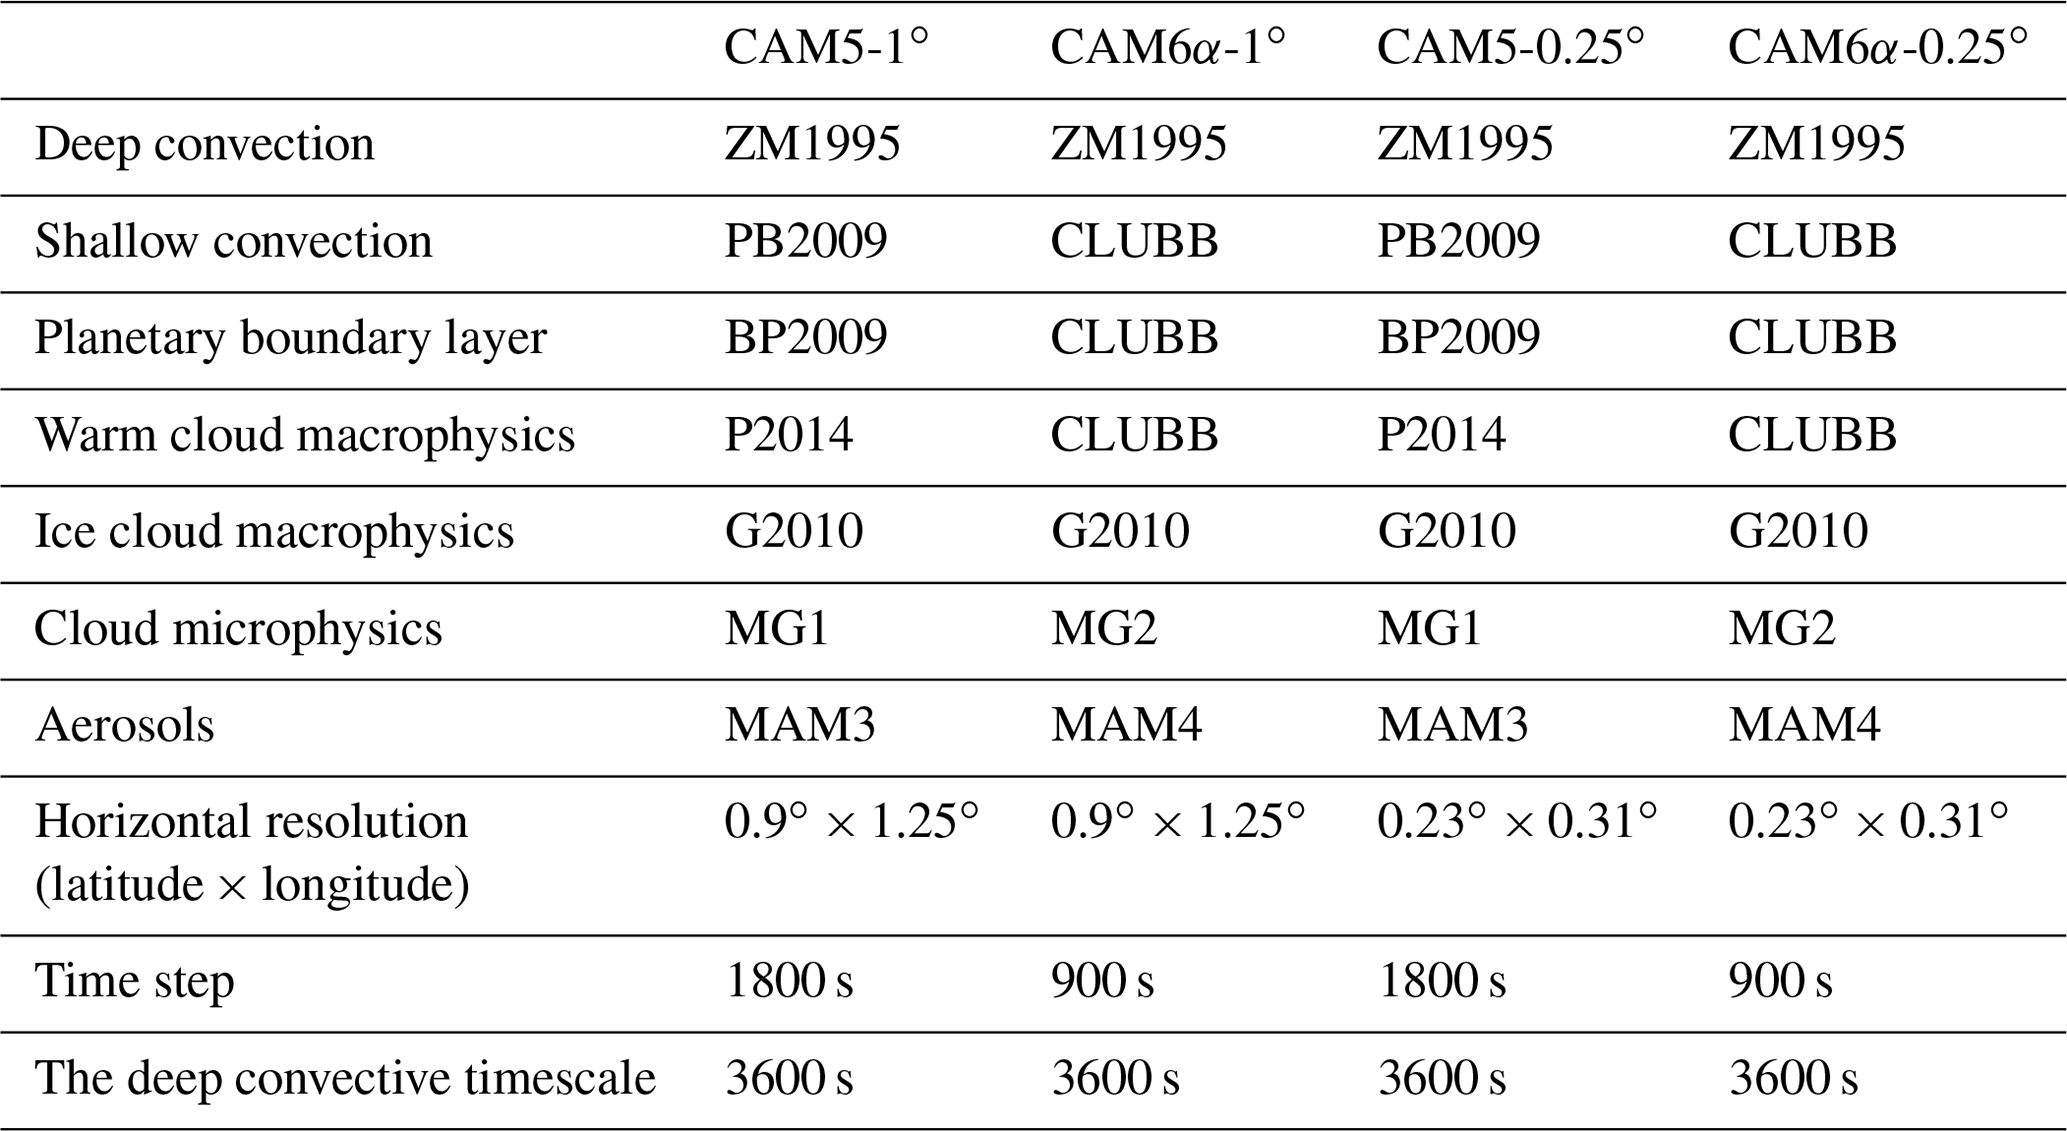
Table 2Simulation differences due to physical parameterizations (CAM6α-1∘ minus CAM5-1∘) and high horizontal resolution (CAM6α-0.25∘ minus CAM6α-1∘ ∕ CAM5-0.25∘ minus CAM5-1∘). The values are averages over southwestern China, northern China and the Maritime Continent during 1980–2004. Descriptions of variables are as follows: TREFHT, surface air temperature; LHFLX, surface latent heat flux; SHFLX, surface sensible heat flux; FSDSC, clear-sky downwelling solar flux at the surface; FSDS, downwelling solar flux at the surface; FLDS, downwelling longwave flux at the surface; CLDTOT, vertically integrated total cloud; INT_Q, vertically integrated humidity; PRECT, total precipitation rate; PRECC, convective precipitation rate; PRECL, large-scale precipitation rate.
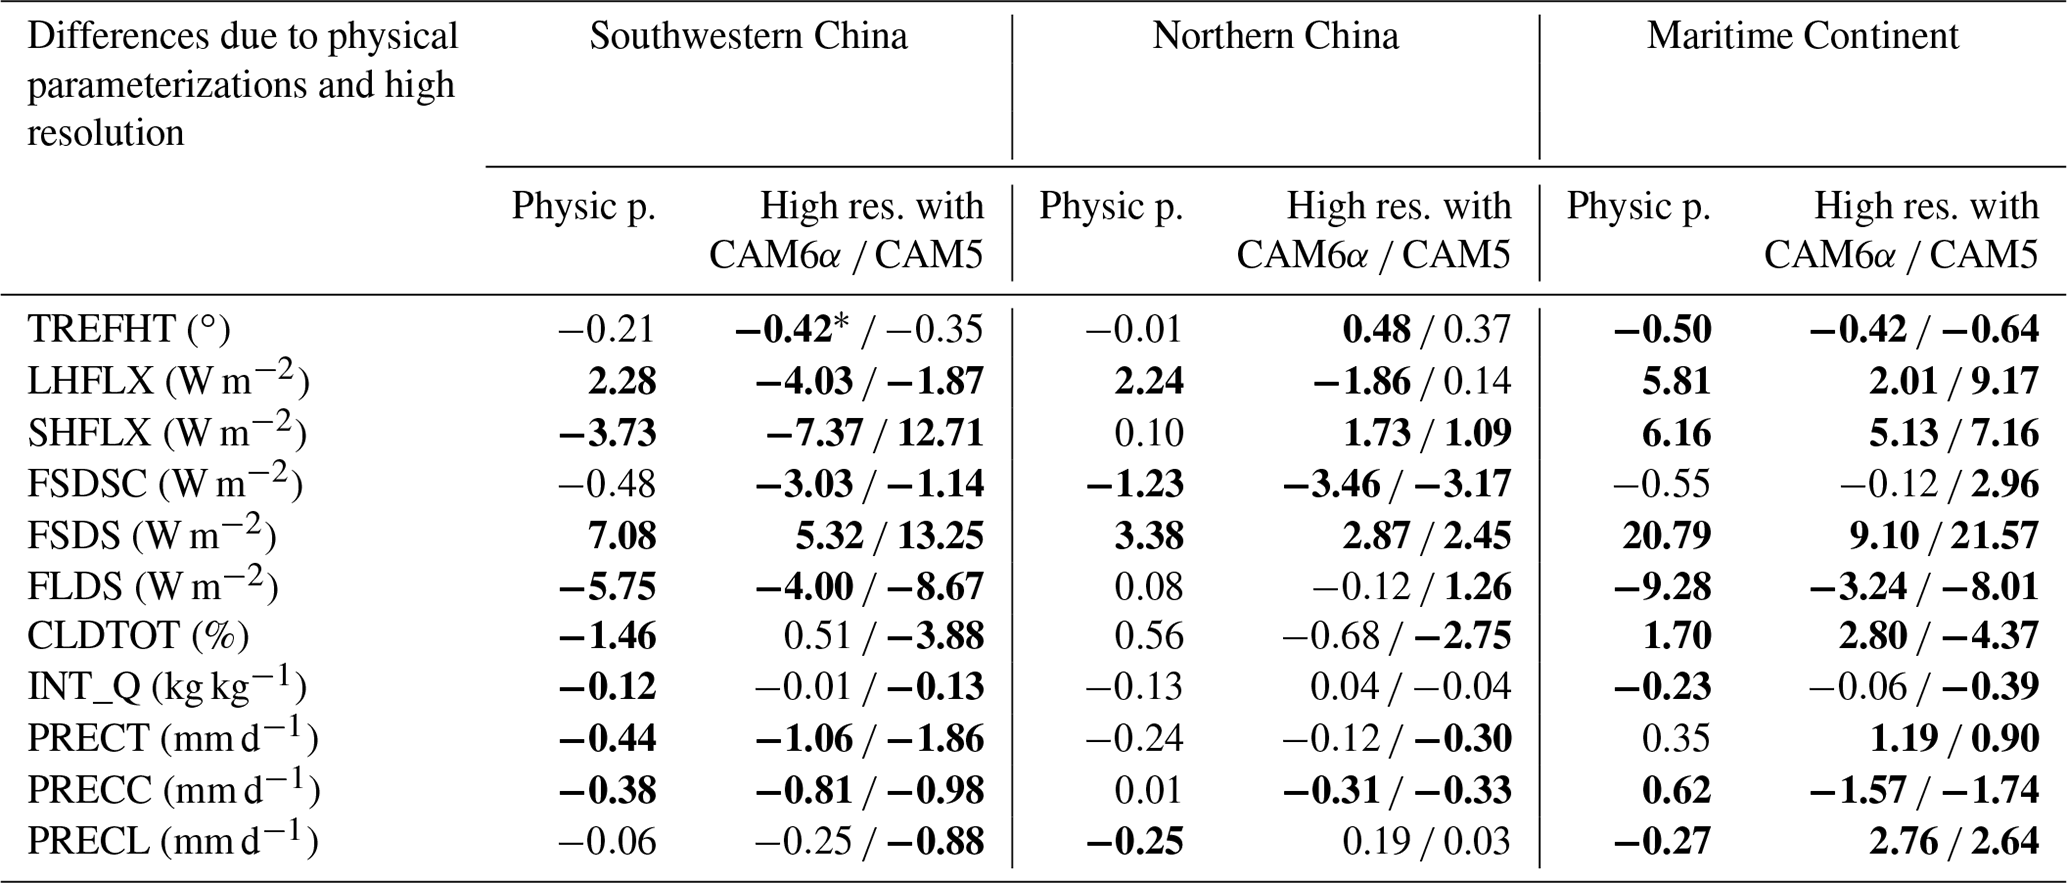
* Statistically significant differences are emphasized in bold (95 % confidence level from a two-sided t test).
2.2 Observational datasets
Asian Precipitation – Highly Resolved Observational Data Integration Towards Evaluation (APHRODITE)
For the direct observation of temperature and precipitation, APHRODITE data are used (Yatagai et al., 2012). APHRODITE is a gridded daily precipitation product covering monsoonal Asia, the Middle East and Russia, and it is available at resolution during the period of 1951–2007. The dataset was created by collating a dense network of rain gauge daily measurements across Asia.
2.3 The Japanese 55-year reanalysis (JRA55)
The Japan Meteorological Agency (JMA) reanalysis dataset (JRA55) uses an operational data assimilation system with the 4D-Var scheme (Kobayashi et al., 2015). The dataset covers 55 years from 1958 (when regular radiosonde observation began on a global basis) to 2013. JRA55 has a horizontal resolution of 0.56∘.
2.4 Modern-Era Retrospective analysis for Research and Applications version 2 (MERRA2)
MERRA2 is a NASA atmospheric reanalysis for the satellite era (from 1980 to present) using the Goddard Earth Observing System Model version 5 (GEOS-5) with its Atmospheric Data Assimilation System. MERRA2 has a spatial resolution (Gelaro et al., 2017).
The APHRODITE data might be limited by the potential lack of gauge observations in mountainous areas (Zhao et al., 2015), and therefore we adopted MERRA2 as an additional data source specifically for daily precipitation evaluation. Note, however, that rainfall in reanalysis products such as JRA55 and MERRA2 is dependent on the reanalysis model physics, and it is well known that there is large uncertainty among various observational datasets (Sheffield et al., 2012; Trenberth et al., 2014).
2.5 Tropical Rainfall Measuring Mission (TRMM)
The latest TRMM 3B43 version 7 data (0.25∘) between 1998 and 2016, downloaded from NASA Goddard Space Flight Center, combine multiple independent precipitation estimates from TRMM Microwave Imager and Global Precipitation Climatology Project (GPCP) rain gauge analysis. The 3-hourly data over Asia (a temporal resolution unavailable in the other three data sources) for 1999–2004 are used in our study to assess the diurnal cycle of precipitation (Huffman and Bolvin, 2013).
Climate Prediction Center (CPC) temperature
CPC global datasets for daily surface air temperature from in situ measurements with resolution are used as a second benchmark (Chen et al., 2008). CPC data are provided by the NOAA/OAR/ESRL (National Oceanic and Atmospheric Administration/Oceanic and Atmospheric Research/Earth System Research Laboratory) PSD (Physical Sciences Division), Boulder, Colorado, USA.
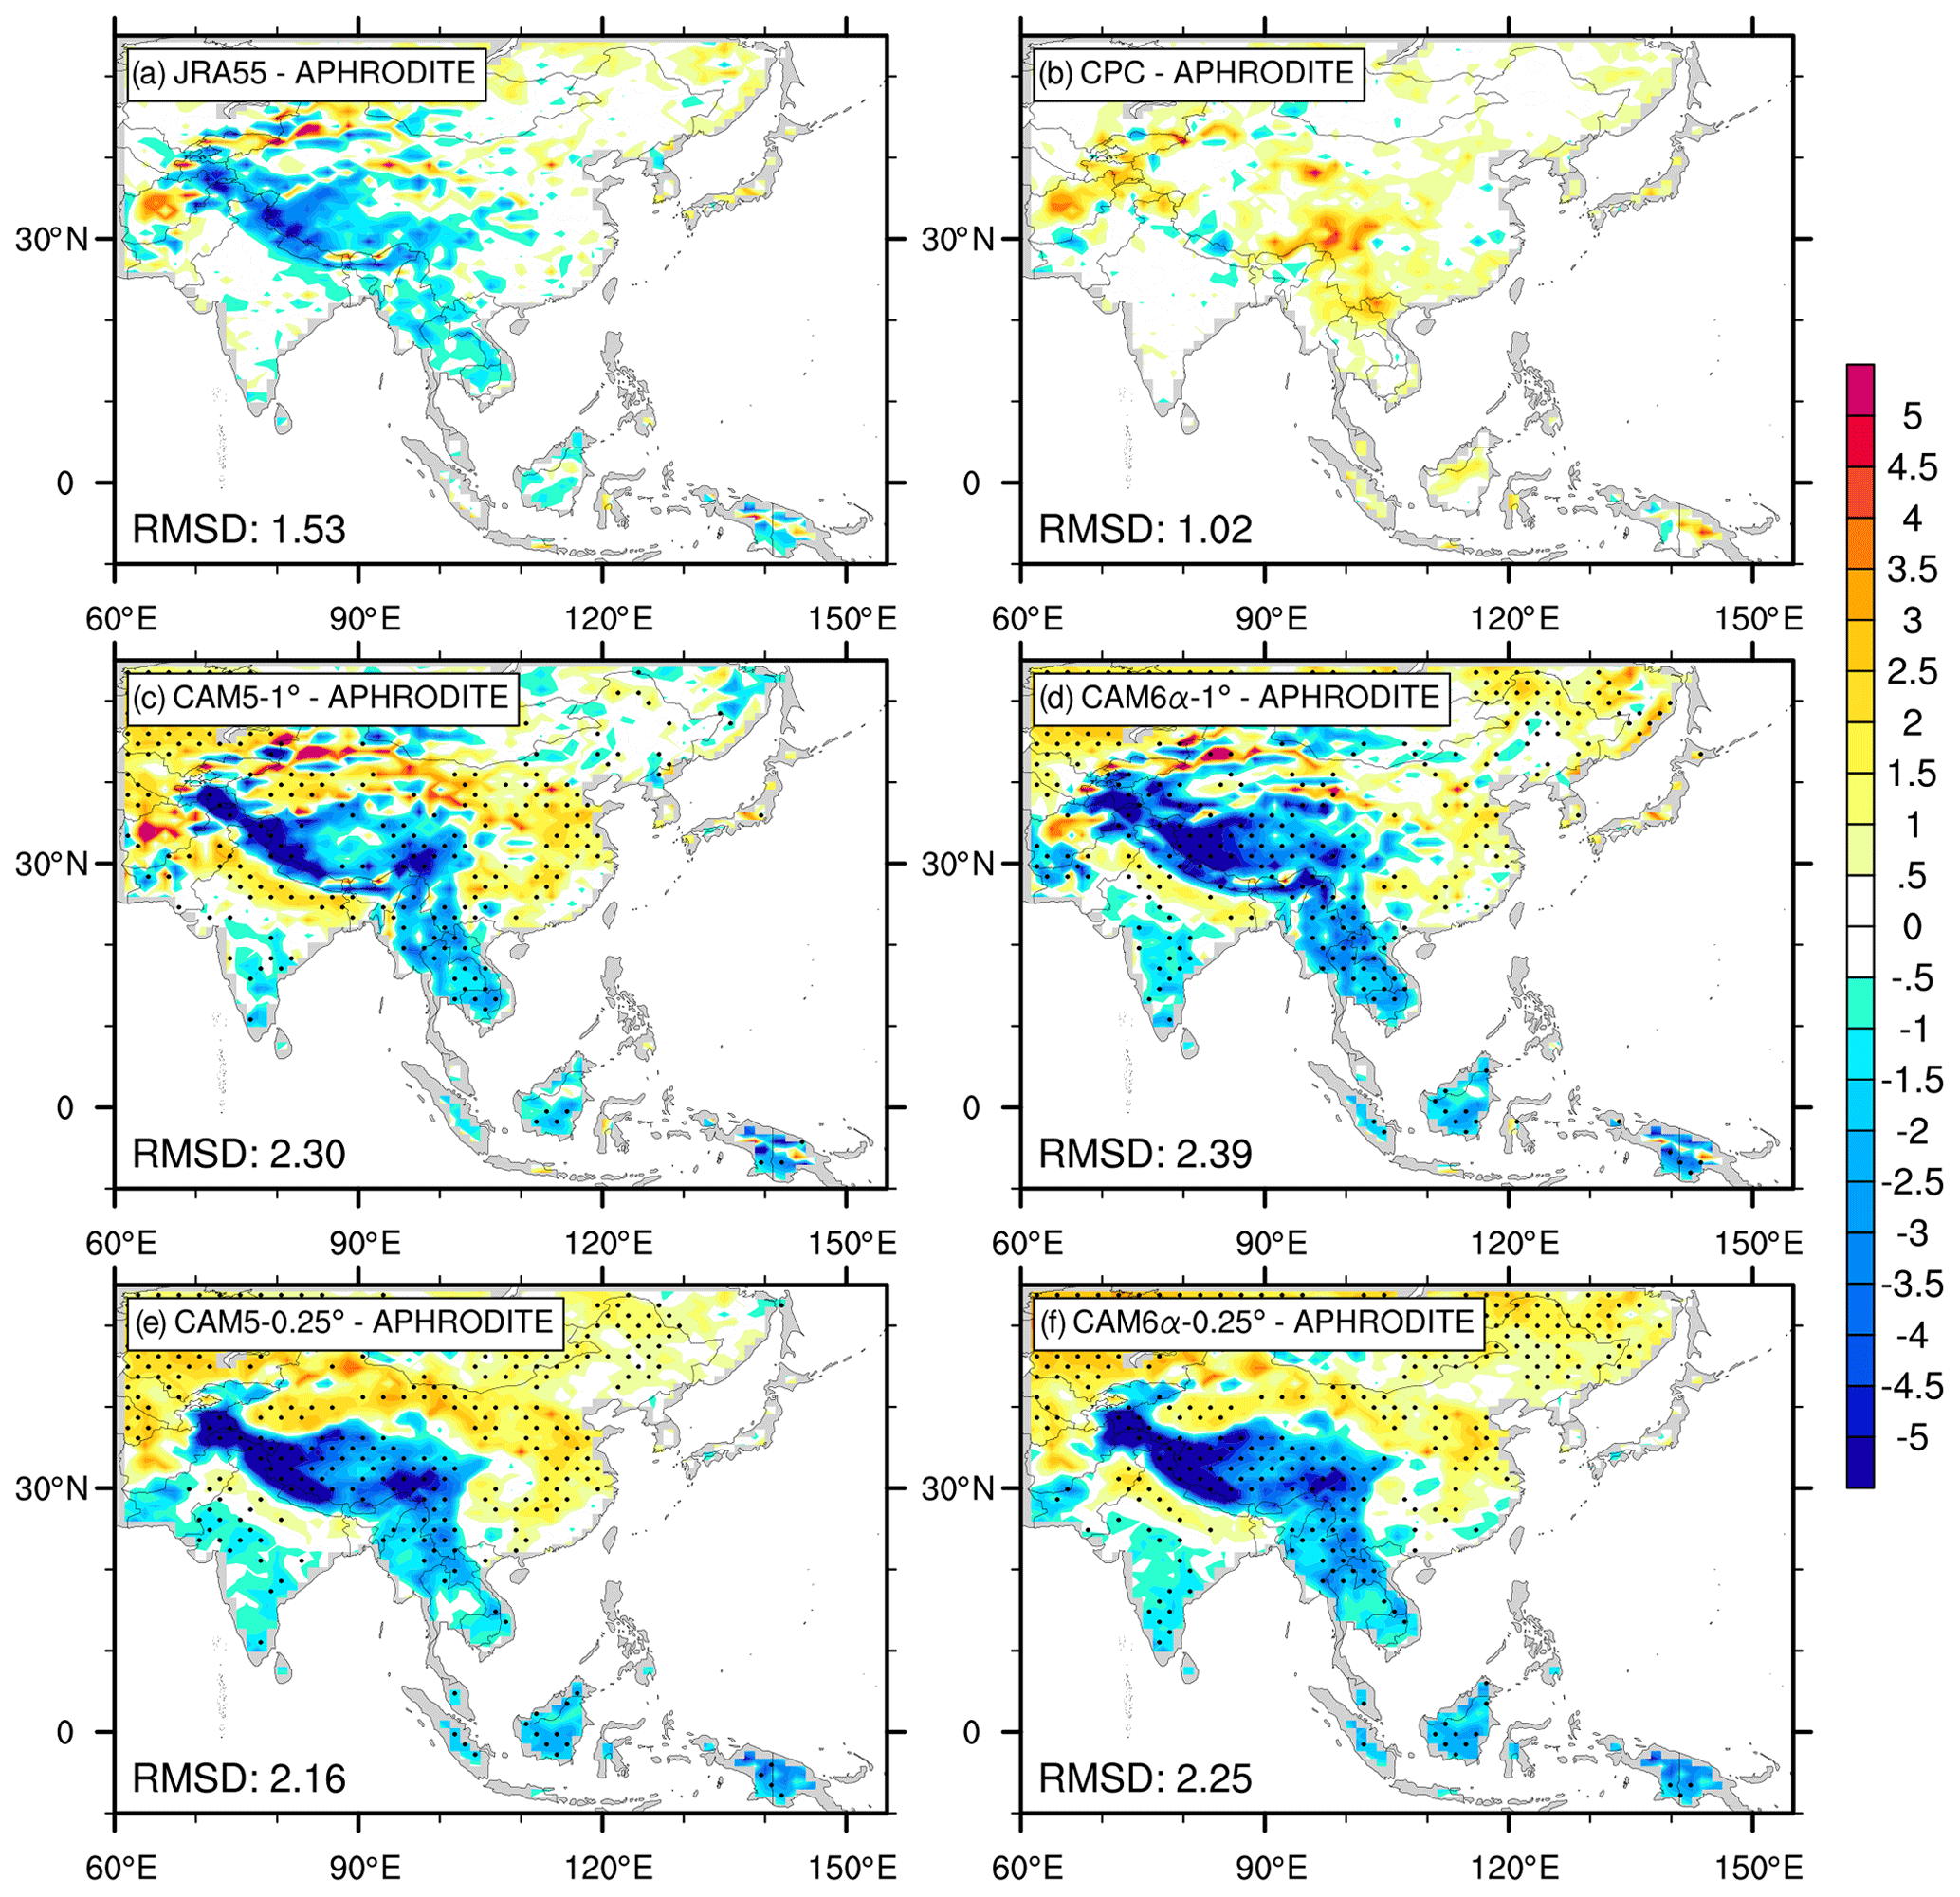
Figure 1The difference of 1980–2004 annual mean surface air temperature (∘) between observations (APHRODITE) and (a) JRA55, (b) CPC, (c) CAM5-1∘, (d) CAM6α-1∘, (e) CAM5-0.25∘ and (f) CAM6α-0.25∘. The values at the lower left of each panel indicate the root mean square difference (RMSD) relative to APHRODITE. Grid points in panels (c–f) are stippled if the absolute difference between the respective model and APHRODITE is larger than that between JRA55 and APHRODITE. All the data were interpolated to 1∘ resolution.
Figure 1 shows the annual mean surface air temperature differences relative to APHRODITE. First note that although they share some common surface measurements, JRA55 and APHRODITE have major differences over the Tibetan Plateau and Southeast Asia regions (Fig. 1a), while the CPC data show large differences (relative to APHRODITE) over the Sichuan province in southwestern China (Fig. 1b). We should not expect an atmospheric numerical model, which is only constrained at the surface by ocean temperature, to have a better agreement with the observational benchmark (APHRODITE here) than the reanalysis product (JRA55), which is fully constrained by both ground and atmospheric observations. Thus, only the regions over which the model–APHRODITE difference is larger than the JRA55–APHRODITE difference are considered “significant” and stippled in Fig. 1c–f.
Similar to the difficulty in capturing the high-elevation temperature in JRA55, there is a warm bias over eastern and southern China and a cool bias over Tibet in the CAM5 simulations (Fig. 1c). The cool bias over the Tibetan Plateau and warm bias over the foothill regions (both the Indian side and the northern edge of the Tibetan Plateau) are a long-standing bias in many global and regional climate models. We note that the bias over the Sichuan province appears to be muted in the high-resolution version (Fig. 1e, f), illustrating the promise of further enhancing the resolution.
Moreover, CAM6α reduces the temperature bias over southern China (Fig. 1c, d). Over the entire domain considered in Fig. 1, the root mean square difference (RMSD) relative to APHRODITE is 2.3∘ for CAM5-1∘, 2.4∘ for CAM6α-1∘, 2.2∘ for CAM5-0.25∘ and 2.3∘ for CAM6α-0.25∘ (note that RMSD for JRA55 is 1.5∘). The RMSD as a regional average quantity is not sufficient to characterize the performance of models that vary at finer scales. Because of this limitation, in the following evaluation for precipitation, we divide East Asia into several regional boxes (Fig. 2).
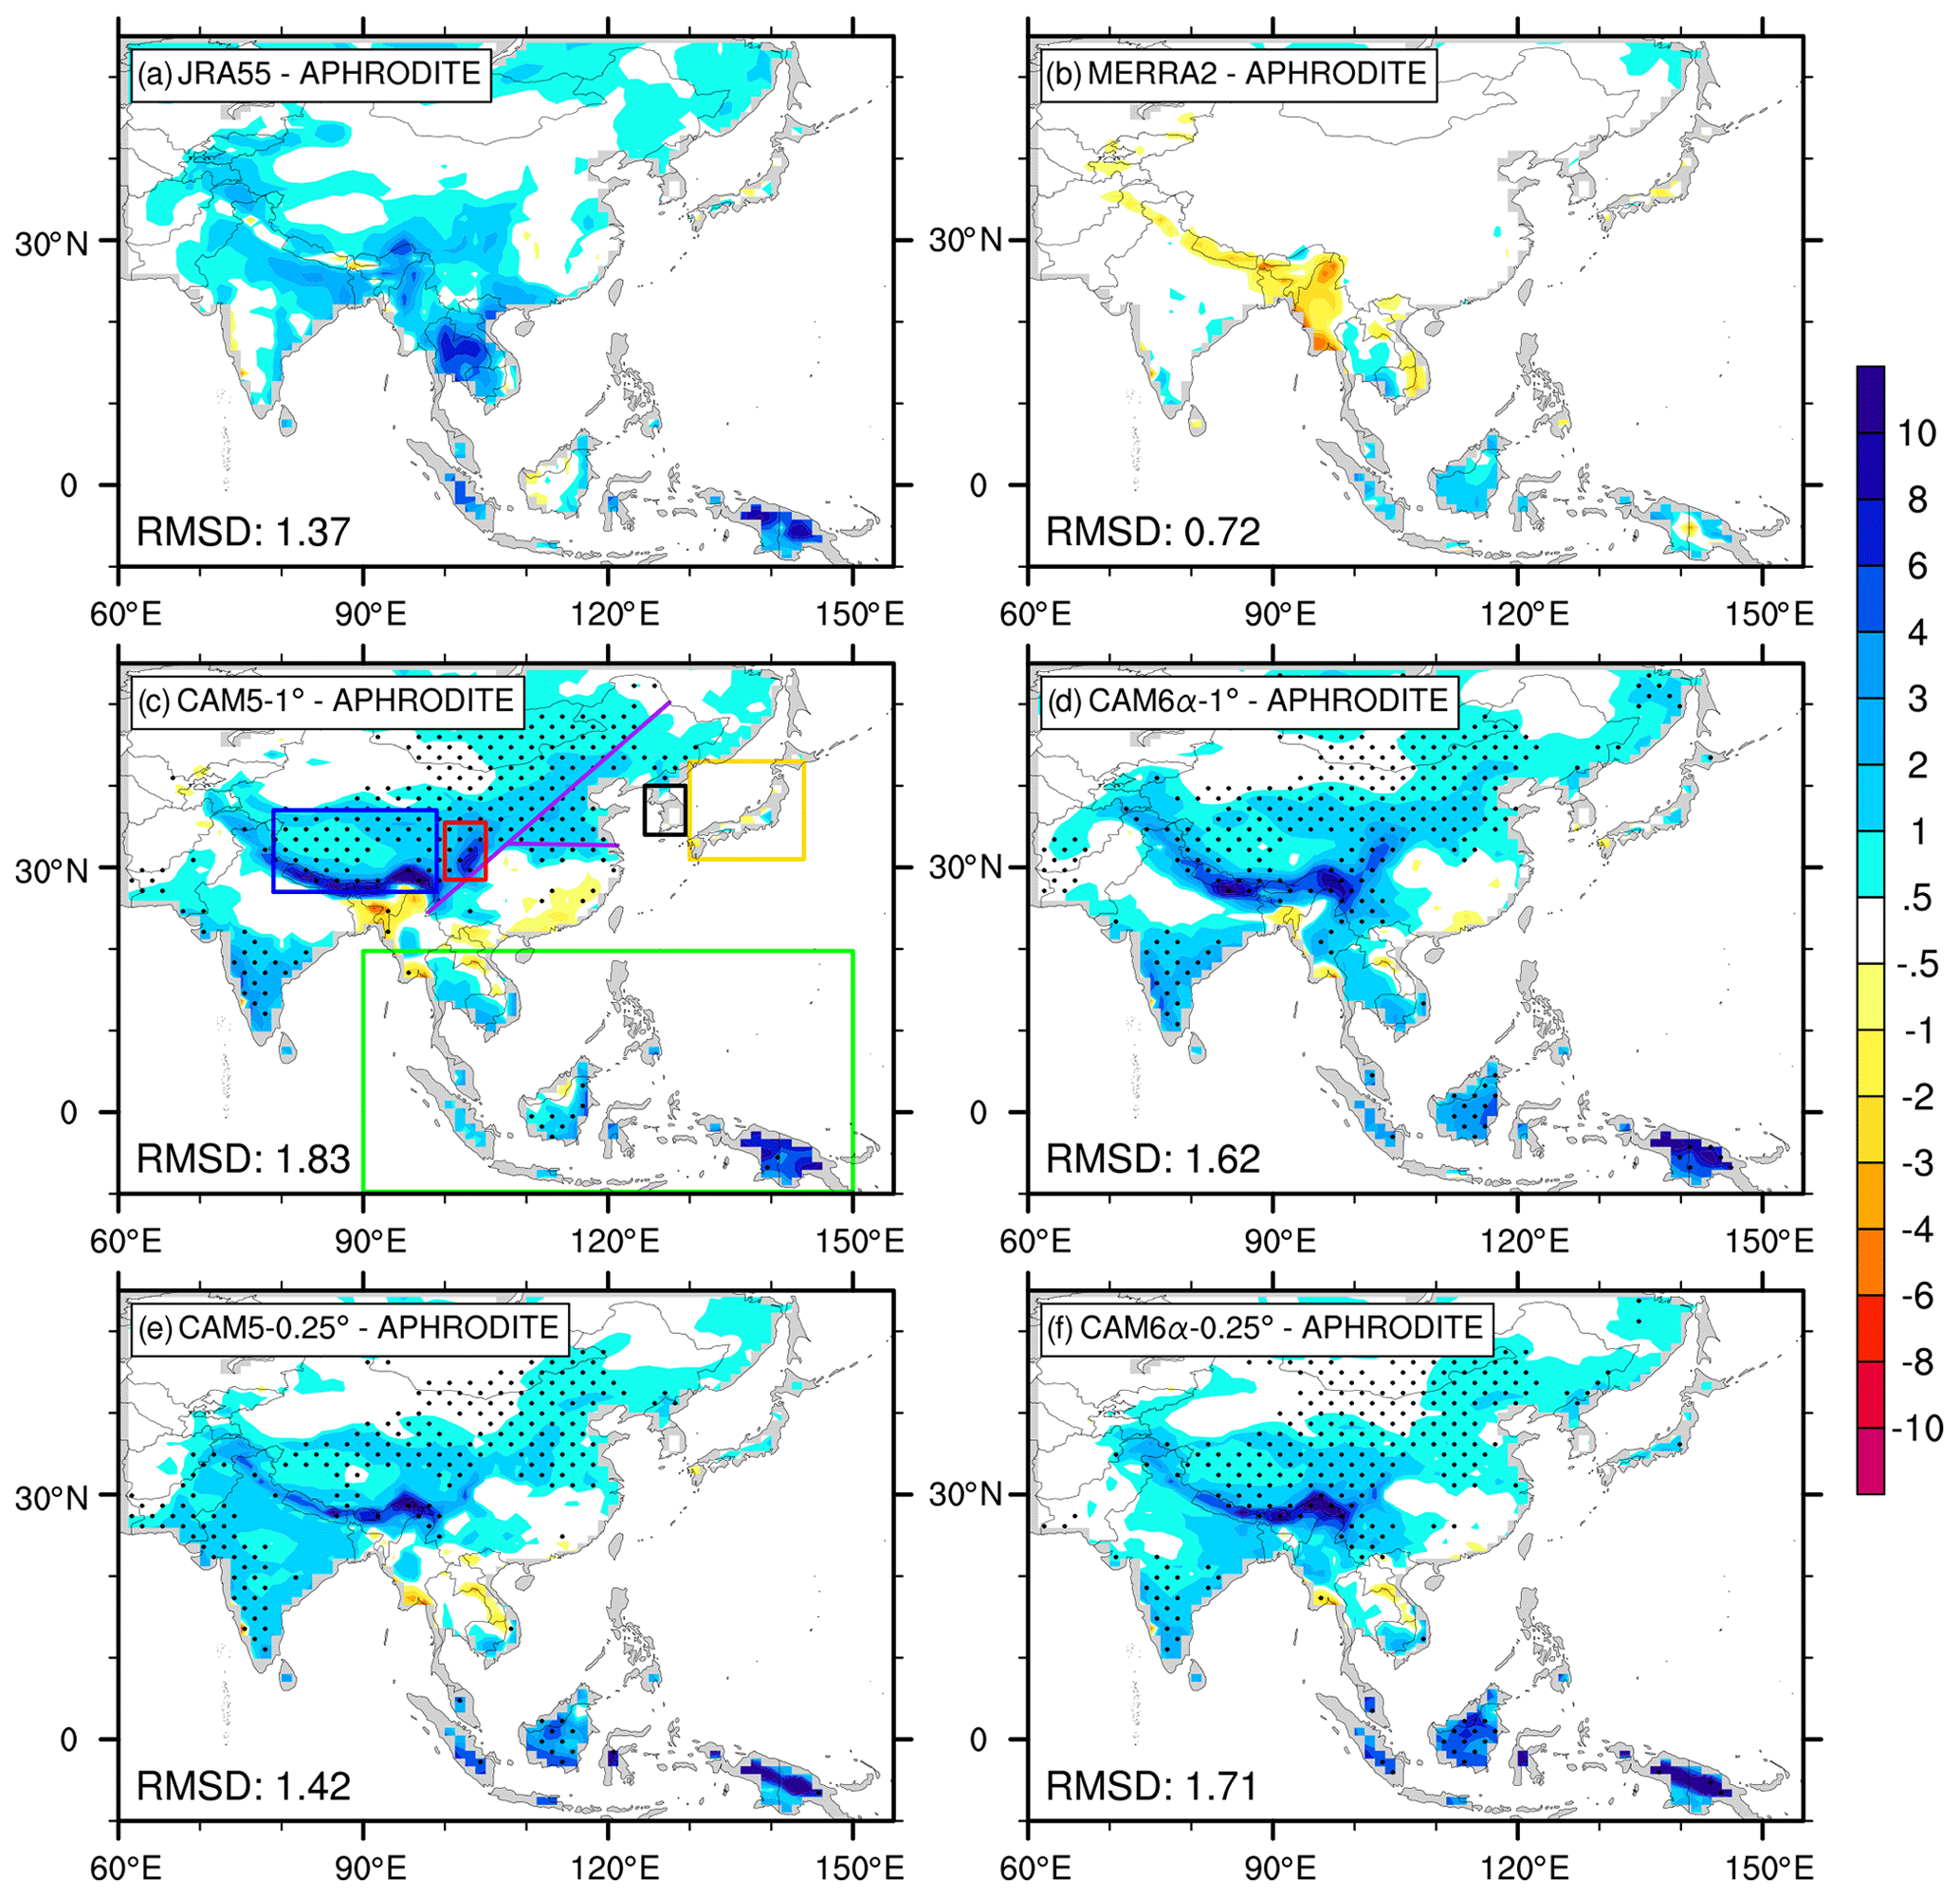
Figure 2The difference of 1980–2004 annual mean precipitation (mm d−1) between APHRODITE and (a) JRA55, (b) MERRA2, (c) CAM5-1∘, (d) CAM6α-1∘, (e) CAM5-0.25∘ and (f) CAM6α-0.25∘. The values at the lower left of each panel indicate the root mean square difference (RMSD) relative to APHRODITE. Grid points in panels (c–f) are stippled when the absolute value of the difference between the model and APHRODITE is larger than that between JRA55 and APHRODITE. All the data were interpolated to 1∘ resolution. The boxes with different colors in Fig. 2c are as follows. (1) Tibet (blue box): 27–37∘ N, 79–99∘ E; (2) southwestern China (red box): 28.5–35.5∘ N, 100–105∘ E; (3) Korea (black box): 34–40∘ N, 124.5–129.5∘ E; (4) Japan (gold box): 31–43∘ N, 130–144∘ E; (5) the Maritime Continent (green box): 9.75∘ S–19.75∘ N, 90–150∘ E. The India average is entirely within mainland India. Northern China and southern China are also defined in Fig. 2c: northern China is north of Qin Mountain and the Huai River at 32.8∘ N, and southern China is south of this. The western boundary of northern China and southern China is a straight line called the Hu–Huanyong line between Heihe (50.2∘ N, 127.5∘ E) and Tengchong (24.5∘ N, 98.0∘ E).
Figure 2 illustrates the climatological precipitation biases relative to APHRODITE. MERRA2 is considered here to be the third “data” source in addition to JRA55 and APHRODITE as an estimate of the large uncertainty of observational datasets (Herold et al., 2015, 2016a, b). All four CAM simulations have a dry bias over southern China and a wet bias over the rest of China, especially the Sichuan basin (near the eastern edge of the Tibetan Plateau) and the Himalayan mountain range that defines the southern edge of the Tibetan Plateau. The precipitation biases in those regions are particularly important for two reasons: (a) many major rivers in East Asia, South Asia and Southeast Asia have their headwaters in those regions; and (b) these regions are also prone to natural hazards such as landslides.
Overall, the CAM6α-1∘ performance is slightly better than CAM5-1∘, and CAM6α-0.25∘ falls in between the 1∘ resolution models (RMSD is 1.83 mm d−1 for CAM5-1∘, 1.62 mm d−1 for CAM6α-1∘ and 1.71 mm d−1 for CAM6α-0.25∘). The CAM5-0.25∘ RMSD (1.42 mm d−1) is better than that of CAM6-0.25∘ due to the lower bias over the Himalayas and Kalimantan (Fig. 2e, f).
Because of large spatial heterogeneity, eight regions are selected to evaluate precipitation. Five domains are shown as colored boxes in Fig. 2c: (1) Tibet: 27–37∘ N, 79–99∘ E; (2) southwestern China: 28.5–35.5∘ N, 100–105∘ E; (3) Korea: 34–40∘ N, 124.5–129.5∘ E; (4) Japan: 31–43∘ N, 130–144∘ E; (5) the Maritime Continent: 9.75∘ S–19.75∘ N, 90–150∘ E. Only the land within these boxes is considered in this study. The other three are India, northern China and southern China. The India average is entirely within mainland India. Northern China and southern China are also defined in Fig. 2c: northern China is north of Qin Mountain and the Huai River at 32.8∘ N, and southern China is south of this. The western boundary of northern China and southern China is a straight line called the Hu–Huanyong line between Heihe (50.2∘ N, 127.5∘ E) and Tengchong (24.5∘ N, 98.0∘ E).
Figure 3 shows the RMSD and mean bias (taking the domain average of a respective model simulation or data products minus APHRODITE) of annual mean precipitation for nine selected regions. Note that over a few selected regions, the model performance is as good as the reanalysis (such as over Japan, Korea and southern China) and thus we will not further investigate model improvements. Among regions where CAM versions perform poorly compared with reanalyses (southwestern China, Tibet, India, northern China and the Maritime Continent), the CAM6α-1∘ performance (RMSD) is better (lower) than CAM5-1∘ for Tibet, southwestern China and northern China, but it gets worse for the Maritime Continent. Notably, CAM6α-0.25∘ is closer to observations over southwestern China and northern China, but it also gets considerably worse for the Maritime Continent (with a large RMSD of 7.2 mm d−1 and a bias of 4.0 mm d−1). Both CAM versions with higher resolution simulate the climatological precipitation over northern China better. Increasing model resolution decreases the RMSD and bias of CAM5 over Tibet and southwestern China, while it increases those of CAM6 (Fig. 3).
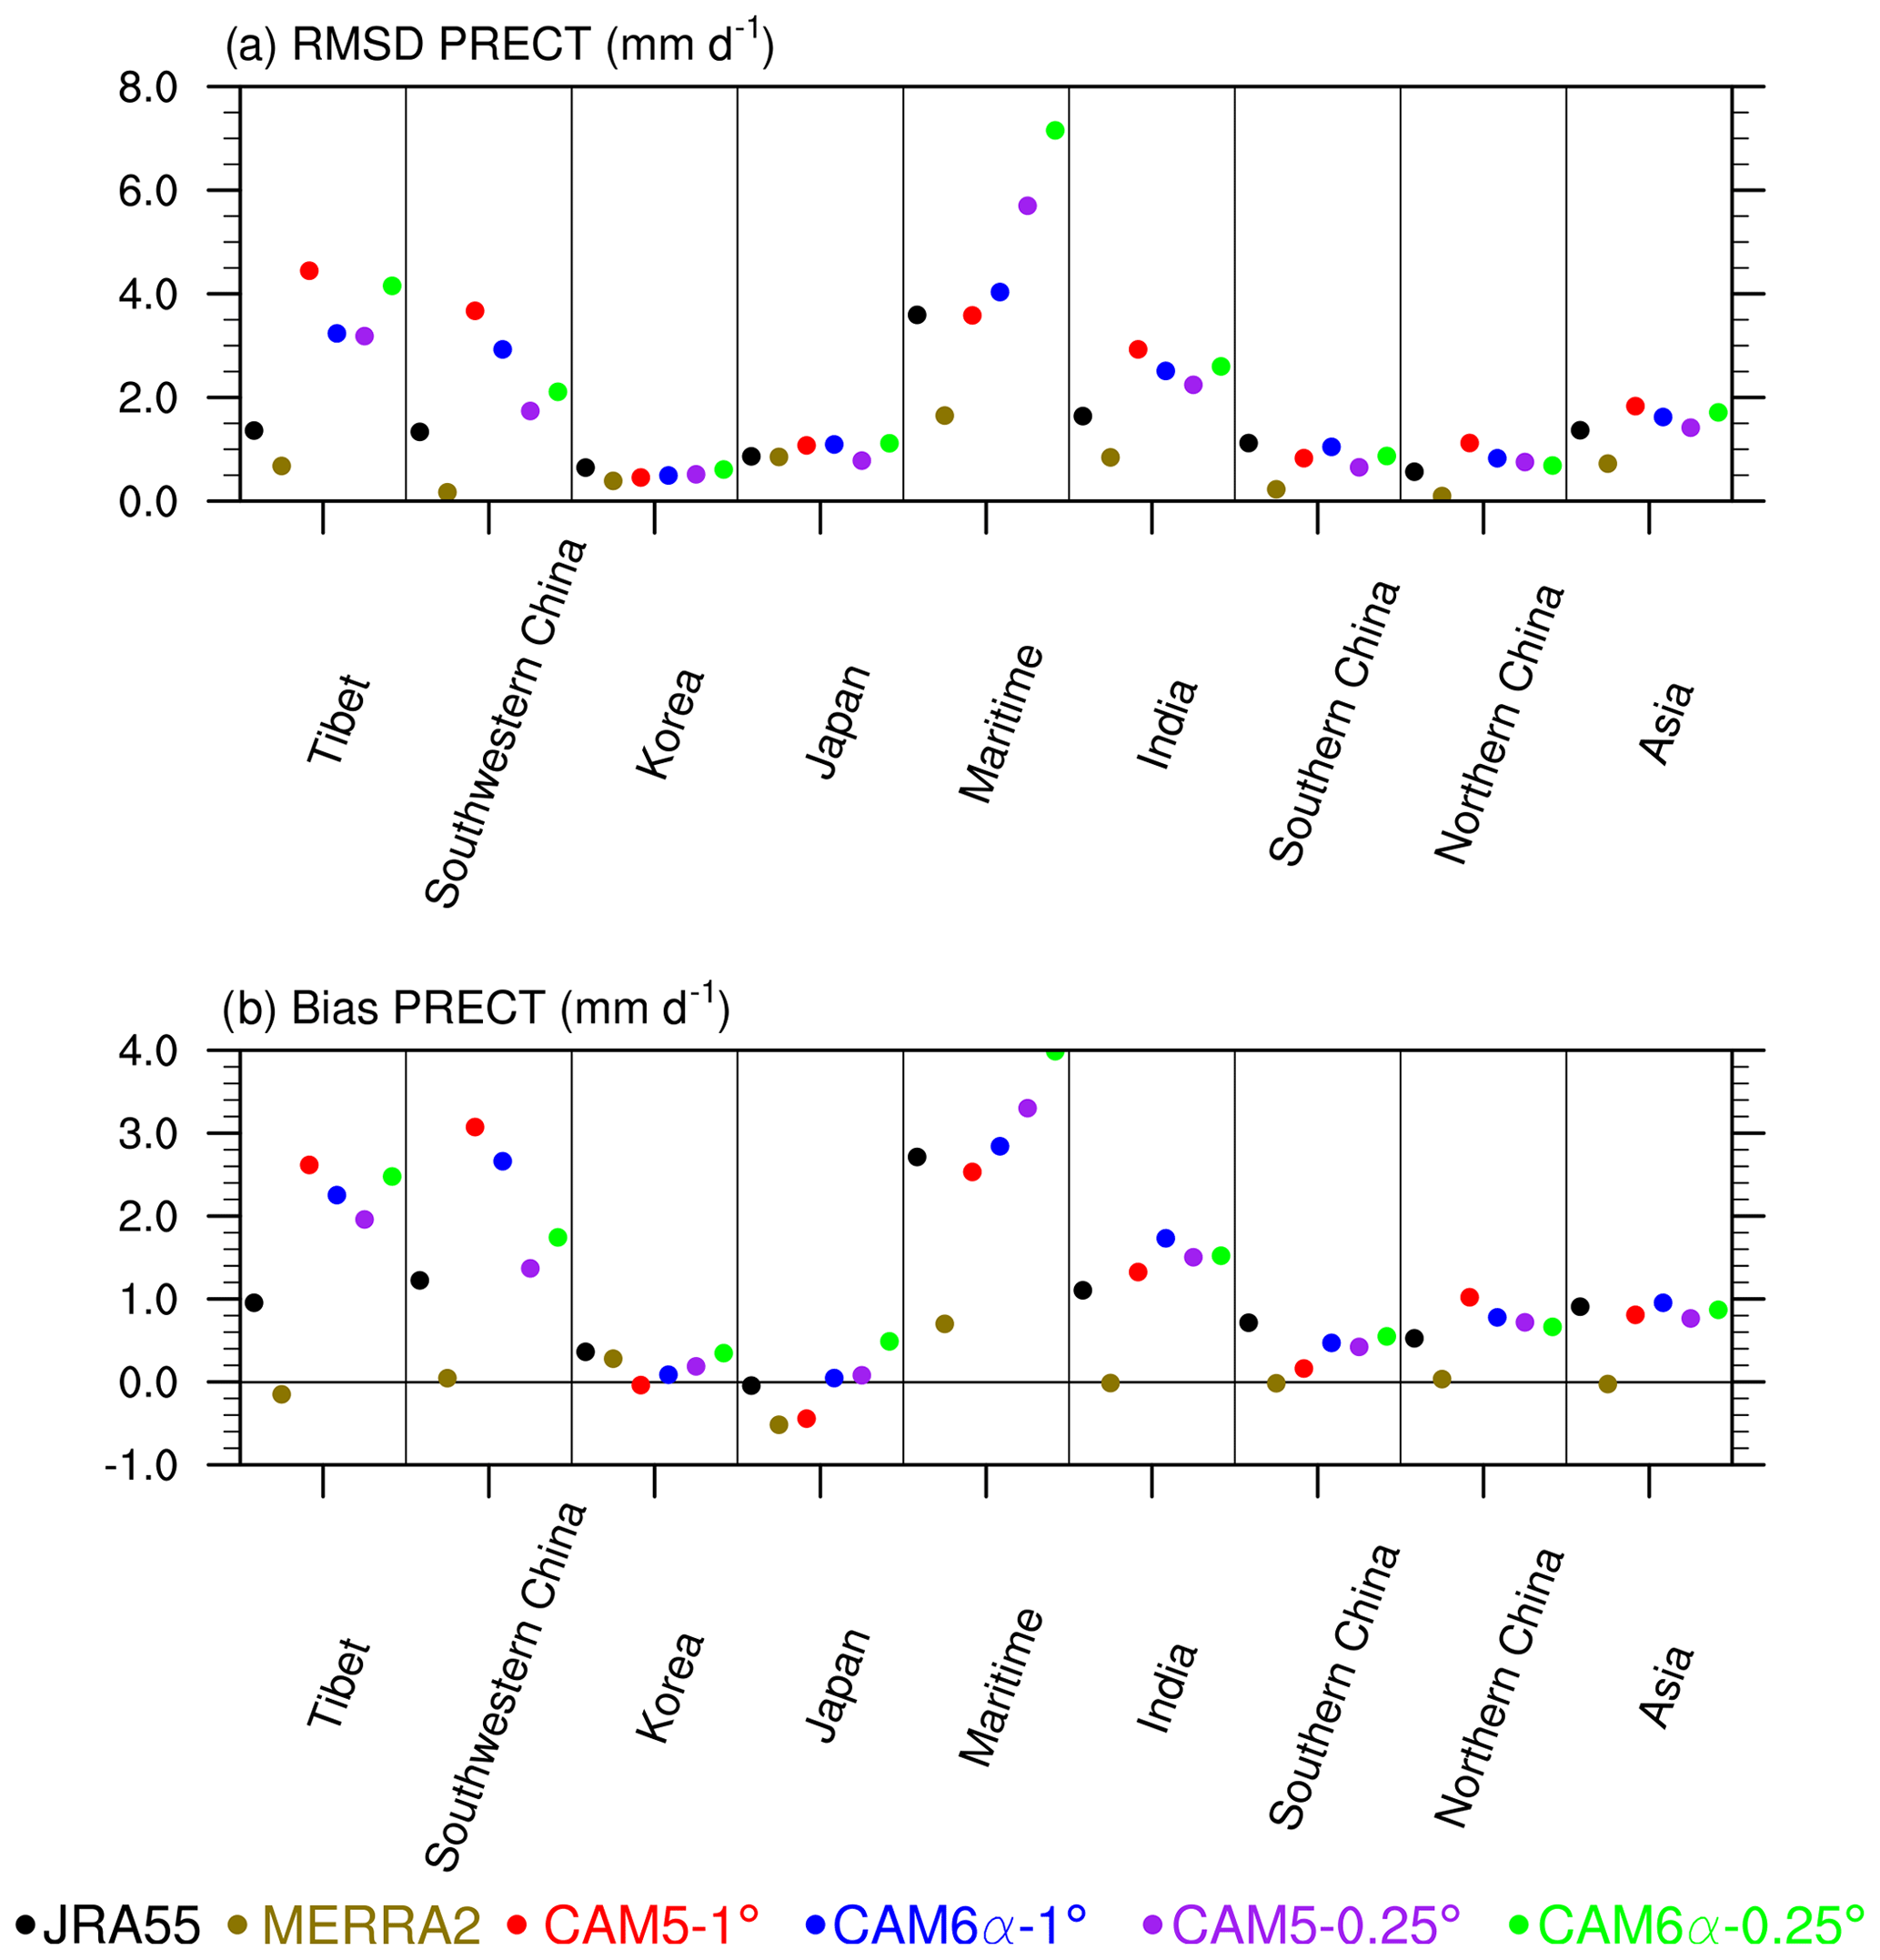
Figure 3The root mean square difference (RMSD) and bias of annual mean precipitation (PRECT, mm d−1) relative to APHRODITE for JRA55, MERRA2, CAM5-1∘, CAM6α-1∘, CAM5-0.25∘ and CAM6α-0.25∘ over six regions: Tibet: 27–37∘ N, 79–99∘ E; southwestern China: 28.5–35.5∘ N, 100–105∘ E; Korea: 34–40∘ N, 124.5–129.5∘ E; Japan: 31–43∘ N, 130–144∘ E; Maritime: 9.75∘ S–19.75∘ N, 90–150∘ E; Asia: 5–55∘ N, 60–140∘ E. Three other domains follow the geographical boundary and climatic zones for India, northern China and southern China as in Lin et al. (2018). The India average is entirely within mainland India. The western boundary of northern China and southern China is a straight line (shown in Fig. 2c) called the Hu–Huanyong line between Heihe (50.2∘ N, 127.5∘ E) and Tengchong (24.5∘ N, 98.0∘ E). The separation of northern China and southern China (shown as the straight line in Fig. 2c) is along the latitude of Qin Mountain and the Huai River (32.8∘ N).
We will explore the details that might lead to the progressive improvement over southwestern China and northern China and the poor performance of CAM6-0.25∘ over the Maritime Continent in Sect. 5.
We next assess the model performance in simulating convective and large-scale precipitation components separately. The ratio of convective to large-scale precipitation is a useful diagnostic because both convective activity and large-scale instability can lead to precipitation in this model. Most atmospheric models use convective parameterizations to represent the effects of sub-grid-scale convective processes, with reduced-complexity microphysics (Zhang and McFarlane, 1995; Kooperman et al., 2016). The convective precipitation in CAM5 includes shallow and deep convective precipitation. In CAM6 the shallow convective regime is handled by CLUBB coupled to stratiform microphysics, and hence shallow convective precipitation is prognostic and part of the large-scale precipitation.
The latent heating required by the atmosphere imposes an important constraint on the amount of mean rainfall, but model horizontal resolution and parameter settings dictate the timescales (Gustafson Jr. et al., 2014). CAM6 estimates shallow convective precipitation from the prognostic calculations in CLUBB (which have memory between time steps of turbulent motion) rather than diagnostically representing the effects of sub-grid-scale convective processes at each location and time step. One of the reasons why the simulated rainfall intensity is expected to improve when the model is run at higher resolution is that the variance of sub-grid-scale humidity and thermodynamics drops, and the parameterized sub-grid-scale processes (such as sub-grid-scale turbulence with CLUBB) are better separated into regimes (Kopparla et al., 2013).
Figure 4 illustrates the ratio of convective (PRECC) to large-scale (PRECL) precipitation. This ratio (PRECC ∕ PRECL) is greater over the ocean than over the land, as expected. CAM6α-1∘ has a larger ratio over the tropics compared to CAM5-1∘. CAM6α-0.25∘ simulated a lower ratio than CAM6α-1∘ (Fig. 4b) and a similar pattern as CAM5-0.25∘ (Fig. 4c).
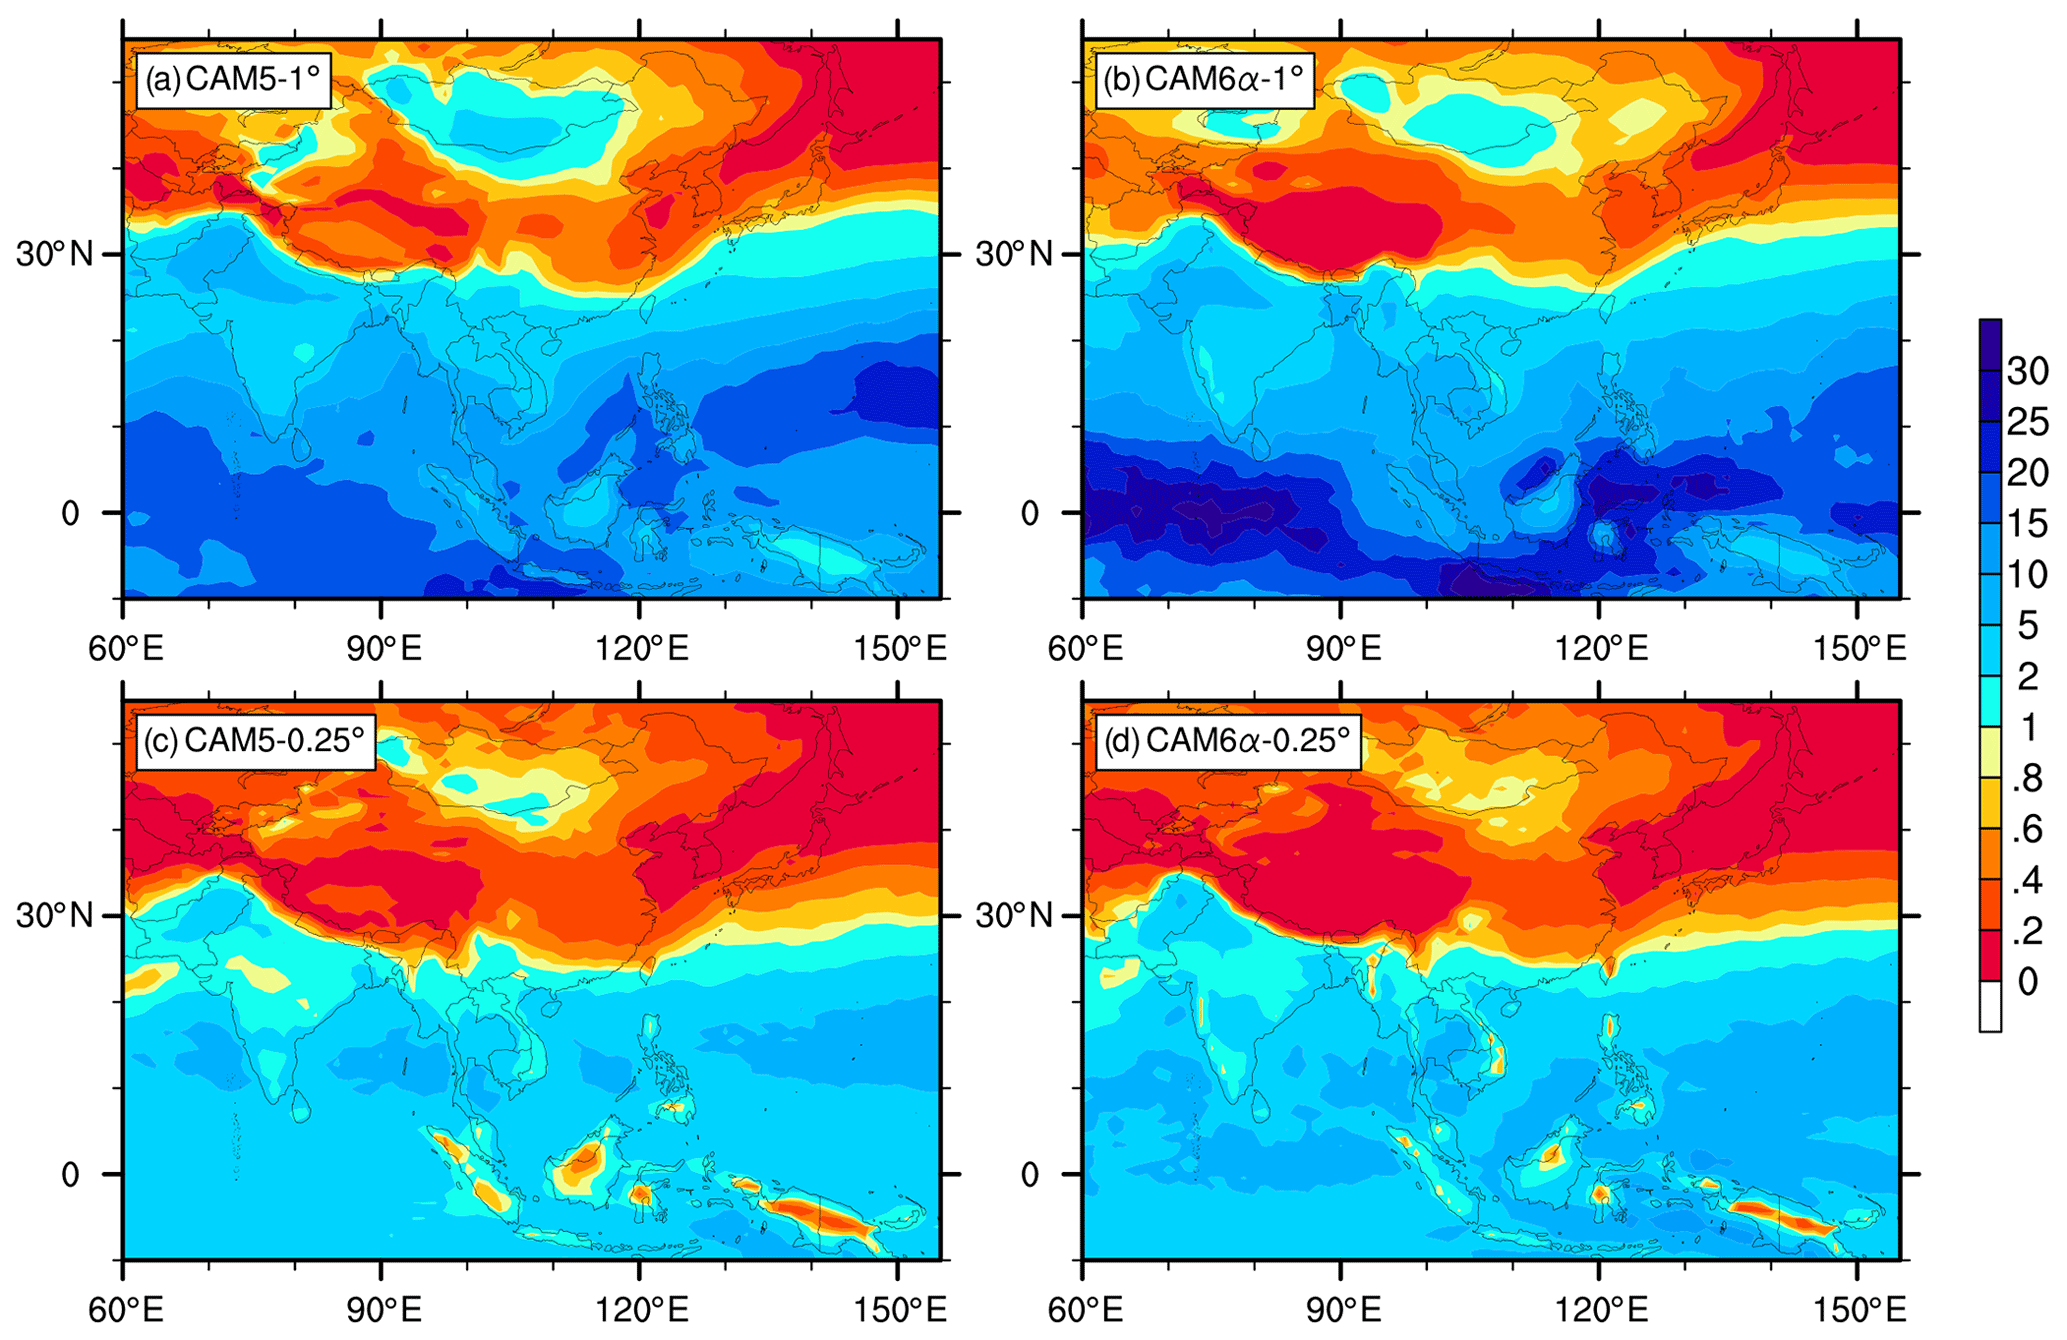
Figure 4The 1980–2004 convective to large-scale precipitation ratio (unitless) for (a) CAM5-1∘, (b) CAM6α-1∘, (c) CAM5-0.25∘ and (d) CAM6α-0.25∘.
Higher-horizontal-resolution models tend to simulate higher vertical velocities (Gettelman et al., 2018) and a lower ratio of convective to total rainfall. A larger fraction of precipitation can be resolved as a consequence of large-scale flow, limiting the need to invoke sub-grid convective schemes. Increasing resolution also better resolves topographic and surface effects, and it separates regimes as sub-grid-scale variance is reduced, particularly in the thermodynamic variables. With a fixed amount of precipitable water, more condensation caused by the stratiform scheme means less is available for convective precipitation, so the ratio becomes lower.
The compensation above is a feature of the physical parameterization suite in CAM due to the timescale. Large-scale liquid condensation by resolved-scale cloud schemes (CLUBB and microphysics) instantaneously condenses all vapor in excess of liquid saturation to cloud liquid. In contrast, the deep convective parameterization has a timescale that produces mass flux and precipitation at a defined rate. Note that as the time step gets shorter, the mass flux and precipitation over a time step will decrease, which is the major reason for the decrease in deep convective precipitation in CAM6. The large-scale condensation (including shallow convection and cloud microphysics) does more as the time step changes, while the deep convective parameterization does less (Gettelman et al., 2018).
Figure 5 uses Taylor diagrams (Taylor, 2001) to evaluate the simulation of annual and seasonal surface air temperature, mean precipitation and two metrics of extreme precipitation. Red circles show the results from CAM5-1∘, with blue for CAM6α-1∘ and green for CAM6α-0.25∘. Movement closer to the point of (1.0,1.0) in the Taylor diagrams indicates improvement of the simulation relative to APHRODITE. For example, the model circles are very close to the blue circles representing JRA55 for near-surface (2 m) temperature (TREFHT) (Fig. 5a), which indicates good performance for surface air temperature for all three models. The annual and seasonal precipitation (PRECT) correlations of the two CAM6α simulations are around 0.8, while the annual correlation of CAM5-1∘ is 0.7 (Fig. 5b). The CAM6α-0.25∘ root mean square (RMS) is bigger than that of CAM6α-1∘ (green circles relative to blue circles in Fig. 5b). The maximum daily precipitation during each month of a year (RX1day) of CAM6α-1∘ performs better than CAM5 (blue circles relative to red circles in Fig. 5c). The number of heavy precipitation days (R10) has large differences among the observational and reanalysis data (black and gold circles in Fig. 5d). CAM6α has higher correlation coefficients with APHRODITE (∼0.8) than CAM5 (∼0.7).
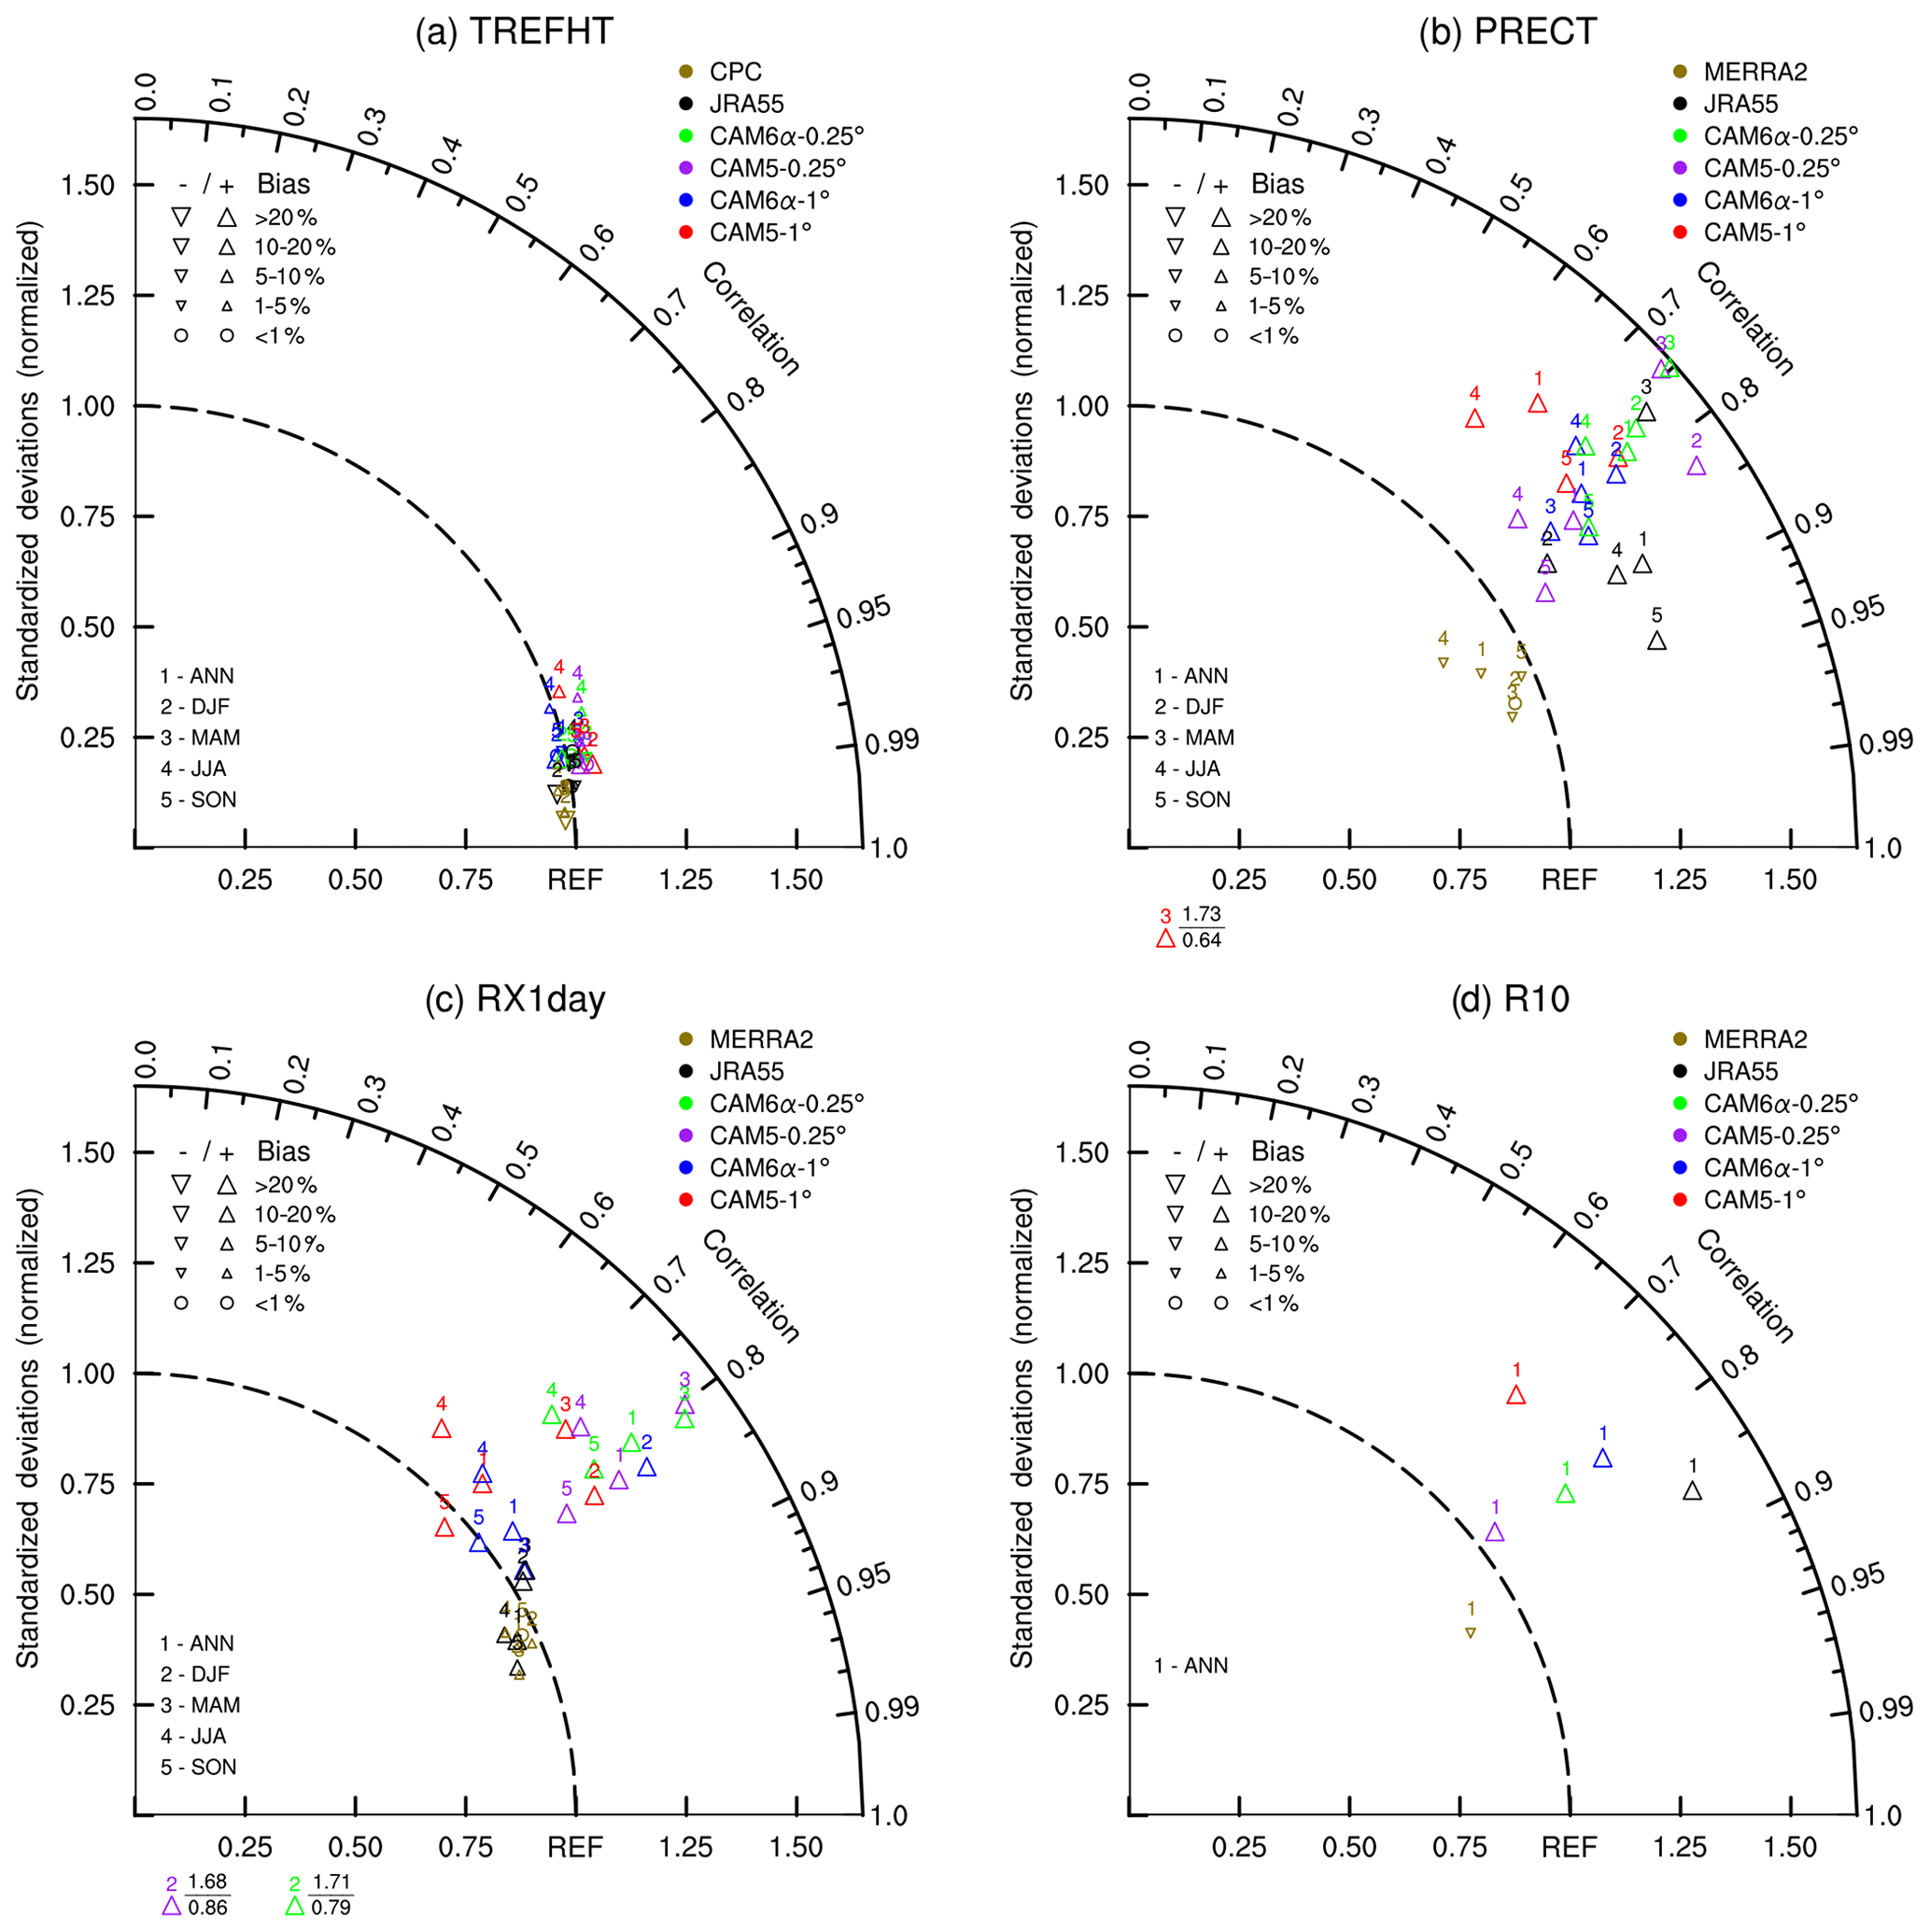
Figure 5Taylor diagrams for (a) surface air temperature, (b) precipitation, (c) RX1day (the maximum daily precipitation during each month of a year; mm d−1) and (d) R10 (number of days with precipitation more than 10 mm; units: days). These two extreme indices are suggested by the Expert Team for Climate Change Detection and Indices (Zhang et al., 2011). Note that R10, by design, only has an annual mean but not a seasonal mean. Spatial correlations and normalized RMS (root mean square) are calculated for ANN (1, annual), DJF (2, winter), MAM (3, spring), JJA (4, summer) and SON (5, fall). APHRODITE is used as the benchmark over Asia for 1980–2004. All the data were interpolated to 1∘ resolution.
Overall, CAM6α versions perform better than CAM5-1∘ for the mean precipitation (Fig. 5b), maximum daily precipitation and number of heavy precipitation days (Fig. 5c, d). Although CAM6α-0.25∘ performs worse than 1∘ for the mean precipitation and RX1day (green circles relative to blue circles in Fig. 5b and c), mostly due to the bias over the Maritime Continent (defined as 9.75∘ S–19.75∘ N, 90–150∘ E), CAM6α-0.25∘ performs better for R10 (Fig. 5d). All three model versions show that precipitation bias in JJA is bigger than other seasons (Fig. 5b, c).
In this section, we evaluate simulated rainfall variability across a wide range of timescales. This serves as a useful test of model performance because it is difficult to improve model performance in simulating temporal variability, as opposed to the climatological average, based on the simple tuning of one or more parameters. Moreover, it is expected that CAM6 will be widely used to study climate variability at various timescales.
4.1 Variability of precipitation due to PDO, ENSO and East Asian summer monsoon index
The Pacific Decadal Oscillation (PDO) represents variability in the tropical and extratropical North Pacific at interdecadal timescales that significantly impact climate (Mantua et al., 1997; Meehl et al., 2013). Figure 6 shows a regression of observed and simulated annual precipitation against the PDO index, derived from the leading principal component of monthly SST anomalies in the North Pacific Ocean (Mantua et al., 1997). A common feature as revealed in the observational records is the drying tendency over Indochina (e.g., Thailand) during positive PDO phases. This feature is well represented in all four CAM versions. Similarly, a wet anomaly over most of India during positive PDO is also captured in all CAM versions. In contrast, the wet anomaly over southern China is simulated well in the CAM6-0.25∘ version, while the opposite anomaly is seen in CAM6α-1∘ and CAM5-0.25∘.
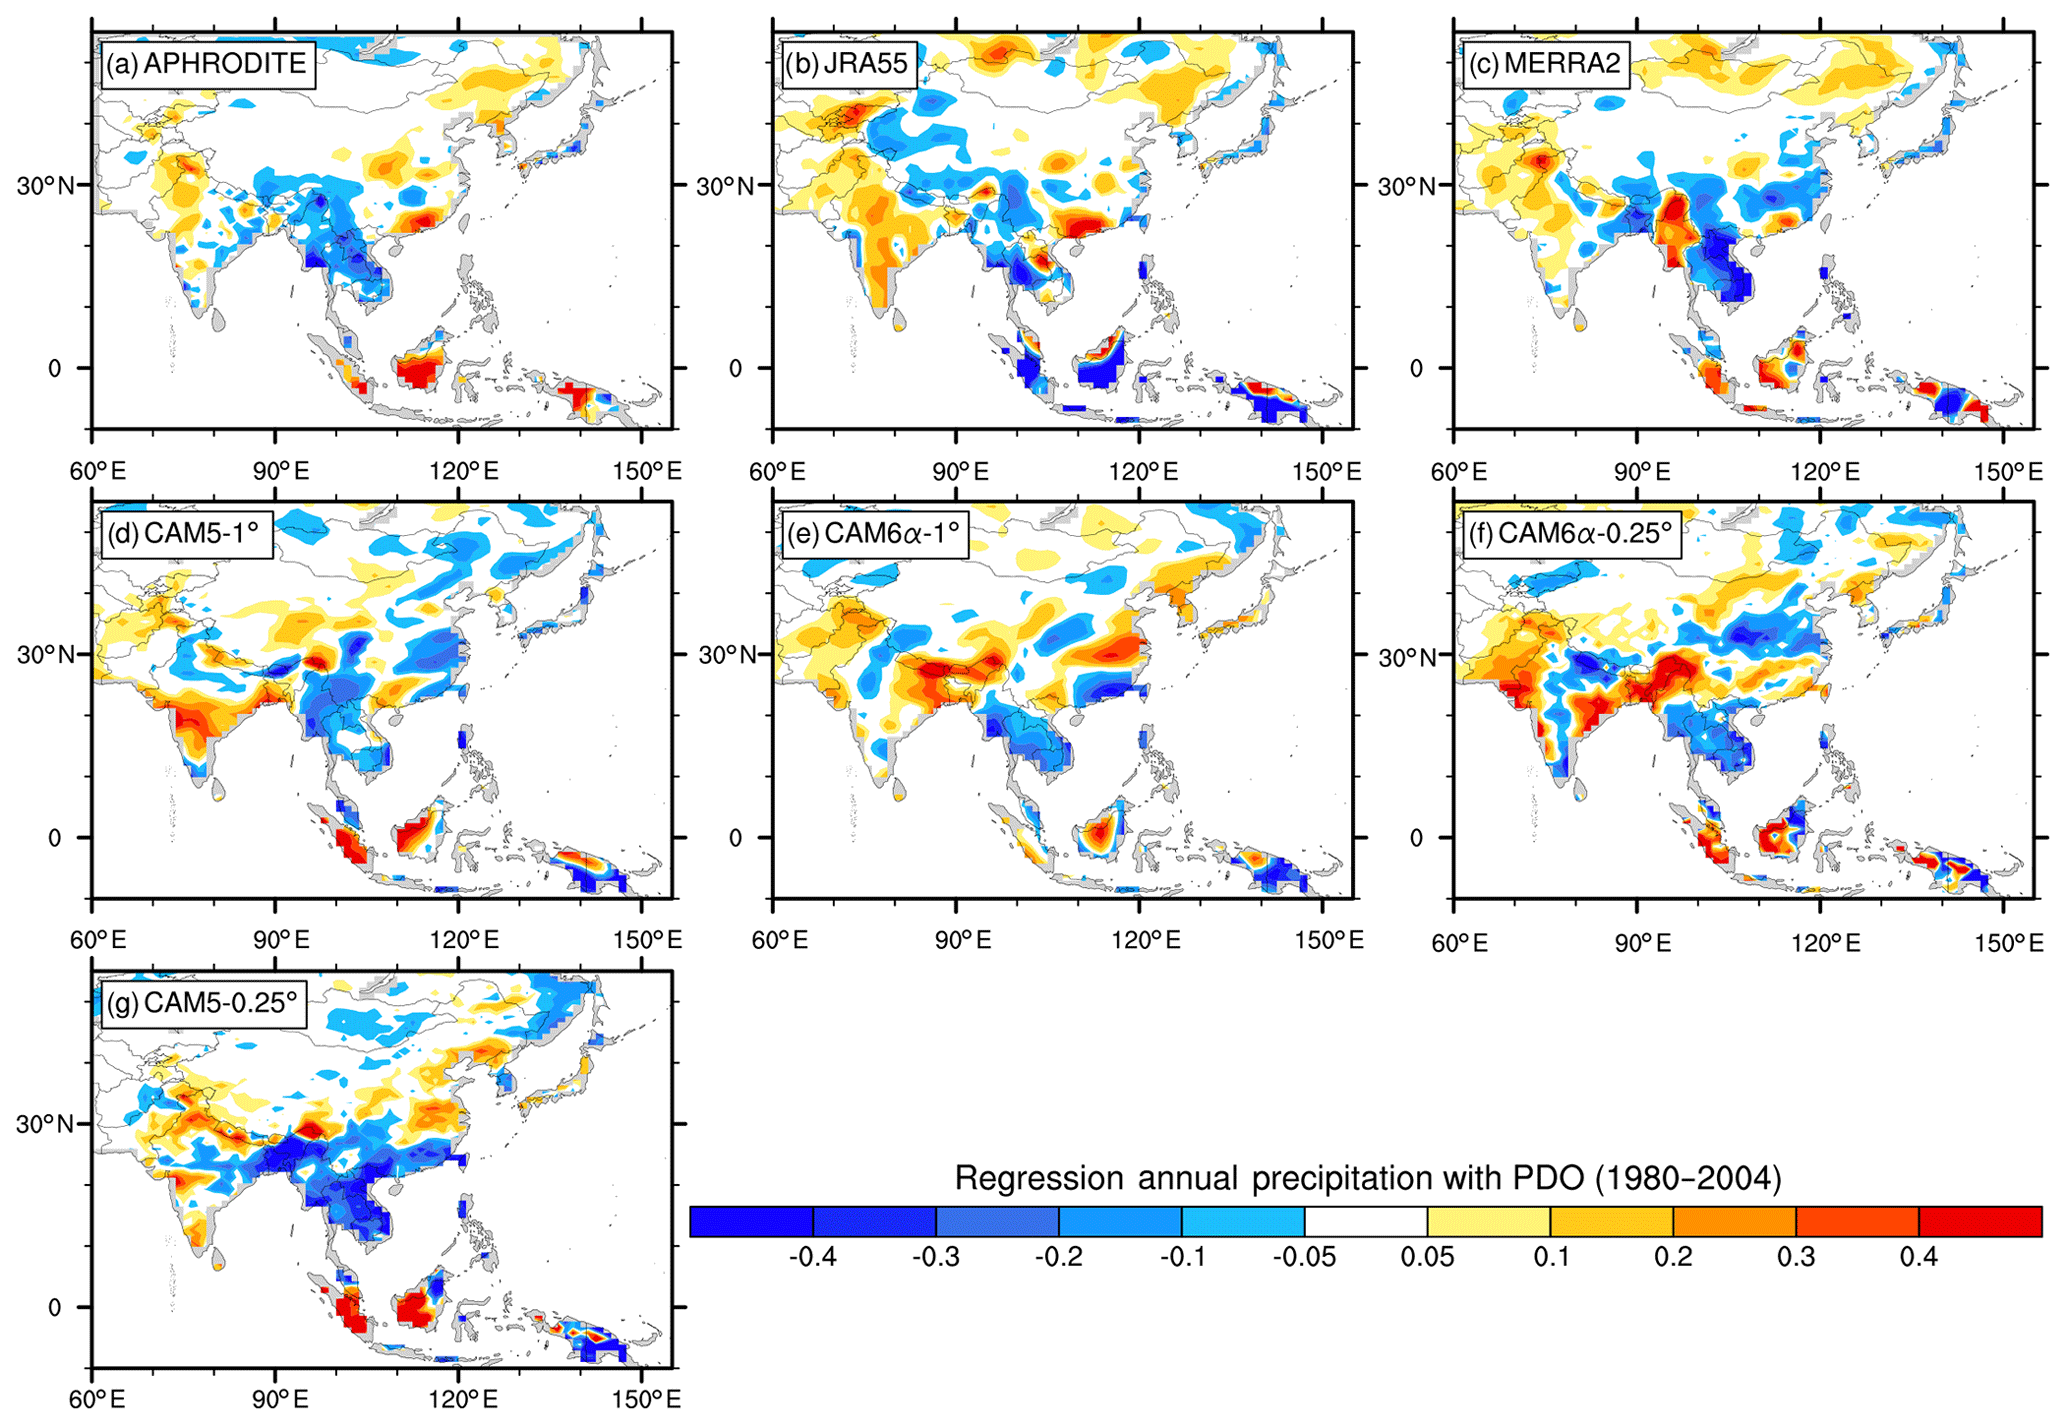
Figure 6Regression of annual mean precipitation (mm d−1) onto observed PDO indices for 1980–2004.
The El Niño–Southern Oscillation (ENSO) plays a central role in ocean–atmosphere coupled interannual variability. CAM5 has been widely used to study ENSO impacts over Asia (Chen et al., 2018; Hoell et al., 2016). Figure 7a–g show the regression coefficients between annual mean precipitation and ENSO. The ENSO index is the cold tongue index following Deser and Wallace (1987). Both 1∘ CAM5 and CAM6α (Fig. 7d, e) capture the observed wet anomaly over Pakistan and Afghanistan and the dry anomaly over Indonesia. However, we find that the drying tendency over southern China during El Niño years (the upper row of Fig. 7) is completely missing in CAM5 but starts to emerge in CAM6α-1∘ and gets better in CAM6α-0.25∘. The influence of ENSO on boreal summer monsoon rainfall over Asia is well known. Figure 7h–n show the regression coefficients between JJA precipitation and ENSO. Those patterns are similar when the analysis is done with annual mean precipitation but with a weaker correlation of annual precipitation and ENSO. Our results here thus call into question the fidelity of previous ENSO studies on hydroclimate over southern China using CAM5.
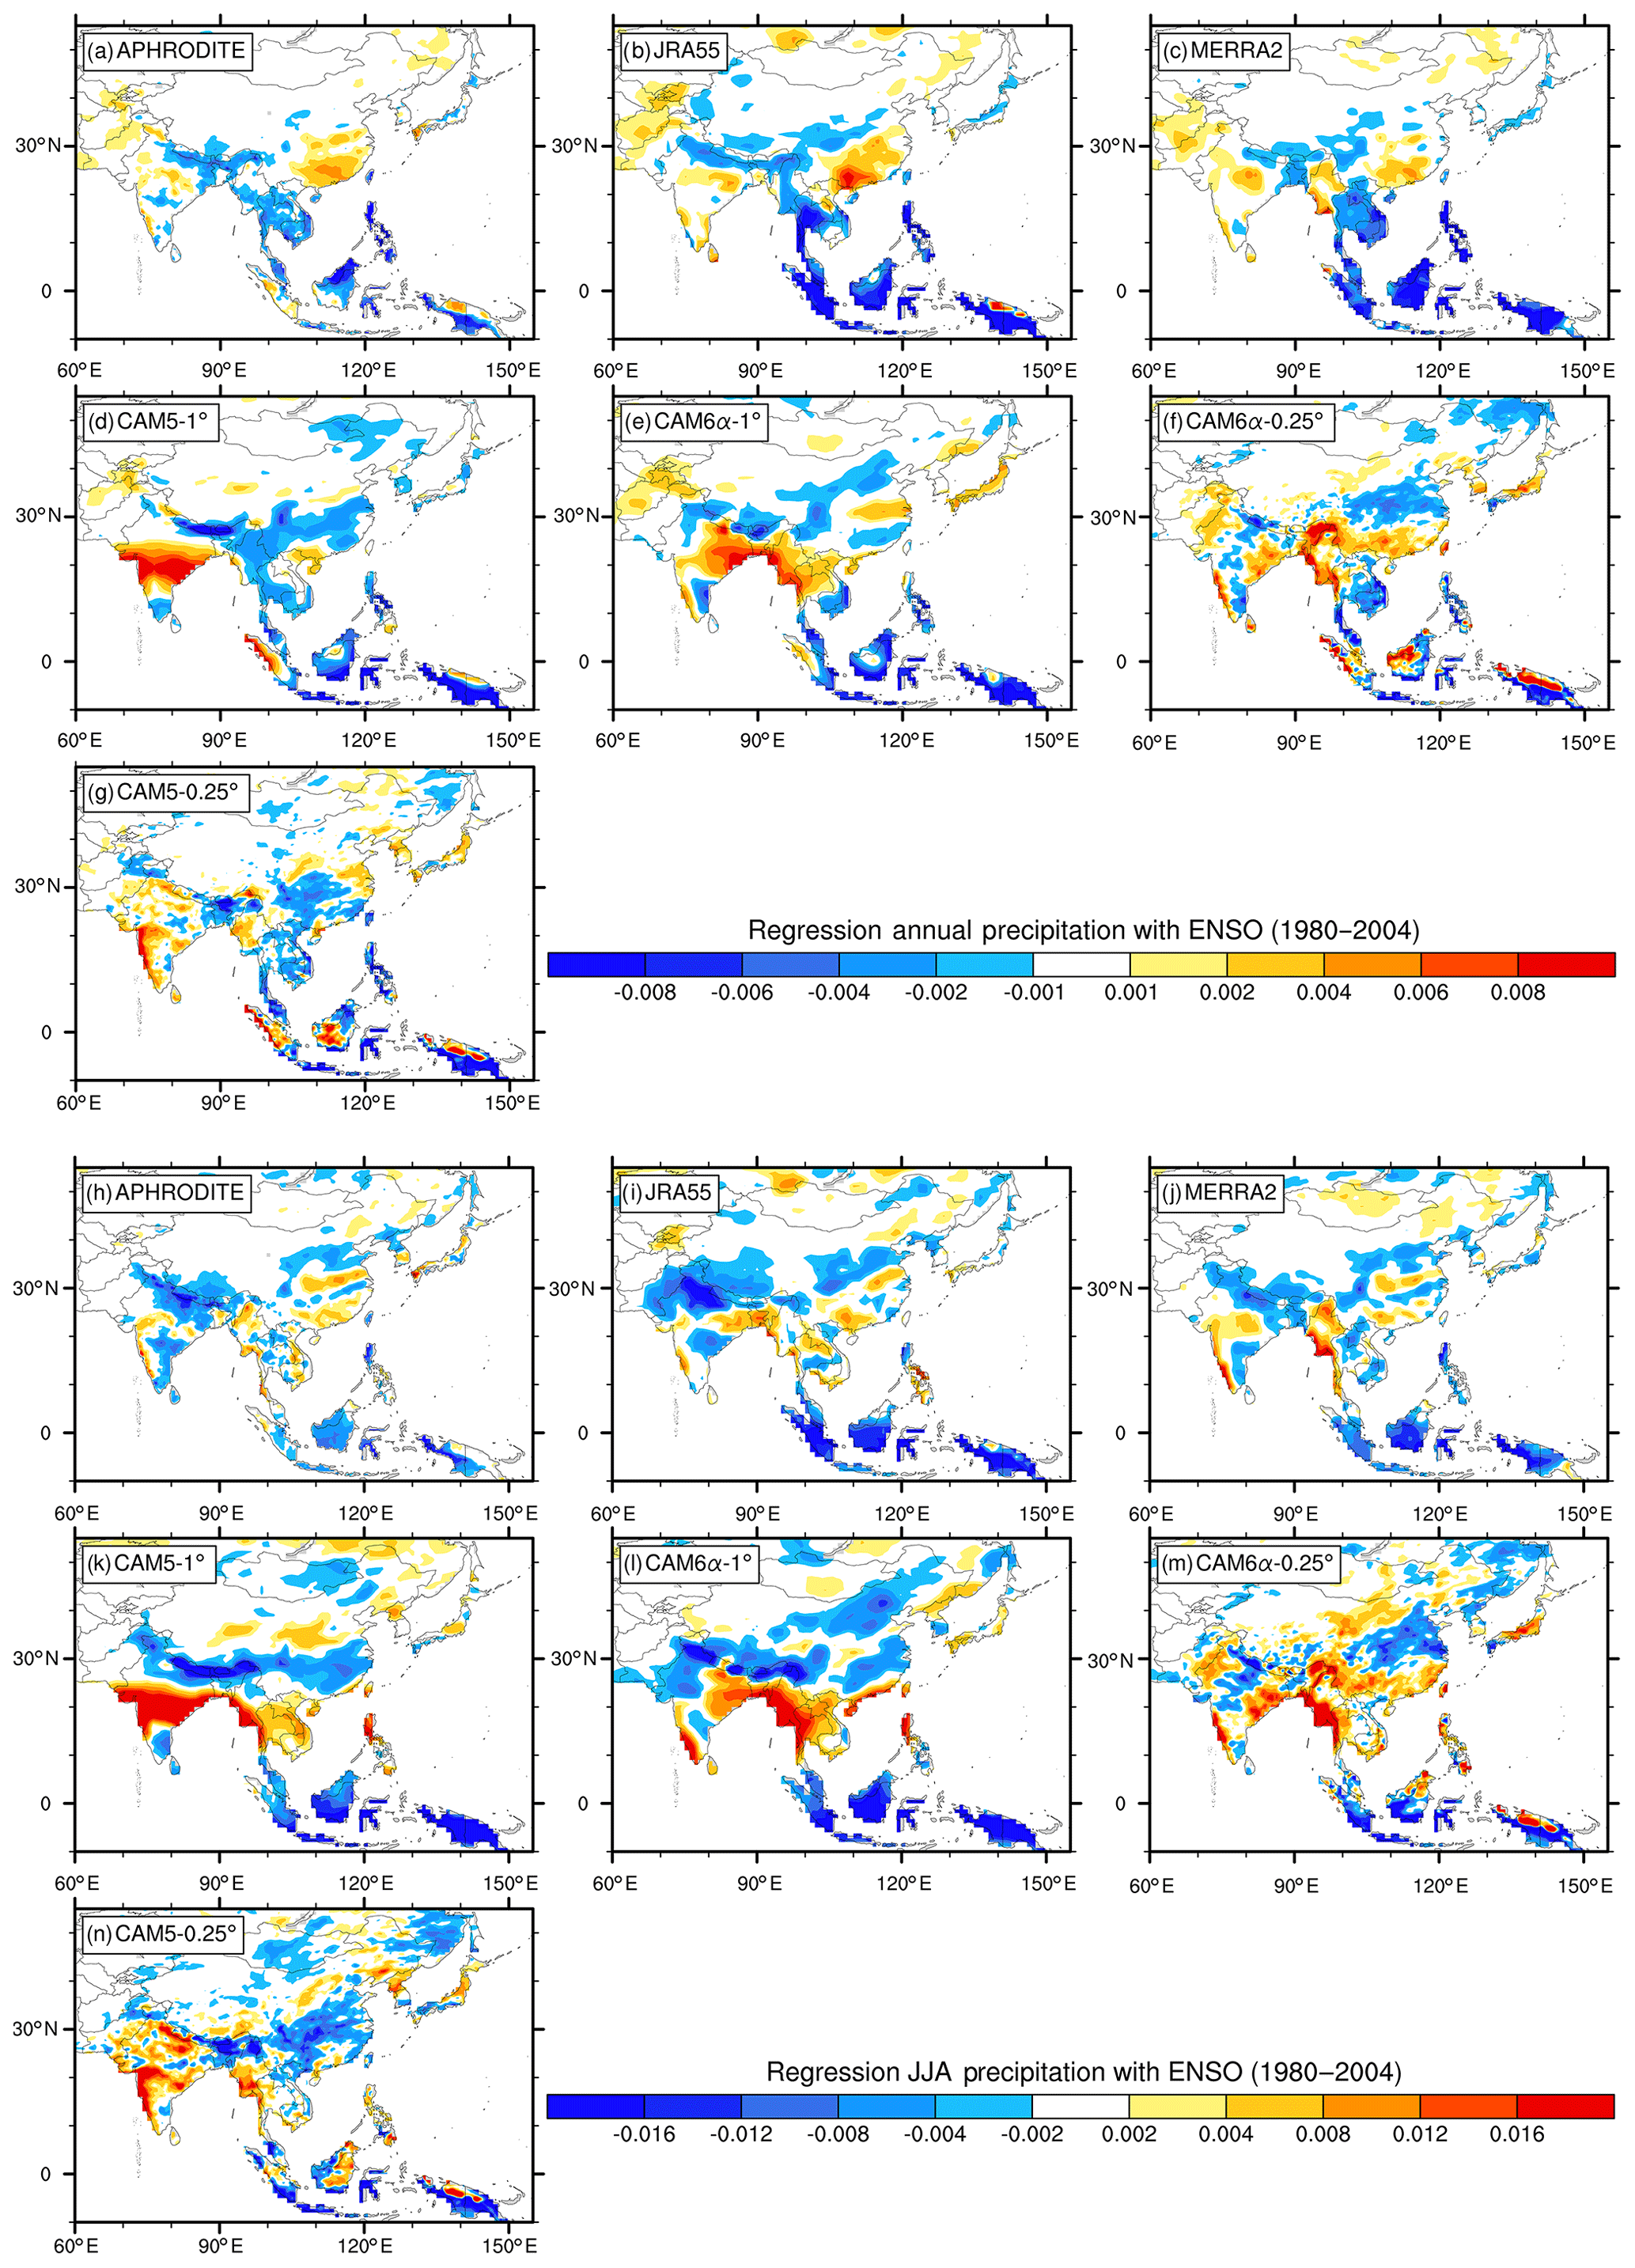
Figure 7Regression of annual mean (a–g) and summer (JJA, h–n) precipitation onto the observed ENSO index (mm d−1) for 1980–2004. Top color bar is for panels (a–g), bottom color bar is for panels (h–n).
Next, we examine seasonal precipitation variability associated with the East Asian summer monsoon (EASM). The EASM is an important climate system over eastern China. Climate models are widely used for EASM studies (Zhou and Li, 2002; Chen et al., 2010; Zhou et al., 2013), although model biases for the EASM are a long-lasting problem from CMIP3 (Coupled Model Intercomparison Project phase 3) to CMIP5 with limited improvement (Song and Zhou, 2015; Kusunoki and Arakawa, 2015). The East Asian summer monsoon index (EASMI) is a unified dynamic normalized seasonality (DNS) monsoon index defined by Li and Zeng (2002, 2003):
where and Vi are the January climatological and monthly wind vectors for a grid, respectively, and is the mean of January and July climatological wind vectors for the same gird. The constant 2 on the right-hand side of the formula is the determinant criterion. The double vertical line indicates the normalized value. EASMI can be used to depict both the seasonal cycle and interannual variability of the EASM. The EASMI summer average is considered here.
Figure 8 shows regression coefficients between summer (JJA) precipitation in the east of China and EASMI. There is an apparent negative relationship between the EASMI and summer rainfall in the middle and lower reaches of the Yangtze River in China for the observational and reanalysis data (Fig. 8a–c). All three CAM versions capture the positive correlation over southern China (Fig. 8d–g) found in the observations and reanalyses (Fig. 8a–c), although CAM6α at both 1 and 0.25∘ and CAM5-0.25∘ has the northern edge of the positive correlation more northward (about 2∘ latitude) distributed than that of observational and reanalysis data (Fig. 8e–g).
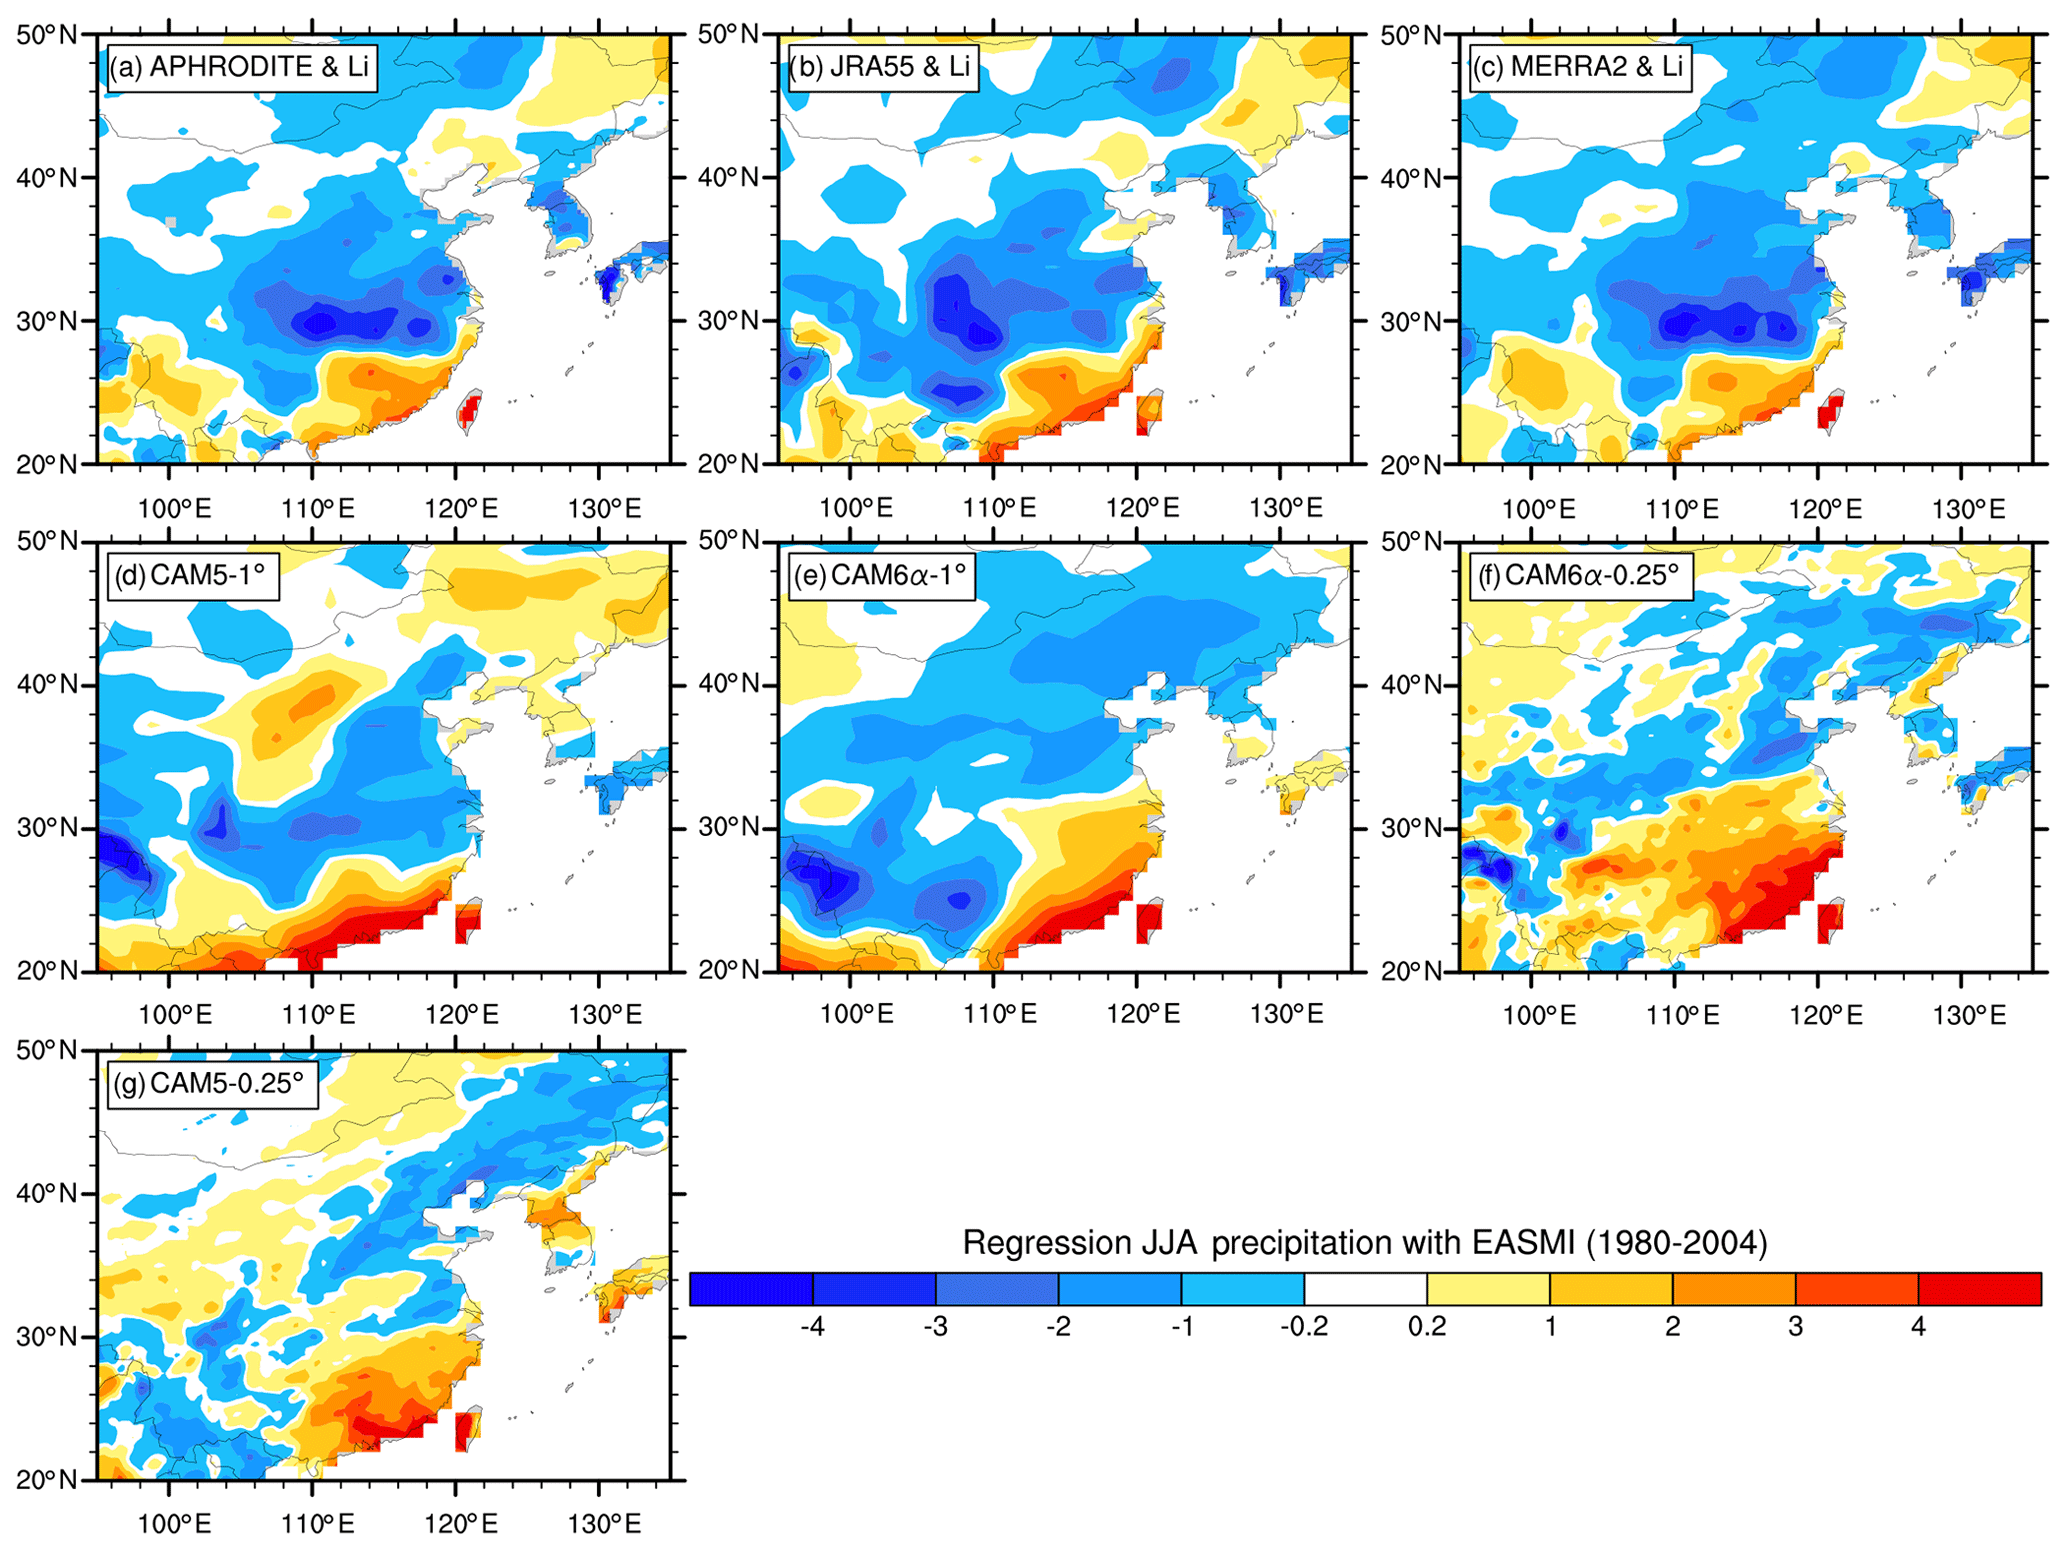
Figure 8Regression of summer (JJA) precipitation onto EASMI (mm d−1) for 1980–2004.
4.2 Seasonal cycle
Due to the monsoonal influence on both East Asia and South Asia, summer (JJA) precipitation dominates the annual total. Thus, the summer–winter contrast in precipitation serves as a useful quantity for model evaluation. JRA55 has less of a summer–winter contrast than APHRODITE (Fig. 9a). Compared to APHRODITE, MERRA2 has almost the same annual cycle over China (Fig. 9b). In CAM5, the JJA precipitation appears to be too large compared to the rest of the year. CAM6α-1∘ simulations reduce the bias in the annual cycle over Pakistan (Fig. 9c, d), although models continue to overestimate seasonal variability over arid regions in western China. CAM6α-0.25∘ shows a bigger bias than CAM5-0.25∘ over the Himalayas (Fig. 9e, f). The seasonal variability is significantly improved in CAM6α-0.25∘, especially in Himalayan mountain regions. Southern China, again, is a region where the CAM6-0.25∘ performance is improved substantially. This is further diagnosed in the next figure.
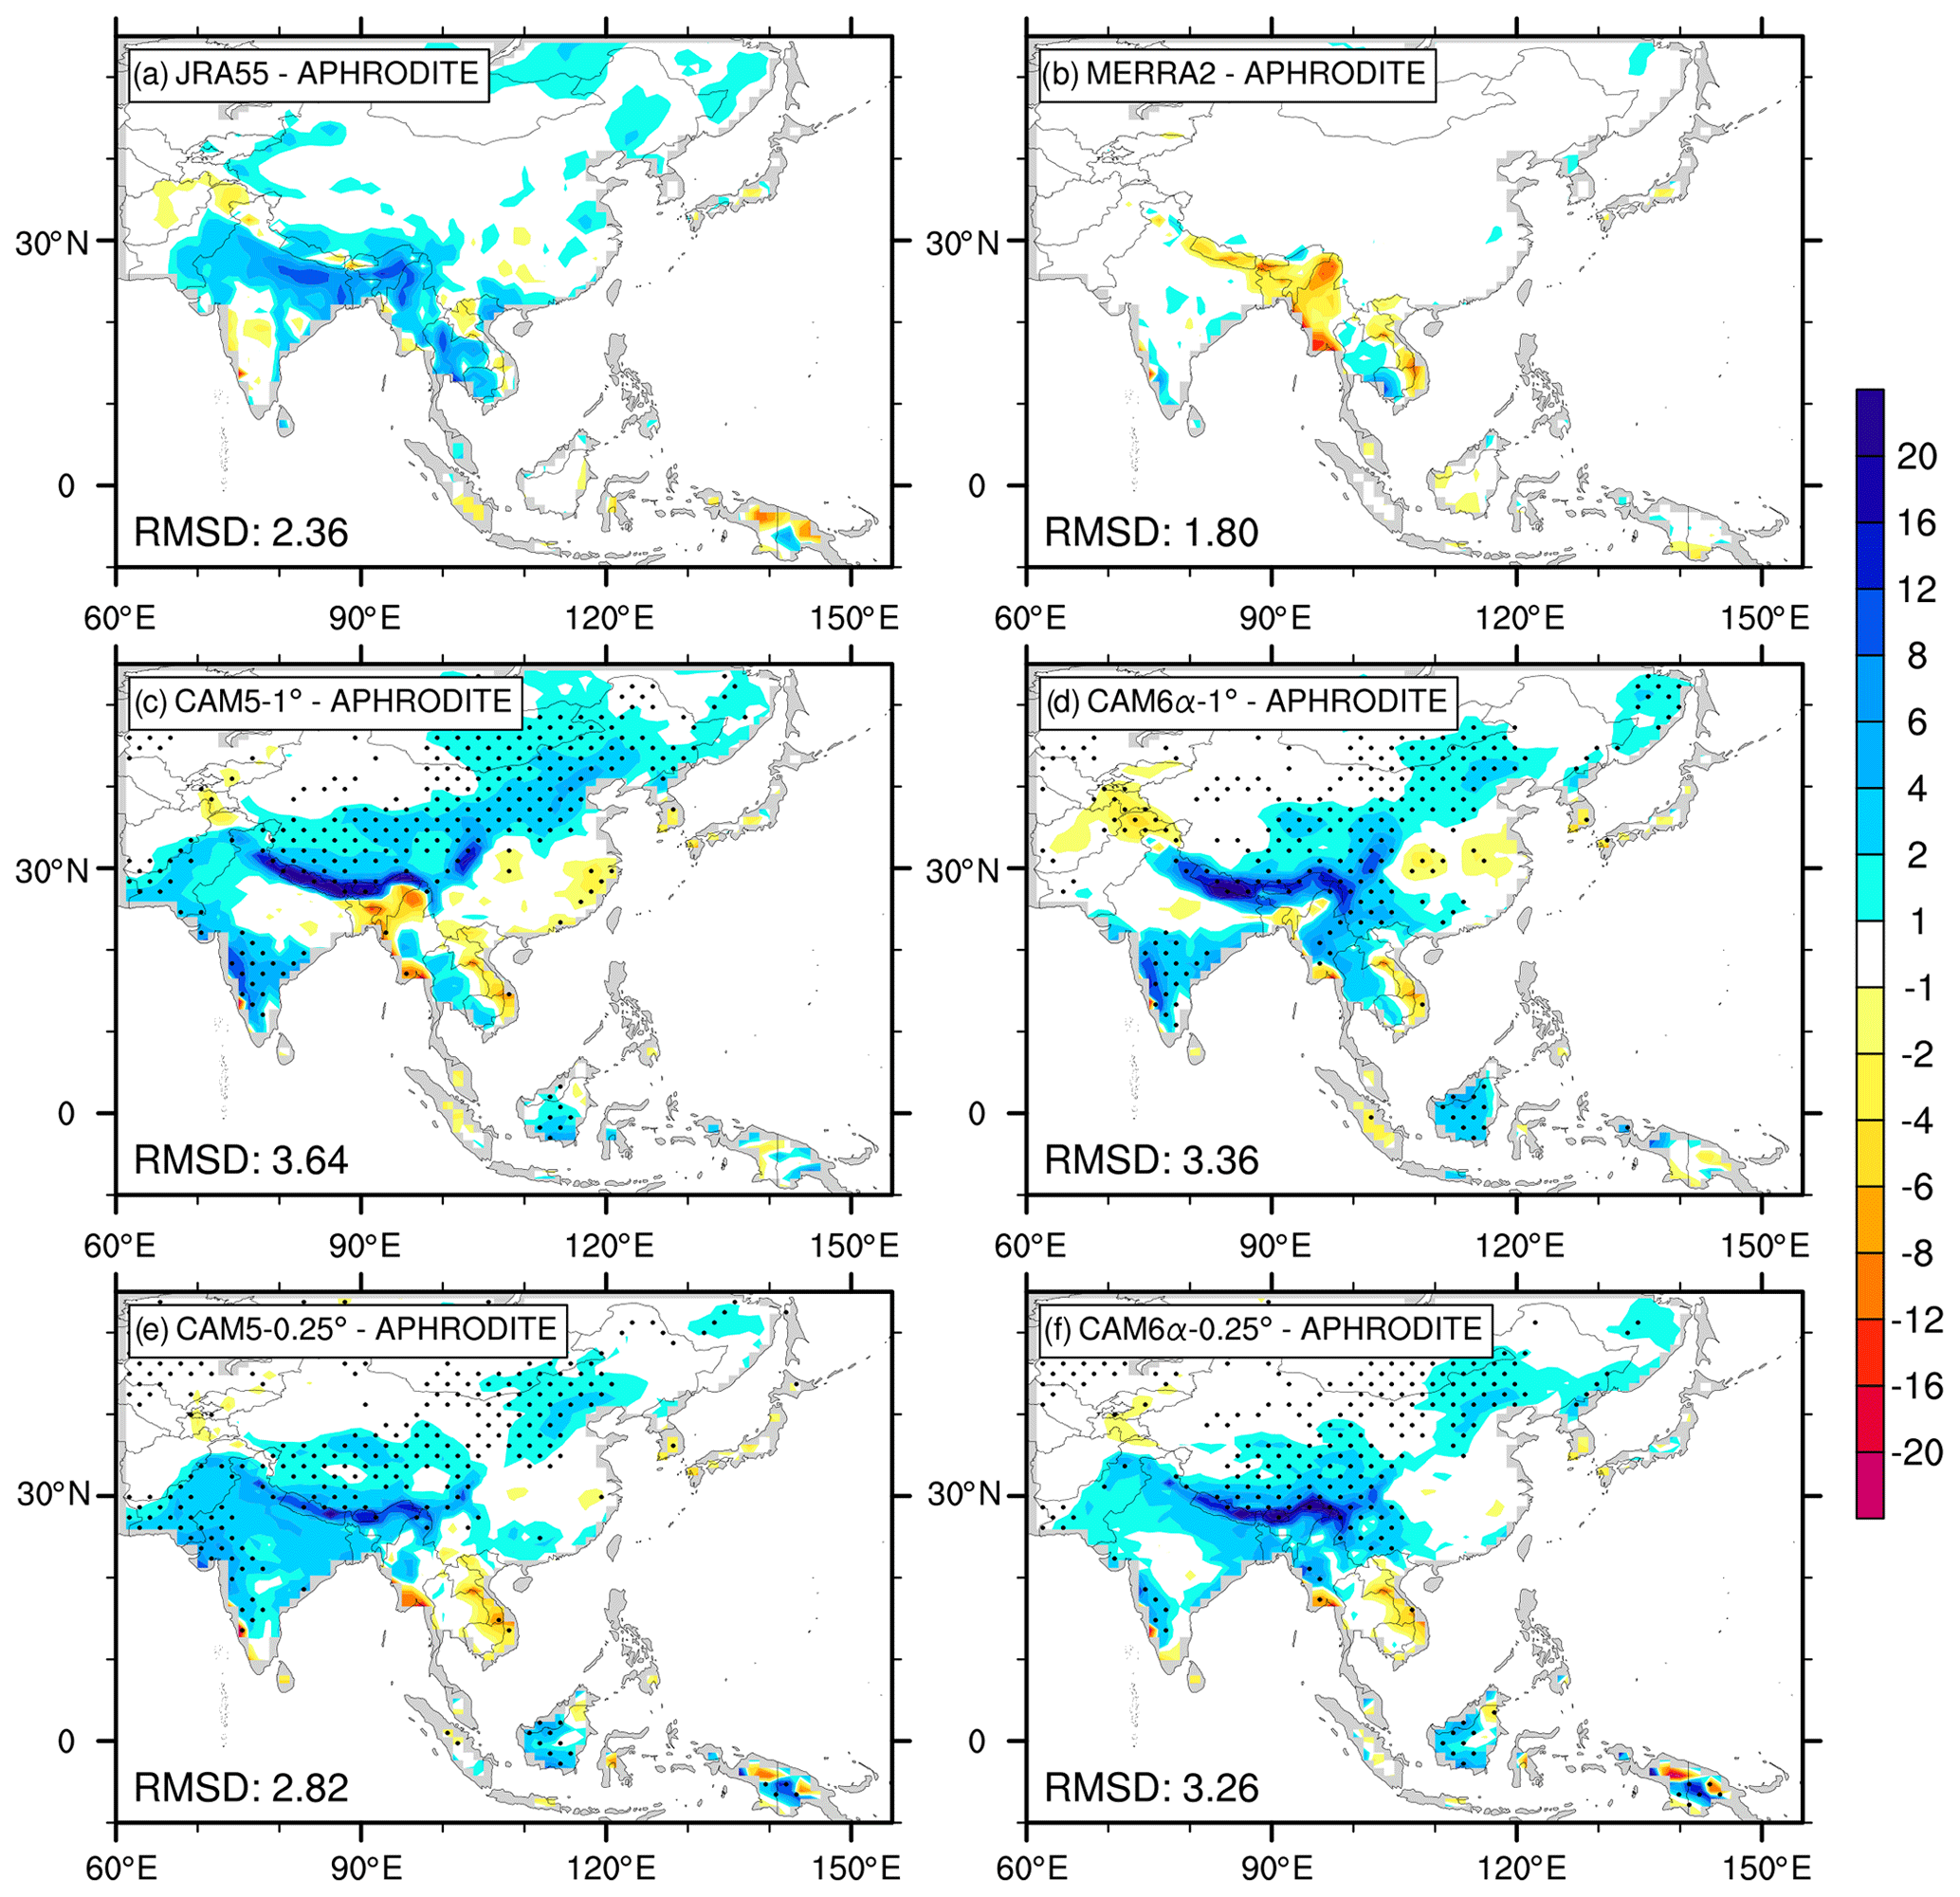
Figure 9The difference of summer minus winter (JJA − DJF) precipitation (mm d−1) between APHRODITE and (a) JRA55, (b) MERRA2, (c) CAM5-1∘, (d) CAM6α-1∘, (e) CAM5-0.25∘ and (f) CAM6α-0.25∘. The values at the lower left of every panel indicate the root mean square difference (RMSD) relative to APHRODITE. Grid points in panels (c–f) are stippled when the absolute value of the difference between the model and APHRODITE is larger than that between JRA55 and APHRODITE.
In Fig. 10, we show the time series of zonal mean precipitation between 100 and 125∘ E to evaluate model performance in simulating the annual cycle of EASM-related precipitation. Figure 10 shows that precipitation mainly occurs from May to September, rapidly shifts to northern China around June and continues to September (Su et al., 2017). It is clear that APHRODITE, JRA55 and MERRA2 all depict such a northern shift (Fig. 10a, b, c). Both versions of CAM6α capture this northern shift and its persistence from June to September, especially CAM6α-0.25∘ (Fig. 10e, f), while CAM5-1∘ illustrates persistence from June to July only (the area of continuous yellow shading in Fig. 10d is smaller than those of CAM6). High-resolution CAM5-0.25∘ captures that shift and its persistence from June and September (Fig. 10g). This explains the CAM5-1∘ deficiency as shown in Fig. 9.
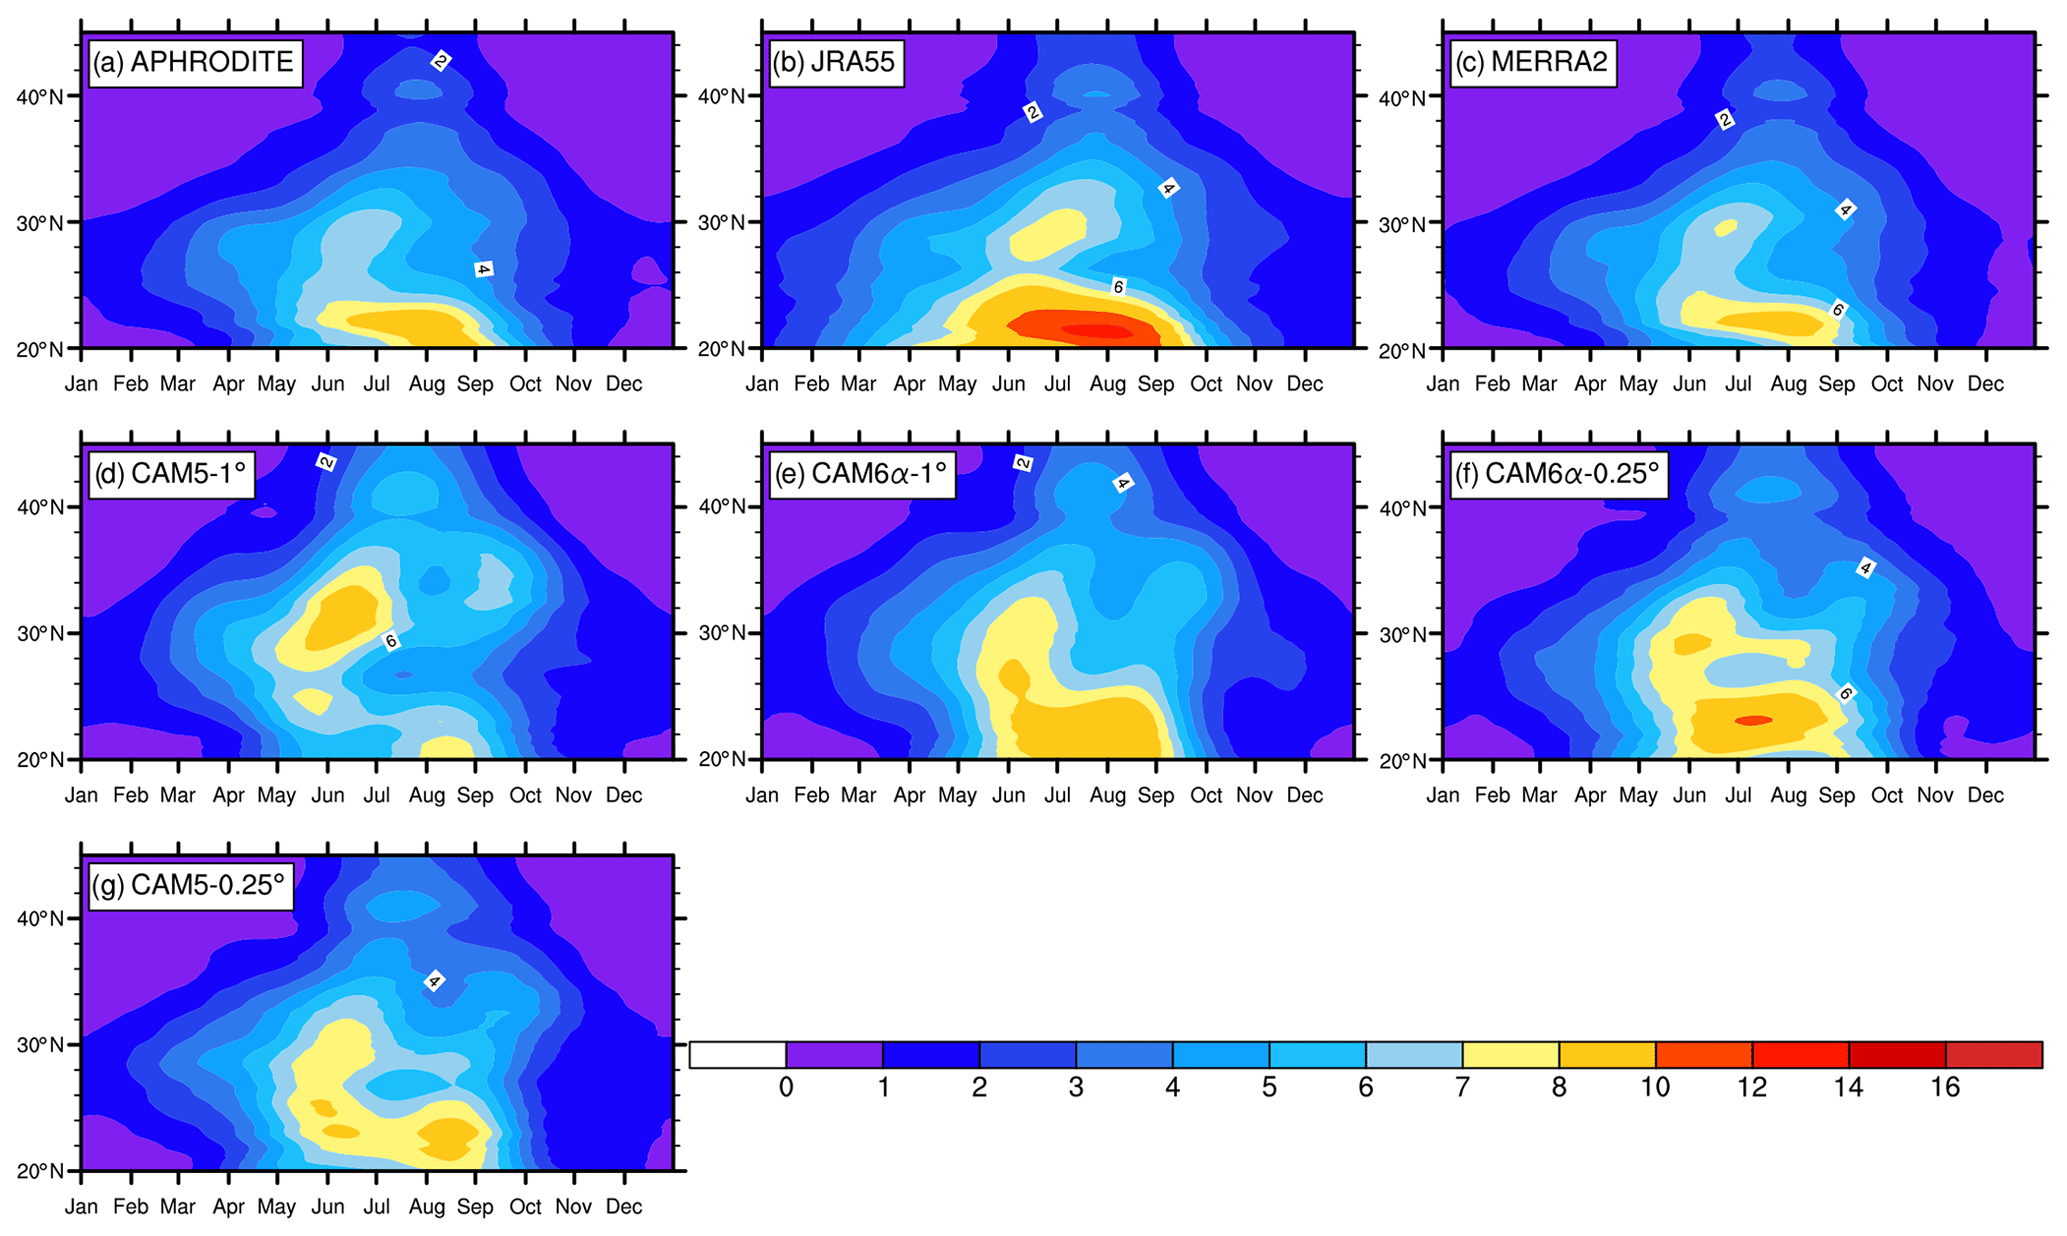
Figure 10Annual cycle of the regional mean precipitation rate (mm d−1) for 1980–2004 within a part of Asia (between 100 and 125∘ E): (a) APHRODITE, (b) JRA55, (c) MERRA2, (d) CAM5-1∘, (e) CAM6α-1∘, (f) CAM6α-0.25∘ and (g) CAM5-0.25∘.
4.3 Daily precipitation frequency and diurnal cycle of precipitation
Figure 11 illustrates the daily rainfall frequency distribution from reanalyses, observations and models. Despite large uncertainties among observational datasets, daily rainfall intensity for CAM6-0.25∘ (green line) is closer to observational values over southwestern China than other simulations (Fig. 11b). CAM5-0.25∘ overestimates the frequency of light precipitation (0.1–10 mm d−1) over southwestern China (purple line in Fig. 11b). CAM5-1∘ simulates a higher frequency of light precipitation (0.1–1.0 mm d−1) over Korea, Japan, northern China and southern China (Fig. 11a, c, d, g, h). New physical schemes in CAM6-1∘ capture the observed distribution over Korea and Japan (Fig. 11c, d). Realistic rainfall intensity is not energetically necessary because more frequent weak events can produce the same latent heating as less frequent but more intense rainfall events. CAM6 improves the light large-scale precipitation over Korea, Japan and northern China (not shown).
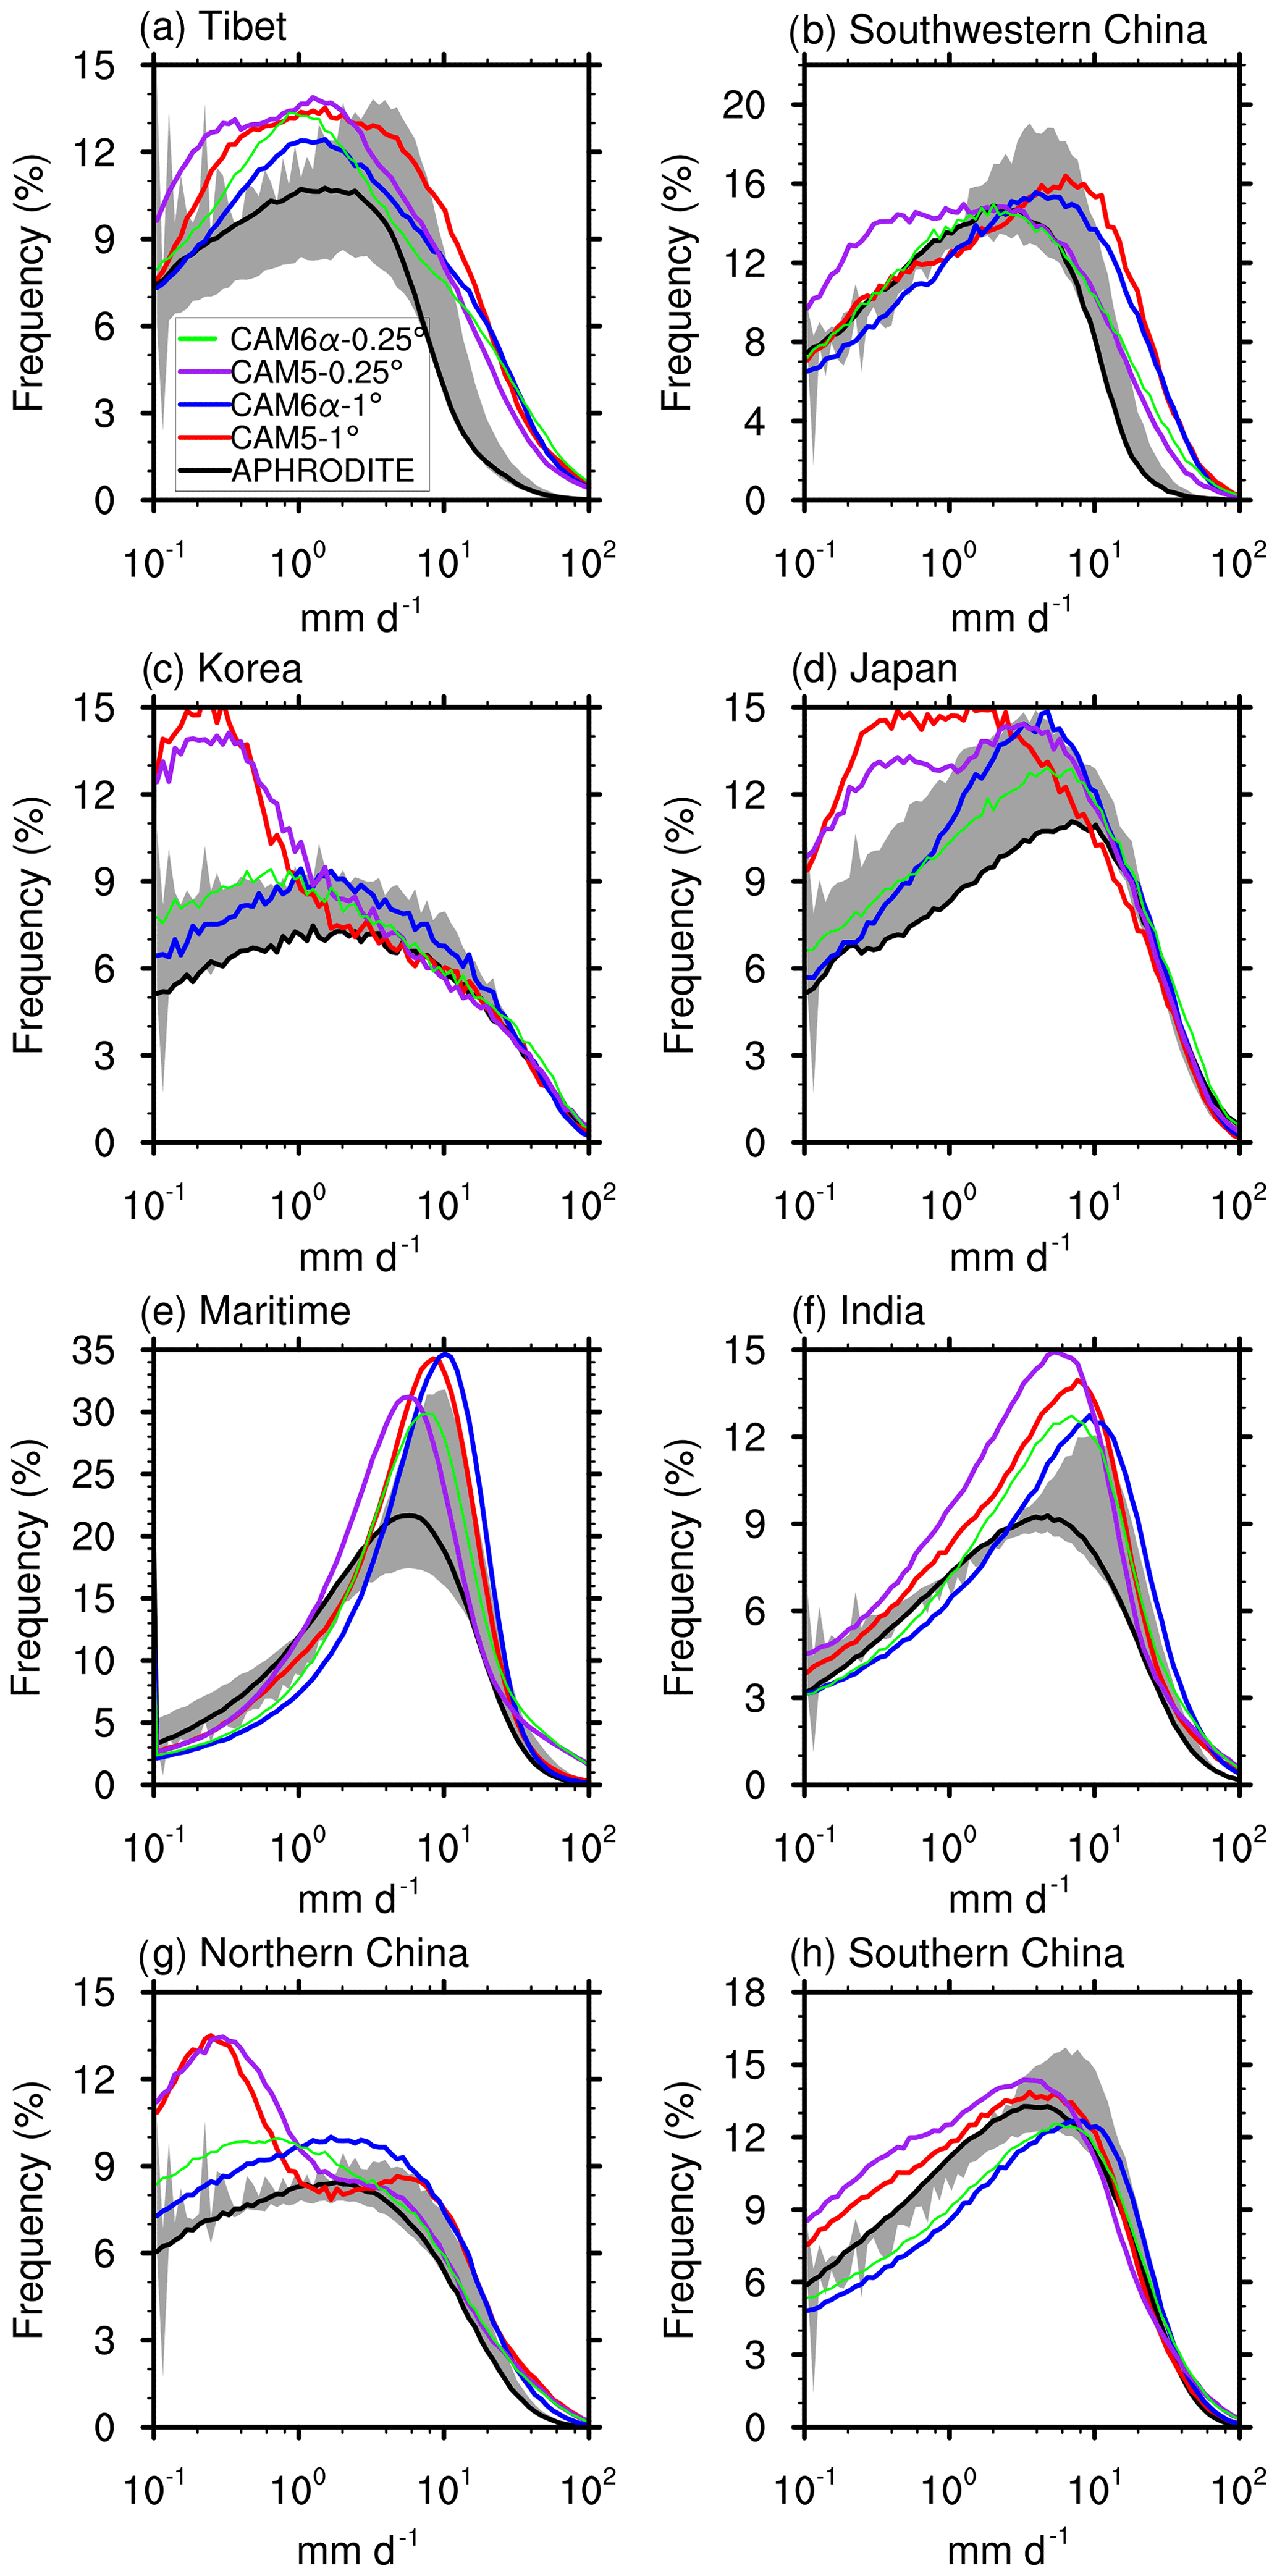
Figure 11Frequency distribution of daily precipitation (mm d−1) over (a) Tibet, (b) southwestern China, (c) Korea, (d) Japan, (e) the Maritime Continent (see the boxes in Fig. 2c), (f) India, (g) northern China and (h) southern China for 1980–2004. Black lines (shading) are for APHRODITE (the maximum and minimum of APHRODITE, JRA55 and MERRA2). Red solid lines are for CAM5-1∘; blue solid lines are for CAM6α-1∘; green solid lines are for CAM6α-0.25∘; purple solid lines are for CAM5-0.25∘. All data were interpolated to 1∘ resolution before regional averaging.
To look into the heavy precipitation more carefully, Figure 12 shows precipitation percentiles from 90 % to 99.99 %, which captures the heaviest precipitation events (Kooperman et al., 2016). CAM6 with new physics modules (blue) has a better performance than CAM5 over five of eight selected regions (Tibet, southwestern China, Japan, India, northern and southern China). Higher horizontal resolution in CAM6 and CAM5 (green and purple) better simulates intensities over the Maritime Continent (Fig. 12e), but the results of CAM6 (CAM5) degrade (upgrade slightly) for the heaviest precipitation events over India, northern China and southern China (Fig. 12f–h). No significant differences are found between CAM5 and CAM6 over Tibet, southwestern China, Japan and the Maritime Continent.
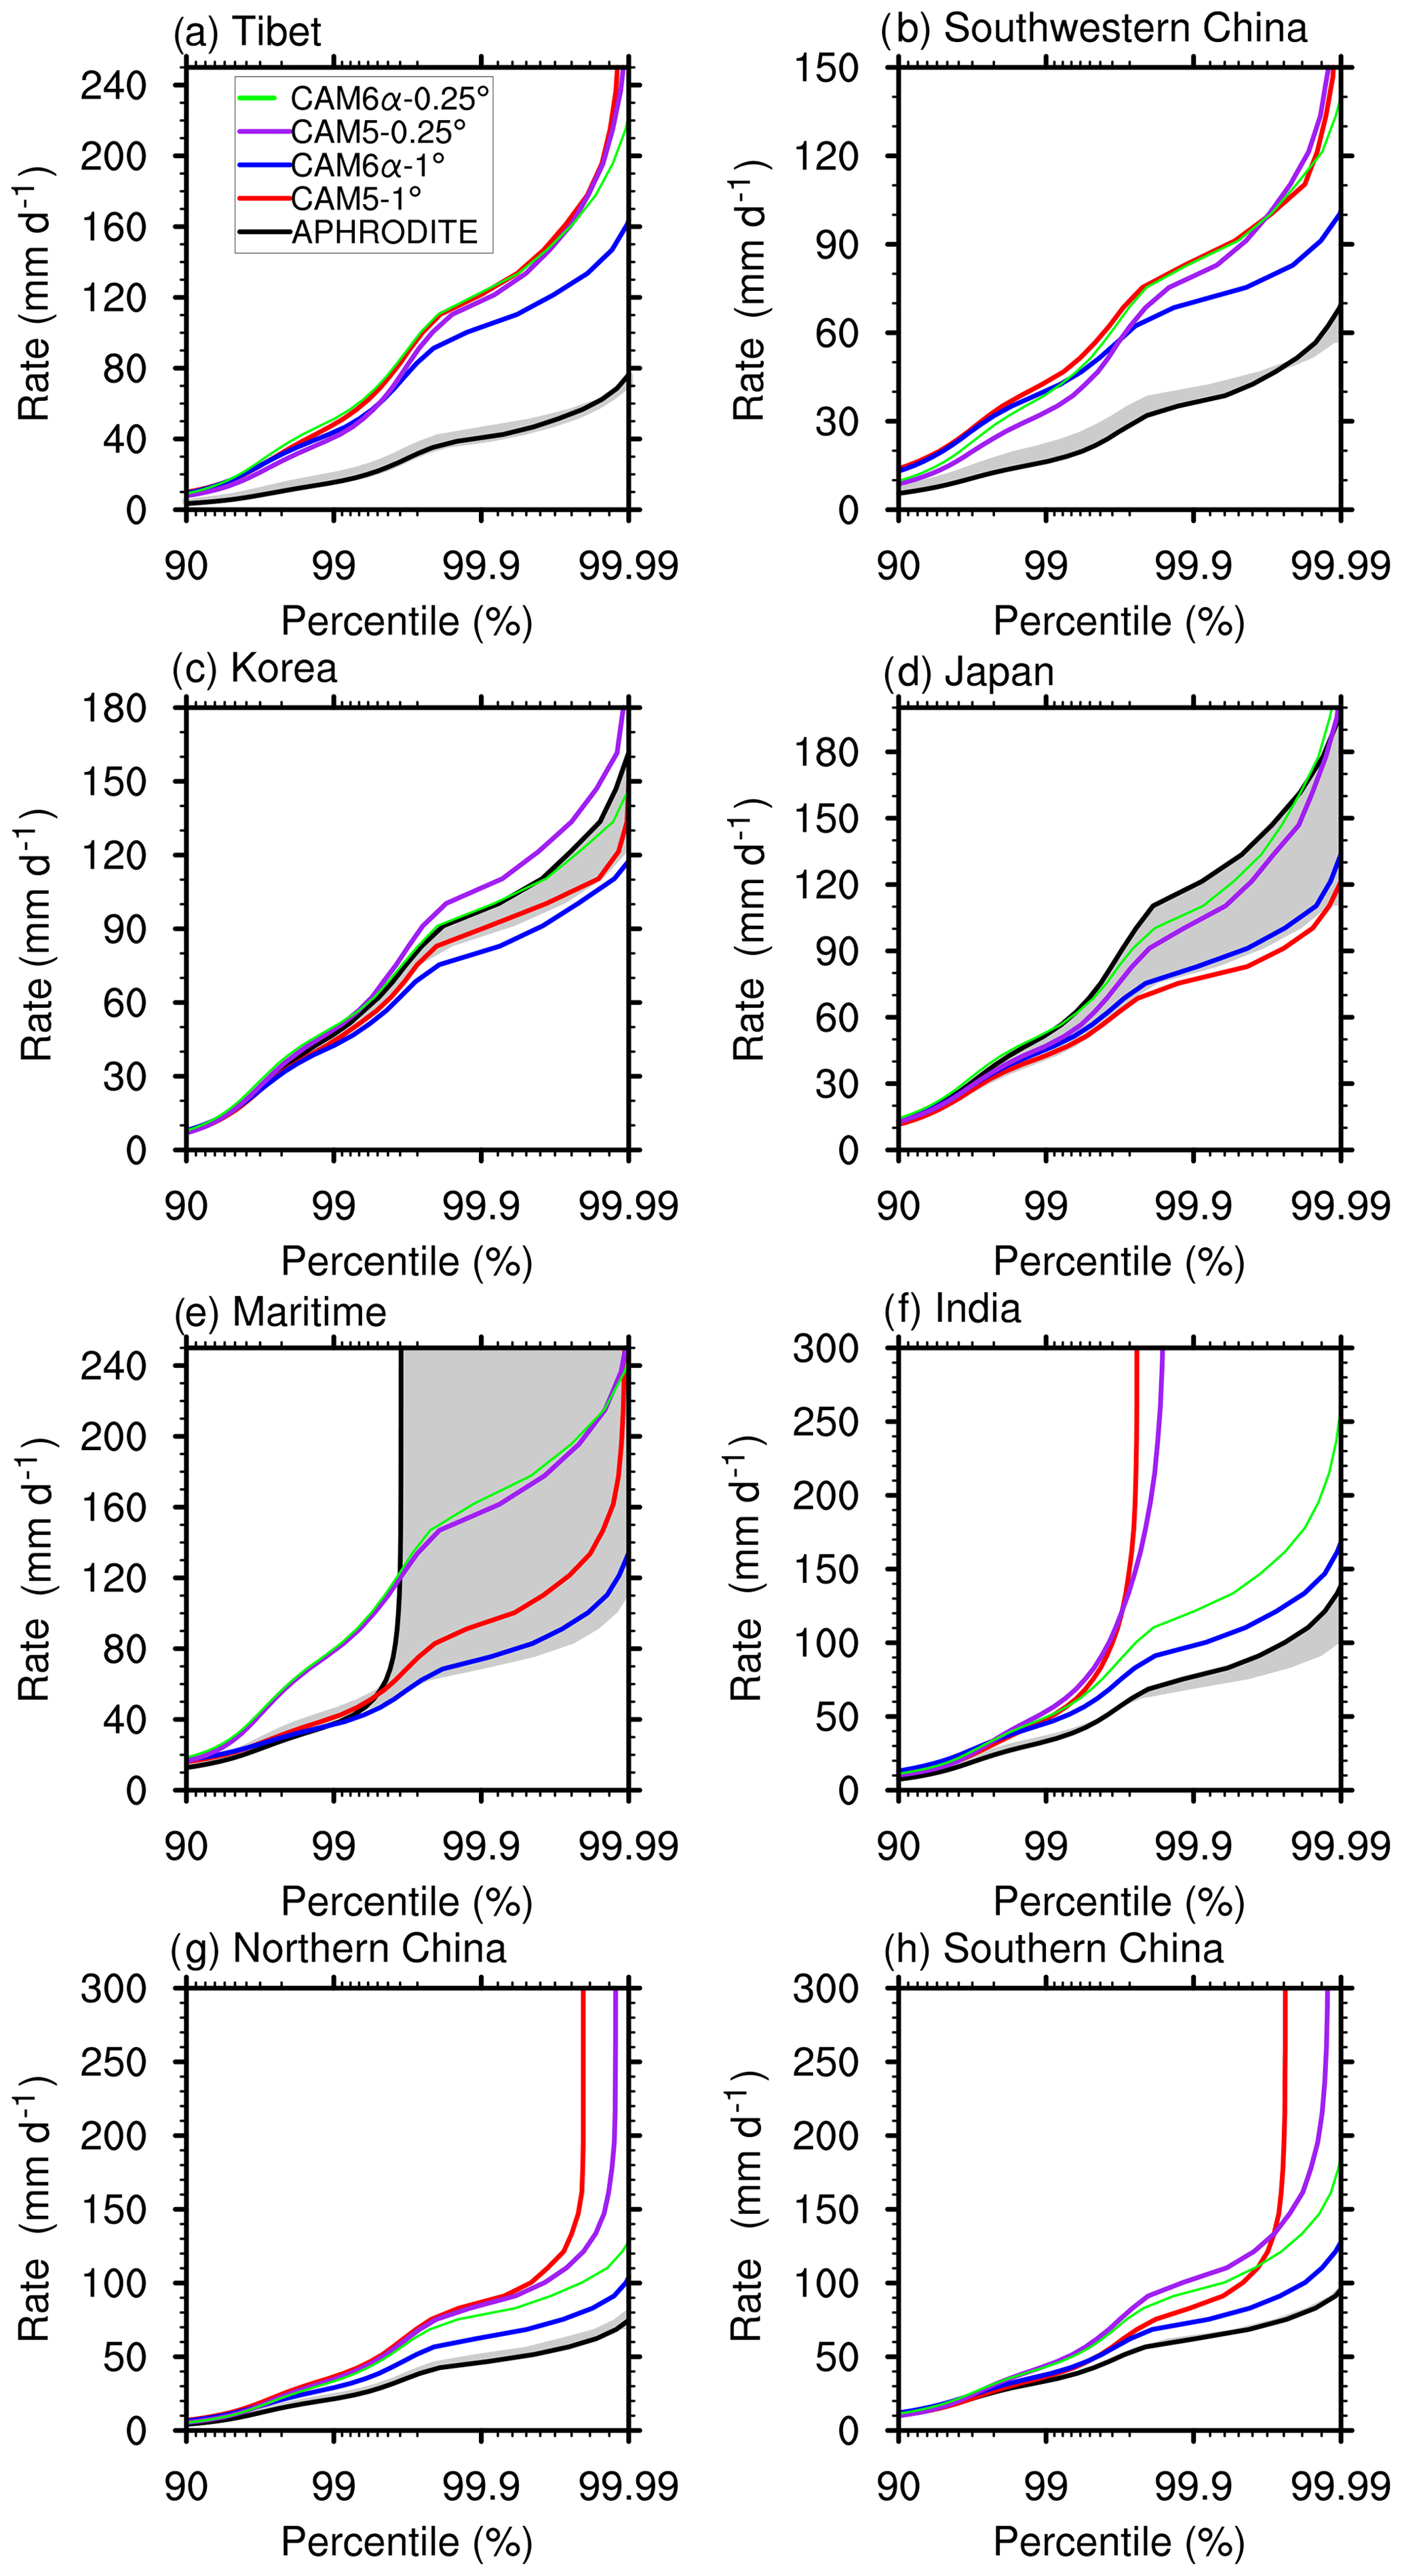
Figure 12Similar to Fig. 11, but for daily precipitation rates (mm d−1) as a function of percentile.
Figure 13 shows the diurnal cycles of June precipitation rate from TRMM satellite observations and model simulations. Satellite observations show that the diurnal peak in precipitation is around 20:00 (LT) over Tibet, India and the Maritime Continent, while the peak over southern China is in the afternoon (15:00 LT) (Fig. 13a). CAM6α reproduces many features of the TRMM observations (Fig. 13c, e), while CAM5-1∘ and CAM5-0.25∘ simulate an earlier-in-the-day peak precipitation over India, southern China and the Maritime Continent (Fig. 13b, d). CAM6α-0.25∘ simulates the diurnal cycle better than CAM6α-1∘ in southern Tibet (Fig. 13d) along the Himalayas. In general, CAM6 at all resolutions has significant improvements over CAM5 in simulating the diurnal cycle of precipitation in East Asia, and CAM5 with higher resolution improves the diurnal cycle only slightly.
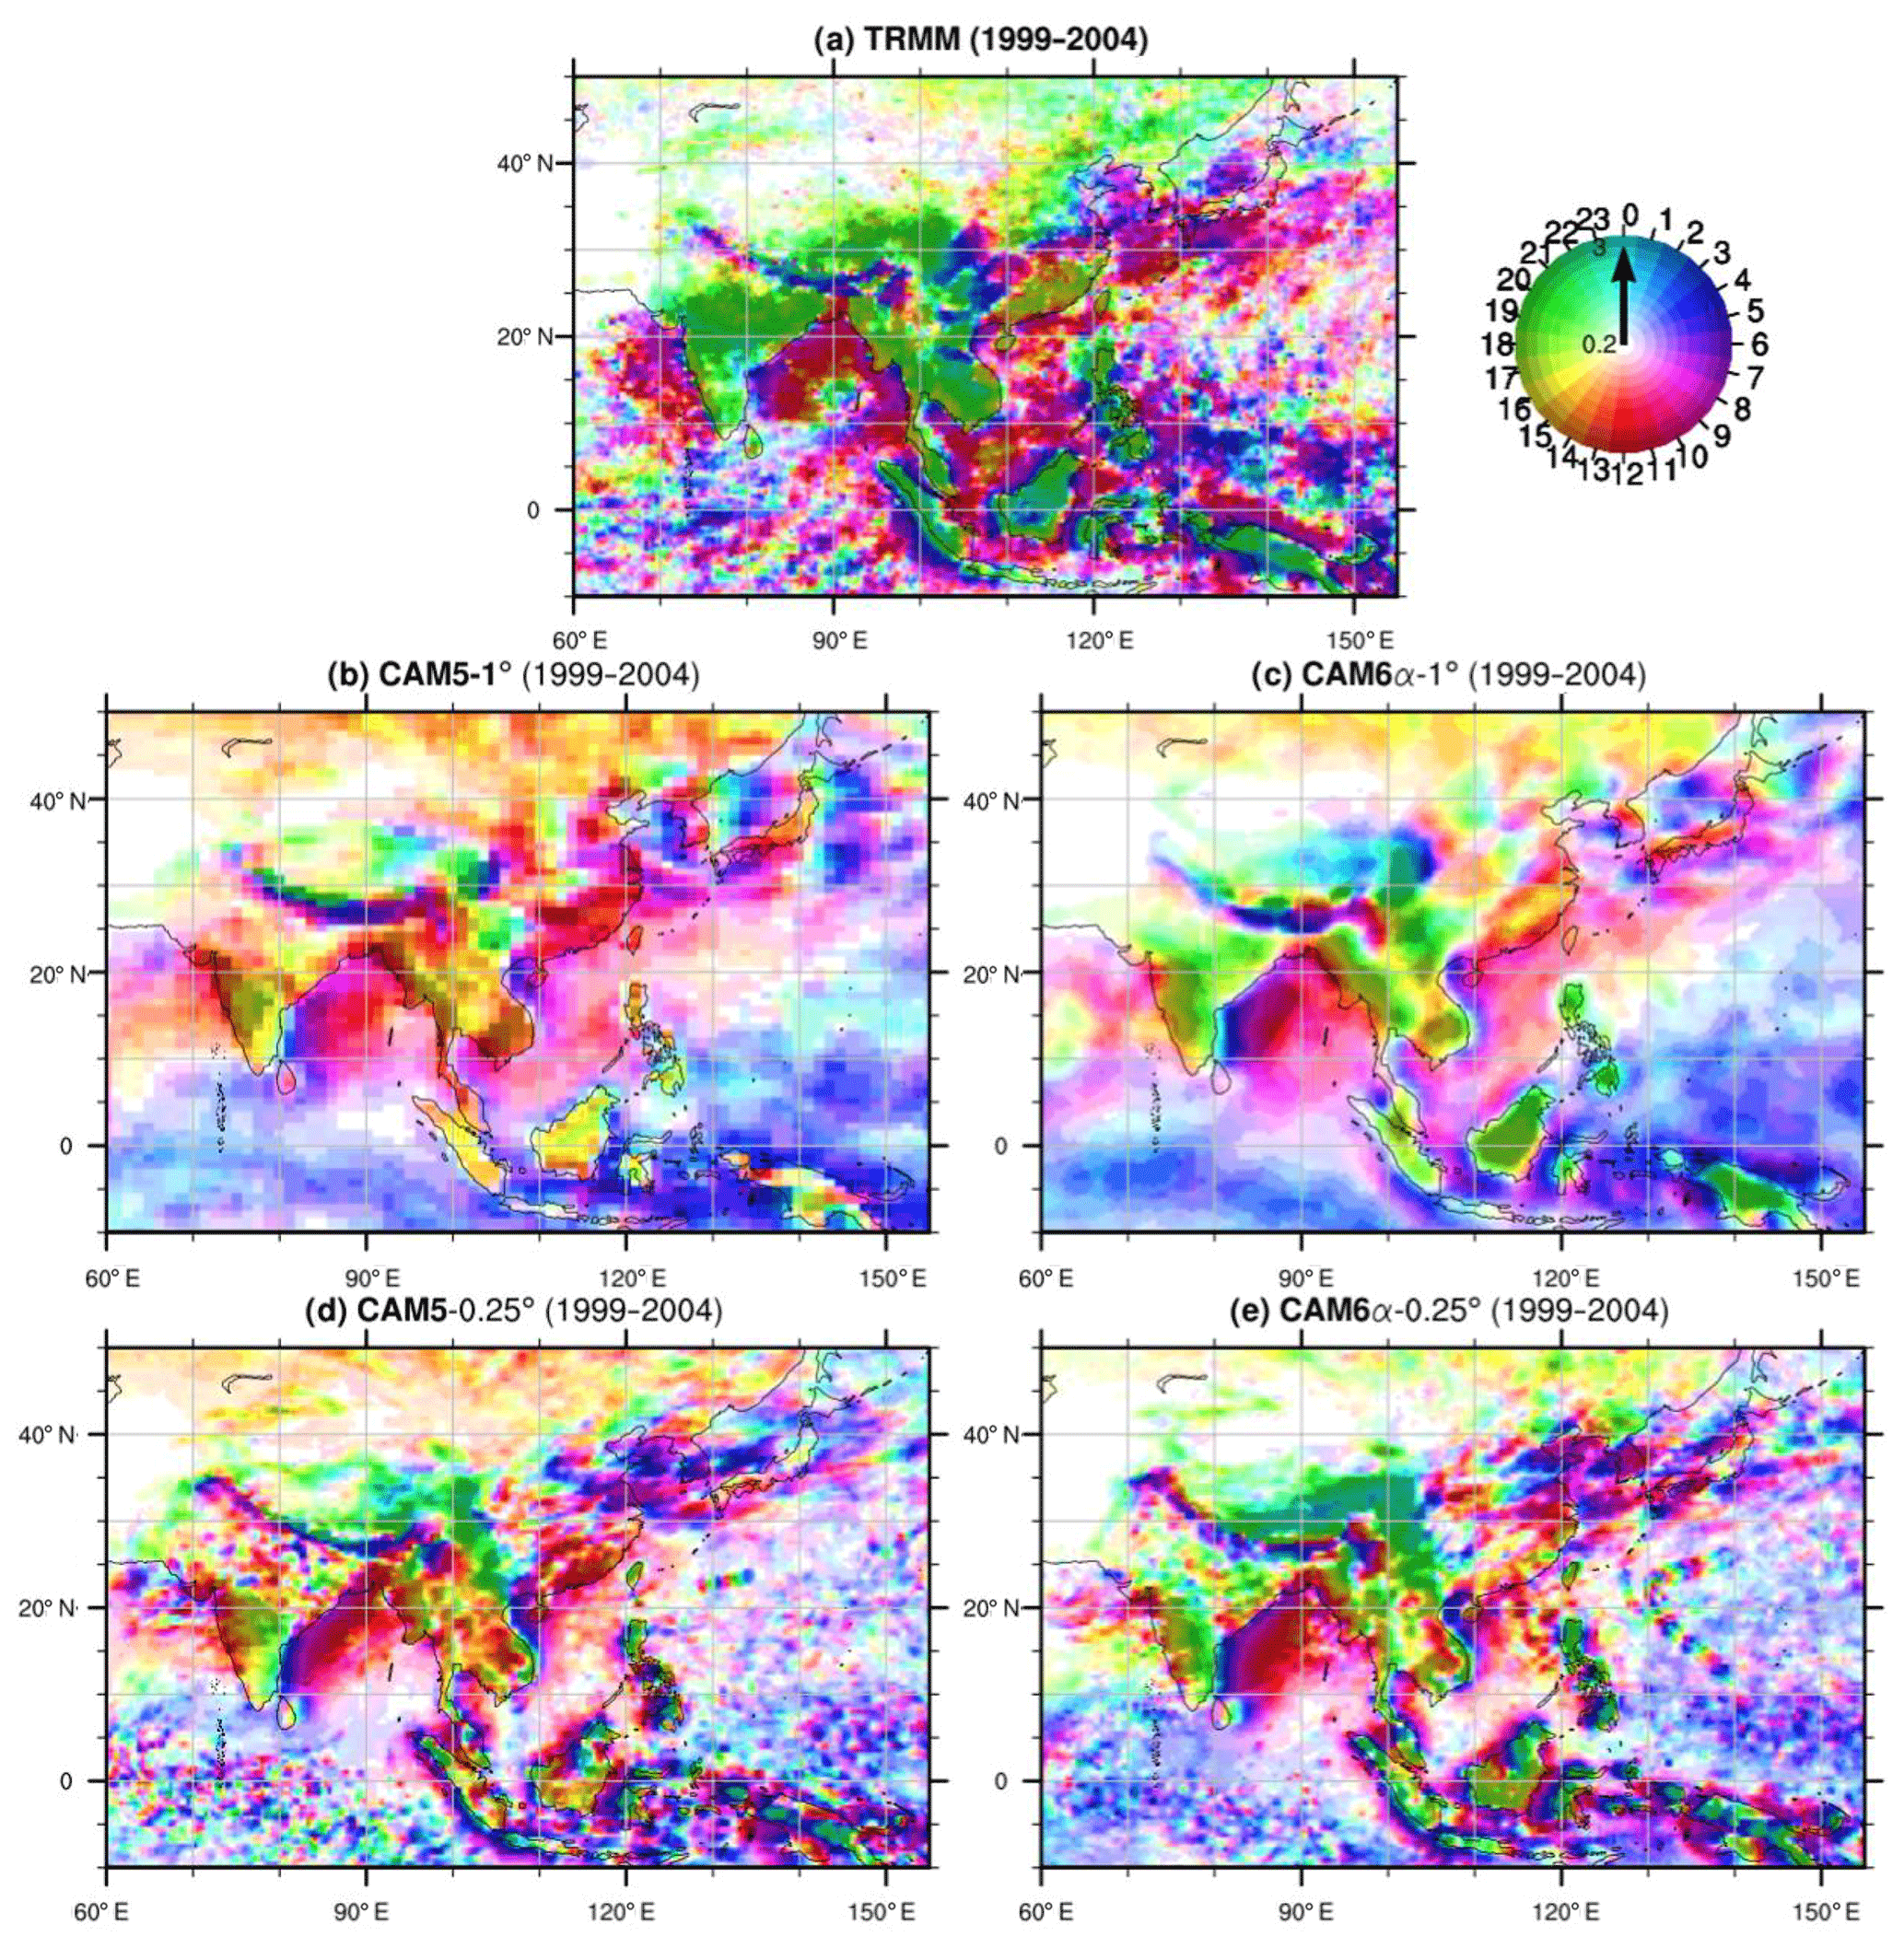
Figure 13Diurnal cycle of precipitation in June (6-year average for 1999–2004) of (a) TRMM, (b) CAM5-1∘, (c) CAM6α-1∘, (d) CAM5-0.25∘ and (e) CAM6α-0.25∘. The local time peak of the diurnal cycle is shown in color on the color wheel. The intensity of the color is the amplitude of precipitation.
The CLUBB parameterization appears to be the reason for this improvement. CLUBB has prognostic moments that provide memory to facilitate the initiation of shallow convection in the midmorning and early afternoon. It is important to note that improved simulation of the diurnal cycle by CLUBB is a robust feature in every coupled and atmosphere-only simulation with CAM6α. The CLUBB unified parameterization is able to prevent the deep convective scheme from firing off too early and better simulate a gradual transition of these regimes successfully (Bogenschutz et al., 2018).
Here, we quantitatively contrast climate variables over southwestern China, northern China and the Maritime Continent, since the model with new physical modules or high horizontal resolution simulates a better climatology over southwestern China and northern China but does the opposite over the Maritime Continent (Fig. 3). We attempt to attribute changes to either physical parameterizations or resolution. Additionally, we investigate whether the improvement due to resolution is dependent on the CAM version. Table 2 illustrates simulation differences due to physical parameterizations (CAM6α-1∘ minus CAM5-1∘) and higher horizontal resolution (CAM6α-0.25∘ minus CAM6α-1∘ and CAM5-0.25∘ minus CAM5-1∘).
New physical modules and higher horizontal resolution in CAM6α perform better over southwestern China by decreasing convective precipitation (by −0.38 and −0.81 mm d−1, respectively). New physical modules simulate larger surface latent heat flux but less vertically integrated humidity, which leads to a decrease in convective precipitation over southwestern China (Table 2). Higher resolutions in CAM6 and CAM5 both decrease the surface latent heat flux and convective precipitation over southwestern China (Table 2). However, higher resolution leads to an opposite change in surface sensible heat flux (total cloud amount) between CAM5 and CAM6α by 12.7 and −7.4 W m−2 (−3.9 % and 0.5 %), respectively.
Newer physics parameterizations in CAM6α simulate a stronger solar flux reaching the surface in northern China (Table 2). This may be due to improvements in the diurnal cycle of precipitation (Li et al., 2008). The stronger solar flux leads to larger latent heat release, although convective precipitation over northern China is not changed by the new physics modules. Better representation of topography at 0.25∘ resolution leads to increased downward shortwave flux at the surface in northern China. Less convective precipitation associated with increased resolution is seen over northern China in Table 2 (−0.31 mm d−1 for CAM6 and −0.33 mm d−1 for CAM5). Note that CAM6 simulates a decrease in the surface latent heat flux with a higher resolution, while CAM5 does not. We also examine the moisture budget using diagnostics for precipitation changes (Chou and Lan, 2012). The moisture budget analysis defines the mass conservation of water substance in an atmospheric column as
where P is precipitation, q is specific humidity, u(v) is zonal (meridional) wind and E is evaporation into the atmosphere. is a mass-weighted vertical integral and denotes a temporal average. The horizontal advection can be further decomposed into the stationary and transient terms based on
where and are the climatological zonal mean (stationary) eddy, and X′ is transient variation. See Yao et al. (2017) and Chen et al. (2018) for more details.
No significant difference in evaporation (E) is seen between the model and JRA55 data (Fig. 14). The results indicate that CAM6 (both resolutions) simulates a moisture budget closer to JRA55 than CAM5-1∘, and the model precipitation bias appears mostly in the zonal moisture flux convergence term over southwestern China (Fig. 14a). Although a large residual over northern China (Fig. 14b) may result from water vapor transport by the surface vertical movement induced by terrain slope (Trenberth and Guillemot, 1995; Seager et al., 2010), all four versions of CAM and JRA55 show that the zonal mean of specific humidity eddy transport dominates northern China precipitation (Fig. 14b). CAM5-0.25∘ simulates a similar moisture budget as CAM6-0.25∘, while the corresponding results are different between CAM5-1∘ and CAM6-1∘ over southwestern China and northern China (Fig. 14a, b).

Figure 14Moisture budget over (a) southwestern China, (b) northern China and (c) the Maritime Continent (see the boxes in Fig. 2c) for 1980–2004, including precipitation, evaporation, zonal and meridional moisture flux convergence, and the residual and (right to dashed line) major processes contributing to moisture flux convergence.
Next, we explore the differences in simulated variables due to higher horizontal resolution over the Maritime Continent (Fig. 3). As seen in Table 2, the higher horizontal resolution in CAM6 not only increases the vertically integrated total cloud cover over the Maritime Continent, but also leads to more shortwave flux reaching the surface, which tends to release more latent heat. Both CAM5 and 6 versions with 0.25∘ resolution reduce the convective precipitation and increase the large-scale precipitation relative to 1∘ resolution, which leads to an overestimation of total precipitation. The two 0.25∘ resolution CAM versions simulate the same surface air temperature, surface energy terms (surface latent and sensible heat flux, downwelling solar flux, and longwave flux at the surface) and vertically integrated humidity change but simulate a different vertically integrated total cloud change and downwelling clear-sky solar flux at the surface (Table 2). With a fully coupled Community Climate System Model version 4 (CCSM4), an earlier version of CAM (CAM4), Shields et al. (2016) have shown that higher horizontal resolution tends to decrease convective precipitation and increase large-scale precipitation. The moisture budget analysis shows that the meridional specific humidity eddy transport is the main factor leading to the bias over the Maritime Continent (Fig. 14c). Note that the analysis in this study is focused on the Maritime Continent land area only. Johnsan et al. (2016) carried out a moisture budget analysis for the whole Maritime Continent (including the ocean) and found that increased resolution causes increased moisture convergence and precipitation on the windward (southern) side of the orography, which leads to decreased moisture availability on the leeward (northern) side, reducing precipitation.
Here we presented a comprehensive evaluation of AMIP-style experiments from 1980 to 2004 using the Community Atmosphere Model version 5 and 6 prototypes (CAM5 and CAM6α) at 0.25 and 1∘ spatial resolutions. CAM6 is very different from CAM5 because it has included a unified higher-order closure scheme for the boundary layer, shallow convection and cloud macrophysics. Other updates in CAM6 include prognostic precipitation in the microphysics, a four-mode aerosol model and ice nucleation schemes. In more conventional physical parameterization suites, shallow convection, cloud macrophysical parameterization schemes and the planetary boundary layer may not be compatible with one another. The CLUBB parameterization in CAM6 instead represents a “unified” parameterization that is responsible for boundary layer processes, warm cloud macrophysics and shallow convective processes. The explicit representation of shallow convection precipitation is interactively coupled to stratiform microphysics within CLUBB, which replaces the previous convective parameterizations that diagnose the large-scale instability and the shallow convective response separately.
The major findings of this study are as follows.
- 1.
For the climatology of mean precipitation over Asia, CAM6α-1∘ substantially reduces model biases. Using an observational dataset (APHRODITE) as the baseline, the mean squared error is reduced by 11 % in CAM6α-1∘compared to CAM5-1∘. In terms of spatial distribution, the most remarkable bias of CAM5 and CAM6 is excessive precipitation in central China and a rainfall deficit over southern China. Higher resolution in both CAM5 and CAM6 decreases the mean squared error.
- 2.
CAM6α better simulates the probability distributions of daily precipitation over Tibet, Korea, Japan and northern China. Specifically, CAM6α performs better for the frequency of daily light precipitation over Korea, Japan and northern China and captures the heaviest precipitation events over most of Asia. Notably, CAM6α versions capture the observed diurnal cycle of precipitation. With a prognostic treatment of large-scale instability and the convective response, higher horizontal resolution in CAM6 leads to better performance on the frequency distributions of daily precipitation over southwestern China (close to the edge of Tibet Plateau) and heavy precipitation over northern China. The improvement, however, is dependent on CAM versions.
- 3.
Upgraded physical modules in CAM6 decrease the simulated convective precipitation and reduce the total precipitation bias over southwestern China. More complex terrain at higher resolution leads to lower convective precipitation at higher resolution for both CAM versions, which improves the model performance in total precipitation over southwestern China and northern China. Those improvements can be explained in terms of the meridional moisture convergence or zonal mean humidity eddy.
- 4.
Upgraded physical parameterizations and higher horizontal resolution substantially improve the seasonal cycle of precipitation. For temporal variability at different scales (decadal, interannual, seasonal, and diurnal), model performance varies. Higher horizontal resolution does not adequately simulate the negative correlation between the Asian monsoon index and summer precipitation in the middle and lower reaches of the Yangtze River in China. CAM6α with 1 and 0.25∘ simulates the opposite anomaly during positive PDO phases over southern China, and two CAM5 versions with different resolutions show a similar opposite anomaly. Upgraded physical parameterizations help CAM6 to simulate the drying tendency over southern China during El Niño years.
- 5.
CAM6α versions generally have improvements over CAM5 in simulating the diurnal cycle of precipitation in East Asia due to the CLUBB parameterization. CLUBB has prognostic moments that provide memory to facilitate the initiation of shallow convection in the midmorning and early afternoon.
Overall, CAM6 demonstrates better performance over CAM5, but the model fidelity at the regional scale still needs further improvement. Higher resolution improves CAM6 performance over Asia in many aspects, but some metrics are degraded. The simulated differences between 1 and 0.25∘ horizontal resolution are also dependent on the CAM versions. Careful validation of CAM6 performance at a regional scale is required before any quantitative statement about climate attribution and projections can be made.
The model code of CESM2 is released at http://www.cesm.ucar.edu/models/cesm2/, last access: 1 June 2019 (Hurrell et al., 2013). Readers can download the current release code using the following command: git clone -b release-cesm2.1.0 (https://github.com/ESCOMP/cesm, last access: 1 June 2019).
The model data are archived at https://doi.org/10.5281/zenodo.2548255 (Lin, 2019). Details about MERRA-2 can be found at https://gmao.gsfc.nasa.gov/reanalysis/MERRA-2/, last access: 1 June 2019. Details about APHRODITE can be found at http://www.chikyu.ac.jp/precip/, last access: 1 June 2019. The observational EASMI is from http://ljp.gcess.cn/dct/page/65577, last access: 1 June 2019. The ENSO index is from http://research.jisao.washington.edu/data/cti/, last access: 1 June 2019. The PDO index is from http://research.jisao.washington.edu/pdo/PDO.latest, last access: 1 June 2019. TRMM is from https://pmm.nasa.gov/data-access/downloads/trmm, last access: 1 June 2019. The CPC dataset is from https://www.esrl.noaa.gov/psd/data/gridded/data.cpc.globaltemp.html, last access: 1 June 2019.
WD and CW designed the study, LL led the analysis, AG performed CESM simulations, and NR and SCB performed the CAM5-0.25∘ simulation. LL, YX and ZW prepared the paper with contributions from all coauthors.
The authors declare that they have no conflict of interest.
We thank Richard Neale at the National Center for Atmospheric Research (NCAR) for the code for computing the diurnal cycle. We also thank Patrick Callaghan and Colin Zarzycki for assistance with the original CAM6 high-resolution simulations. We thank Julio Bacmeister for providing CAM5 data. This study was supported by the National Key Research and Development Program of China (2016YFA0602701) and the National Natural Science Foundation of China (grant 41805053). Chenglai Wu thanks the National Natural Science Foundation of China (grant 41830966) for support. The National Center for Atmospheric Research is supported by the U.S. National Science Foundation. Portions of this study were supported by the Regional and Global Model Analysis (RGMA) component of the Earth and Environmental System Modeling Program of the U.S. Department of Energy's Office of Biological & Environmental Research (BER; cooperative agreement DE-FC02-97ER62402) and the National Science Foundation. Computing resources (ark:/85065/d7wd3xhc) were provided by the Climate Simulation Laboratory at NCAR's Computational and Information Systems Laboratory, sponsored by the National Science Foundation and other agencies. An award for computer time was provided by the Innovative and Novel Computational Impact on Theory and Experiment (INCITE) program. This research used resources of the Argonne Leadership Computing Facility, which is a DOE Office of Science User Facility supported under contract DE-AC02-06CH11357.
This research has been supported by the The National Key Research and Development Program of China (grant no. 2016YFA0602701).
This paper was edited by Paul Ullrich and reviewed by two anonymous referees.
Bacmeister, J. T., Wehner, M. F., Neale, R. B., Gettelman, A., Hannay, C., Lauritzen, P. H., Caron, J. M., and Truesdale, J. E.: Exploratory high-resolution climate simulations using the Community Atmosphere Model (CAM), J. Climate, 27, 3073–3099, 2014.
Bogenschutz, P. A., Gettelman, A., Morrison, H., Larson, V. E., Craig, C., and Schanen, D. P.: Higher-order turbulence closure and its impact on climate simulations in the Community Atmosphere Model, J. Climate, 26, 9655–9676, 2013.
Bogenschutz, P. A., Gettelman, A., Hannay, C., Larson, V. E., Neale, R. B., Craig, C., and Chen, C.-C.: The path to CAM6: coupled simulations with CAM5.4 and CAM5.5, Geosci. Model Dev., 11, 235–255, https://doi.org/10.5194/gmd-11-235-2018, 2018.
Bretherton, C. S. and Park, S.: A new moist turbulence parameterization in the Community Atmosphere Model, J. Climate, 22, 3422–3448, 2009.
Chen, H., Zhou, T., Neale, R. B., Wu, X., and Zhang, G. J.: Performance of the new NCAR CAM3.5 in East Asian summer monsoon simulations: Sensitivity to modifications of the convection scheme, J. Climate, 23, 3657–3675, 2010.
Chen, M., Shi, W., Xie, P., Silva, V. B. S., Kousky, V. E., Wayne Higgins, R., and Janowiak, J. E.: Assessing objective techniques for gauge-based analyses of global daily precipitation, J. Geophys. Res., 113, D04110, https://doi.org/10.1029/2007JD009132, 2008.
Chen, X., Wu, P., Roberts, M. J., and Zhou, T.: Potential Underestimation of Future Mei-Yu Rainfall with Coarse-Resolution Climate Models, J. Climate, 31, 6711–6727, 2018.
Chou, C. and Lan, C. W.: Changes in the annual range of precipitation under global warming, J. Climate, 25, 222–235, 2012.
Deser, C. and Wallace, J. M.: El Niño events and their relation to the Southern Oscillation: 1925–1986, J. Geophys. Res., 92, 14189–14196, 1987.
Eyring, V., Bony, S., Meehl, G. A., Senior, C. A., Stevens, B., Stouffer, R. J., and Taylor, K. E.: Overview of the Coupled Model Intercomparison Project Phase 6 (CMIP6) experimental design and organization, Geosci. Model Dev., 9, 1937–1958, https://doi.org/10.5194/gmd-9-1937-2016, 2016.
Gelaro, R., McCarty, W., Suárez, M. J., Todling, R., Molod, A., Takacs, L., Randles, C. A., Darmenov, A., Bosilovich, M. G., Reichle, R., Wargan, K., Coy, L., Cullather, R., Draper, C., Akella, S., Buchard, V., Conaty, A., da Silva, A. M., Gu, W., Kim, G., Koster, R., Lucchesi, R., Merkova, D., Nielsen, J. E., Partyka, G., Pawson, S., Putman, W., Rienecker, M., Schubert, S. D., Sienkiewicz, M., and Zhao, B.: The modern-era retrospective analysis for research and applications, version 2 (MERRA-2), J. Climate, 30, 5419–5454, 2017.
Gettelman, A. and Morrison, H.: Advanced two-moment bulk microphysics for global models. Part I: Off-line tests and comparison with other schemes, J. Climate, 28, 1268–1287, 2015.
Gettelman, A., Morrison, H., and Ghan, S. J.: A new two-moment bulk stratiform cloud microphysics scheme in the Community Atmosphere Model, version 3 (CAM3). Part II: Single-column and global results, J. Climate, 21, 3660–3679, 2008.
Gettelman, A., Liu, X., Ghan, S. J., Morrison, H., Park, S., Conley, A. J., Klein, S. A., Boyle, J., Mitchell, D. L., and Li, J. L.: Global simulations of ice nucleation and ice supersaturation with an improved cloud scheme in the Community Atmosphere Model, J. Geophys. Res., 115, D18216, https://doi.org/10.1029/2009JD013797, 2010.
Gettelman, A., Bresch, D. N., Chen, C. C., Truesdale, J. E., and Bacmeister, J. T.: Projections of future tropical cyclone damage with a high-resolution global climate model, Climatic Change, 146, 575–585, 2018.
Golaz, J. C., Larson, V. E., and Cotton, W. R.: A PDF-based model for boundary layer clouds. Part I: Method and model description, J. Atmos. Sci., 59, 3540–3551, 2002a.
Golaz, J. C., Larson, V. E., and Cotton, W. R.: A PDF-based model for boundary layer clouds. Part II: Model results, J. Atmos. Sci., 59, 3552–3571, 2002b.
Gustafson Jr., W. I., Ma, P. L., and Singh, B.: Precipitation characteristics of CAM5 physics at mesoscale resolution during MC3E and the impact of convective timescale choice, J. Adv. Model. Earth Sy., 6, 1271–1287, 2014.
Herold, N., Kala, J., and Alexander, L. V.: The influence of soil moisture deficits on Australian heatwaves, Environ. Res. Lett., 11, 064003, 2016a.
Herold, N., Alexander, L. V., Donat, M. G., Contractor, S., and Becker, A.: How much does it rain over land?, Geophys. Res. Lett., 43, 341–348, 2016b.
Hoell, A., Hoerling, M., Eischeid, J., Wolter, K., Dole, R., Perlwitz, J., Xu, T., and Cheng, L.: Does El Niño intensity matter for California precipitation?, Geophys. Res. Lett., 43, 819–825, 2016.
Hoose, C., Kristjánsson, J. E., and Burrows, S. M.: How important is biological ice nucleation in clouds on a global scale?, Environ. Res. Lett., 5, 024009, https://doi.org/10.1088/1748-9326/5/2/024009, 2010.
Huffman, G. J. and Bolvin, D. T.: TRMM and other data precipitation data set documentation, NASA, Greenbelt, USA, 28(2.3), 2013.
Hurrell, J. W., Holland, M. M., Gent, P. R., Ghan, S., Kay, J. E., Kushner, P. J., Lamarque, J., Large, W. G., Lawrence, D., Lindsay, K., Lipscomb, W. H., Long, M. C., Mahowald, N., Marsh, D. R., Neale, R. B., Rasch, P., Vavrus, S., Vertenstein, M., Bader, D., Collins, W. D., Hack, J. J., Kiehl, J., and Marshall, S.: The community earth system model: a framework for collaborative research, B. Am. Meteorol. Soc., 94, 1339–1360, 2013.
Jiang, Y., Yang, X. Q., and Liu, X.: Seasonality in anthropogenic aerosol effects on East Asian climate simulated with CAM5, J. Geophys. Res.-Atmos., 120, 10837–10861, 2015.
Johnson, S. J., Levine, R. C., Turner, A. G., Martin, G. M., Woolnough, S. J., Schiemann, R., Mizielinski, M. S., Roberts, M. J., Pier Luigi Vidale, P. L., Demory, M.-E., and Strachan, J.: The resolution sensitivity of the South Asian monsoon and Indo-Pacific in a global 0.35 AGCM, Clim. Dynam., 46, 807–831, 2016.
Kobayashi, S., Ota, Y., Harada, Y., Ebita, A., Moriya, M., Onoda, H., Onogi, K., Kamahori, H., Kobayashi, C., Endo, H., Miyaoka, K., and Takahashi, K.: The JRA-55 reanalysis: General specifications and basic characteristics, J. Meteorol. Soc. Jpn., 93, 5–48, 2015.
Kooperman, G. J., Pritchard, M. S., Burt, M. A., Branson, M. D., and Randall, D. A.: Robust effects of cloud superparameterization on simulated daily rainfall intensity statistics across multiple versions of the Community Earth System Model, J. Adv. Model. Earth Sy., 8, 140–165, 2016.
Kopparla, P., Fischer, E. M., Hannay, C., and Knutti, R.: Improved simulation of extreme precipitation in a high-resolution atmosphere model, Geophys. Res. Lett., 40, 5803–5808, 2013.
Kusunoki, S. and Arakawa, O.: Are CMIP5 models better than CMIP3 models in simulating precipitation over East Asia?, J. Climate, 28, 5601–5621, 2015.
Lau, N. C. and Ploshay, J. J.: Simulation of synoptic-and subsynoptic-scale phenomena associated with the East Asian summer monsoon using a high-resolution GCM, Mon. Weather Rev., 137, 137–160, 2009.
Lauritzen, P. H., Nair, R. D., Herrington, A. R., Callaghan, P., Goldhaber, S., Dennis, J. M., Bacmeister, J. T., Eaton, B. E., Zarzycki, C. M., Taylor, M. A., Ullrich, P. A., Dubos, T., Gettelman, A., Neale, R. B., Dobbins, B., Reed, K. A., Hannay, C., Medeiros, B., Benedict, J. J., and Tribbia, J. J.: NCAR Release of CAM-SE in CESM2.0: A Reformulation of the Spectral Element Dynamical Core in Dry-Mass Vertical Coordinates With Comprehensive Treatment of Condensates and Energy, J. Adv. Model. Earth Sy., 10, 1537–1570, 2018.
Li, J. and Zeng, Q.: A unified monsoon index, Geophys. Res. Lett., 29, 115-1–115-4, 2002.
Li, J. and Zeng, Q.: A new monsoon index and the geographical distribution of the global monsoons, Adv. Atmos. Sci., 20, 299–302, 2003.
Li, J., Yu, R., and Zhou, T.: Seasonal variation of the diurnal cycle of rainfall in southern contiguous China, J. Climate, 21, 6036–6043, 2008.
Li, J., Yu, R., Yuan, W., Chen, H., Sun, W., and Zhang, Y.: Precipitation over East Asia simulated by NCAR CAM5 at different horizontal resolutions, J. Adv. Model. Earth Sy., 7, 774–790, 2015.
Lin, L., Xu, Y., Wang, Z., Diao, C., Dong, W., and Xie, S. P.: Changes in extreme rainfall over India and China attributed to regional aerosol‐cloud interaction during the late 20th century rapid industrialization, Geophys. Res. Lett., 45, 7857–7865, 2018.
Lin, L.: CAM6 simulation of mean and extreme precipitation over Asia: Sensitivity to upgraded physical parameterizations and higher horizontal resolution, Zenodo, https://doi.org/10.5281/zenodo.2548255, 2019.
Lin, L., Gettelman, A., Feng, S., and Fu, Q.: Simulated climatology and evolution of aridity in the 21st century, J. Geophys. Res.-Atmos., 120, 5795–5815, 2015.
Lin, L., Gettelman, A., Fu, Q., and Xu, Y.: Simulated differences in 21st century aridity due to different scenarios of greenhouse gases and aerosols, Climatic Change, 146, 407–422, 2016.
Liu, X., Easter, R. C., Ghan, S. J., Zaveri, R., Rasch, P., Shi, X., Lamarque, J.-F., Gettelman, A., Morrison, H., Vitt, F., Conley, A., Park, S., Neale, R., Hannay, C., Ekman, A. M. L., Hess, P., Mahowald, N., Collins, W., Iacono, M. J., Bretherton, C. S., Flanner, M. G., and Mitchell, D.: Toward a minimal representation of aerosols in climate models: description and evaluation in the Community Atmosphere Model CAM5, Geosci. Model Dev., 5, 709–739, https://doi.org/10.5194/gmd-5-709-2012, 2012.
Liu, X., Ma, P.-L., Wang, H., Tilmes, S., Singh, B., Easter, R. C., Ghan, S. J., and Rasch, P. J.: Description and evaluation of a new four-mode version of the Modal Aerosol Module (MAM4) within version 5.3 of the Community Atmosphere Model, Geosci. Model Dev., 9, 505–522, https://doi.org/10.5194/gmd-9-505-2016, 2016.
Mantua, N. J., Hare, S. R., Zhang, Y., Wallace, J. M., and Francis, R. C.: A Pacific interdecadal climate oscillation with impacts on salmon production, B. Am. Meteorol. Soc., 78, 1069–1080, https://doi.org/10.1175/1520-0477(1997)078<1069:APICOW>2.0.CO;2, 1997.
Martin, G. M., Klingaman, N. P., and Moise, A. F.: Connecting spatial and temporal scales of tropical precipitation in observations and the MetUM-GA6, Geosci. Model Dev., 10, 105–126, https://doi.org/10.5194/gmd-10-105-2017, 2017.
Meehl, G. A., Hu, A., Arblaster, J. M., Fasullo, J., and Trenberth, K. E.: Externally forced and internally generated decadal climate variability associated with the Interdecadal Pacific Oscillation, J. Climate, 26, 7298–7310, 2013.
Meehl, G. A., Yang, D., Arblaster, J. M., Bates, S., Rosenbloom, N., Neale, R., Bacmeister, J., Truesdale, Hannay, C. Shields, J., Small, F. B., and Danabasoglu, G.: Effects of model resolution, physics, and coupling on Southern Hemisphere storm tracks in CESM1.3, Geophys. Res. Lett., in preparation, 2019.
Morrison, H. and Gettelman, A.: A new two-moment bulk stratiform cloud microphysics scheme in the Community Atmosphere Model, version 3 (CAM3), Part I: Description and numerical tests, J. Climate, 21, 3642–3659, 2008.
Neale, R. B., Chen, C. C., Gettelman, A., Lauritzen, P. H., Park, S., Williamson, D. L., Conley, A. J., Garcia, R., Kinnison, D., Lamarque, J., Marsh, D., Mills, M., Smith, A. K., Tilmes, S., Vitt, F., Morrison, H., Cameron-Smith, P., Collins, W. D., Iacono, M. J., Easter, R. C., Ghan, S. J., Liu, X., Rasch, P. J., and Taylor, M. A.: Description of the NCAR community atmosphere model (CAM 5.0), NCAR Tech. Note NCAR/TN-486+ STR, 1, 1–12, 2010.
Palmer, T.: Climate forecasting: Build high-resolution global climate models, Nature, 515, 338–339, 2014.
Park, S. and Bretherton, C. S.: The University of Washington shallow convection and moist turbulence schemes and their impact on climate simulations with the Community Atmosphere Model, J. Climate, 22, 3449–3469, 2009.
Park, S., Bretherton, C. S., and Rasch, P. J.: Integrating cloud processes in the Community Atmosphere Model, version 5, J. Climate, 27, 6821–6856, 2014.
Seager, R., Naik, N., and Vecchi, G. A.: Thermodynamic and dynamic mechanisms for large-scale changes in the hydrological cycle in response to global warming, J. Climate, 23, 4651–4668, 2010.
Sharma, V., Kilic, A., and Irmak, S.: Impact of scale/resolution on evapotranspiration from Landsat and MODIS images, Water Resour. Res., 52, 1800–1819, 2016.
Sheffield, J., Wood, E. F., and Roderick, M. L.: Little change in global drought over the past 60 years, Nature, 491, 435–438, 2012.
Shields, C. A., Kiehl, J. T., and Meehl, G. A.: Future changes in regional precipitation simulated by a half-degree coupled climate model: Sensitivity to horizontal resolution, J. Adv. Model. Earth Sy., 8, 863–884, 2016.
Song, F. and Zhou, T.: The crucial role of internal variability in modulating the decadal variation of the East Asian summer monsoon–ENSO relationship during the twentieth century, J. Climate, 28, 7093–7107, 2015.
Stephan, C. C., Klingaman, N. P., Vidale, P. L., Turner, A. G., Demory, M.-E., and Guo, L.: Interannual rainfall variability over China in the MetUM GA6 and GC2 configurations, Geosci. Model Dev., 11, 1823–1847, https://doi.org/10.5194/gmd-11-1823-2018, 2018a.
Stephan, C. C., Ng, Y. H., and Klingaman, N. P.: On Northern HemisphereWave Patterns Associated with Winter Rainfall Events in China, Adv. Atmos. Sci., 35, 1021–1034, 2018b.
Su, T., Xue, F., Chen, M., and Dong, X.: A mechanism study for the intraseasonal oscillation impact on the two northward jumps of the western Pacific subtropical high, Chinese Journal of Atmospheric Sciences, 41, 437–460, https://doi.org/10.3878/j.issn.1006-9895.1609.16125, 2017 (in Chinese).
Taylor, K. E.: Summarizing multiple aspects of model performance in a single diagram, J. Geophys. Res., 106, 7183–7192, 2001.
Trenberth, K. E. and Guillemot, C. J.: Evaluation of the global atmospheric moisture budget as seen from analyses, J. Climate, 8, 2255–2272, 1995.
Trenberth, K. E., Dai, A., Van Der Schrier, G., Jones, P. D., Barichivich, J., Briffa, K. R., and Sheffield, J.: Global warming and changes in drought, Nat. Climatic Change, 4, 17–22, 2014.
Vinoj, V., Rasch, P. J., Wang, H., Yoon, J. H., Ma, P. L., Landu, K., and Singh, B.: Short-term modulation of Indian summer monsoon rainfall by West Asian dust, Nat. Geosci., 7, 308–313, 2014.
Walters, D., Boutle, I., Brooks, M., Melvin, T., Stratton, R., Vosper, S., Wells, H., Williams, K., Wood, N., Allen, T., Bushell, A., Copsey, D., Earnshaw, P., Edwards, J., Gross, M., Hardiman, S., Harris, C., Heming, J., Klingaman, N., Levine, R., Manners, J., Martin, G., Milton, S., Mittermaier, M., Morcrette, C., Riddick, T., Roberts, M., Sanchez, C., Selwood, P., Stirling, A., Smith, C., Suri, D., Tennant, W., Vidale, P. L., Wilkinson, J., Willett, M., Woolnough, S., and Xavier, P.: The Met Office Unified Model Global Atmosphere 6.0/6.1 and JULES Global Land 6.0/6.1 configurations, Geosci. Model Dev., 10, 1487–1520, https://doi.org/10.5194/gmd-10-1487-2017, 2017.
Wang, Y., Zhang, G. J., and Jiang, Y.: Linking stochasticity of convection to large-scale vertical velocity to improve Indian summer monsoon simulation in the NCAR CAM5, J. Climate, 31, 6985–7002, 2018.
Wehner, M. F., Reed, K. A., Li, F., Bacmeister, J., Chen, C. T., Paciorek, C., Gleckler, P. J., Sperber, K. R., Collins, W. D., Gettelman, A., and Jablonowski, C.: The effect of horizontal resolution on simulation quality in the Community Atmospheric Model, CAM5.1, J. Adv. Model. Earth Sy., 6, 980–997, 2014.
Yao, J., Zhou, T., Guo, Z., Chen, X., Zou, L., and Sun, Y.: Improved performance of high-resolution atmospheric models in simulating the East Asian summer monsoon rain belt, J. Climate, 30, 8825–8840, 2017.
Yatagai, A., Kamiguchi, K., Arakawa, O., Hamada, A., Yasutomi, N., and Kitoh, A.: APHRODITE: Constructing a long-term daily gridded precipitation dataset for Asia based on a dense network of rain gauges, B. Am. Meteorol. Soc., 93, 1401–1415, 2012.
Zhang, C., Wang, M., Morrison, H., Somerville, R. C., Zhang, K., Liu, X., and Li, J. L. F.: Investigating ice nucleation in cirrus clouds with an aerosol-enabled Multiscale Modeling Framework, J. Adv. Model. Earth Sy., 6, 998–1015, 2014.
Zhang, G. J. and McFarlane, N. A.: Sensitivity of climate simulations to the parameterization of cumulus convection in the Canadian Climate Centre general circulation model, Atmos. Ocean, 33, 407–446, 1995.
Zhang, X., Alexander, L., Hegerl, G. C., Jones, P., Tank, A. K., Peterson, T. C., Trewin, B., and Zwiers, F. W.: Indices for monitoring changes in extremes based on daily temperature and precipitation data, WIREs Clim. Change, 2, 851–870, 2011.
Zhang, Y. and Chen, H.: Comparing CAM5 and superparameterized CAM5 simulations of summer precipitation characteristics over continental East Asia: Mean state, frequency–intensity relationship, diurnal cycle, and influencing factors, J. Climate, 29, 1067–1089, 2016.
Zhang, Y., Chen, H., and Yu, R.: Simulations of stratus clouds over eastern China in CAM5: Sensitivity to horizontal resolution, J. Climate, 27, 7033–7052, 2014.
Zhao, C., Yao, S., Zhang, S., Han, H., Zhao, Q., and Yi, S.: Validation of the accuracy of different precipitation datasets over Tianshan mountainous area, Adv. Meteorol., 2015, 617382, https://doi.org/10.1155/2015/617382, 2015.
Zhou, T. J. and Li, Z.: Simulation of the East Asian summer monsoon using a variable resolution atmospheric GCM, Clim. Dynam., 19, 167–180, 2002.
Zhou, T., Song, F., Lin, R., Chen, X., and Chen, X.: The 2012 North China floods: Explaining an extreme rainfall event in the context of a longer-term drying tendency, B. Am. Meteorol. Soc., 94, S49–S51, 2013.
- Abstract
- Introduction
- Methods
- Climatological statistics of mean precipitation and daily extreme precipitation
- Variability of simulated precipitation over Asian regions on various timescales
- Change due to physical parameterizations and high resolution: northern China, southwestern China and the Maritime Continent
- Summary
- Code availability
- Data availability
- Author contributions
- Competing interests
- Acknowledgements
- Financial support
- Review statement
- References