the Creative Commons Attribution 4.0 License.
the Creative Commons Attribution 4.0 License.
 | 20 Nov 2019
A new model of the coupled carbon, nitrogen, and phosphorus cycles in the terrestrial biosphere (QUINCY v1.0; revision 1996)
Silvia Caldararu
Jan Engel
Melanie Kern
Marleen Pallandt
Reiner Schnur
The dynamics of terrestrial ecosystems are shaped by the coupled cycles of carbon, nitrogen, and phosphorus, and these cycles are strongly dependent on the availability of water and energy. These interactions shape future terrestrial biosphere responses to global change. Here, we present a new terrestrial ecosystem model, QUINCY (QUantifying Interactions between terrestrial Nutrient CYcles and the climate system), which has been designed from scratch to allow for a seamless integration of the fully coupled carbon, nitrogen, and phosphorus cycles with each other and also with processes affecting the energy and water balances in terrestrial ecosystems. This new model includes (i) a representation of plant growth which separates source (e.g. photosynthesis) and sink (growth rate of individual tissues, constrained by temperature and the availability of water and nutrients) processes; (ii) the acclimation of many ecophysiological processes to meteorological conditions and/or nutrient availability; (iii) an explicit representation of vertical soil processes to separate litter and soil organic matter dynamics; (iv) a range of new diagnostics (leaf chlorophyll content; 13C, 14C, and 15N isotope tracers) to allow for a more in-depth model evaluation. In this paper, we present the model structure and provide an assessment of its performance against a range of observations from global-scale ecosystem monitoring networks. We demonstrate that QUINCY v1.0 is capable of simulating ecosystem dynamics across a wide climate gradient, as well as across different plant functional types. We further provide an assessment of the sensitivity of key model predictions to the model's parameterisation. This work lays the ground for future studies to test individual process hypotheses using the QUINCY v1.0 framework in the light of ecosystem manipulation observations, as well as global applications to investigate the large-scale consequences of nutrient-cycle interactions for projections of terrestrial biosphere dynamics.
- Article
(3243 KB) -
Supplement
(5097 KB) - BibTeX
- EndNote


Past, present, and future changes in climatic conditions and atmospheric CO2 concentrations affect terrestrial vegetation and soils (Hou et al., 2018; De Kauwe et al., 2013; Swann et al., 2016), which in turn induce biogeophysical and biogeochemical feedbacks to the atmosphere (Bonan, 2008; Friedlingstein et al., 2014; Zaehle et al., 2010). To predict the likely trajectories of terrestrial ecosystems under climate change and their climate feedbacks, it is important to develop and test advanced modelling tools for the terrestrial biosphere (Sitch et al., 2015). Global terrestrial biosphere models (TBMs) have evolved during the last decades alongside our understanding of soil and vegetation functioning (Bonan and Doney, 2018). Early vegetation models included only processes related to the carbon (C) and water cycle (e.g. Sitch et al., 2003; Krinner et al., 2005; Dickinson et al., 2006; Raddatz et al., 2007; Clark et al., 2011). The recognition that nitrogen (N) has a pivotal role in the future dynamics and C storage of terrestrial ecosystems (Vitousek and Howarth, 1991; Hungate et al., 2003) has led to the development of a new generation of models that include a comprehensive representation of the N cycle (Thornton et al., 2007; Zaehle and Friend, 2010; Gerber et al., 2010; Wårlind et al., 2014). More recently, phosphorus (P) cycle processes have also been included in TBMs (Wang et al., 2010; Goll et al., 2017; Yang et al., 2014), as these can be important to understanding ecosystem response in naturally P-limited tropical regions (Yang et al., 2014) or in regions with large atmospheric N deposition and ensuing increases in P limitation (Peñuelas et al., 2013; Vitousek et al., 2010).
Although the number of element cycles and thereby processes considered in TBMs has increased in an effort to provide more realistic models (Zaehle and Dalmonech, 2011; Prentice et al., 2015), there is little consensus on how to represent many of these processes in a realistic but robust and computationally efficient manner. Often, small-scale soil and vegetation processes can lead to larger-scale feedbacks (e.g. Hararuk et al., 2015; Bradford et al., 2016) and therefore need to be included in sufficient detail in terrestrial biosphere models. Recent model–data synthesis studies with observations from Free-Air CO2 Enrichment (FACE) experiments have revealed a number of fundamental issues in the way that state-of-the-art models represent plant growth (De Kauwe et al., 2014), nitrogen dynamics (Zaehle et al., 2014), and water responses (De Kauwe et al., 2013) to elevated CO2. This highlights the need for a modular framework that allows testing multiple hypothesis for uncertain processes, thereby gaining an understanding on how process information and importance propagates from site to regional and global scales (Knauer et al., 2016; Peng et al., 2014; Thum et al., 2017).
One important obstacle to such an approach is the gradual development of terrestrial biosphere models, which implies that new features, such as processes describing the dynamics of the N or P cycle, have been added to existing carbon-cycle-only land surface model formulations. This evolutionary approach can result in a situation where assumptions that were made in earlier versions of the model are incompatible with the new assumptions, or that the old model structure cannot appropriately accommodate new structures, therefore limiting the ability to take new ecophysiological understanding into account. To overcome such issues, we have developed a new terrestrial biosphere model, QUINCY (QUantifying Interactions between terrestrial Nutrient CYcles and the climate system; Fig. 1), benefiting from advances in the understanding of global ecology. This new model is formulated based on the following:
-
The recognition that plant growth may be limited by source (e.g. photosynthesis) or sink (growth rate of individual tissues, constrained by nutrients, temperature, and water availability) processes (Fatichi et al., 2013): we account for this decoupling by introducing a short-term (“labile”) and a long-term (“reserve”) storage pool for carbon and nutrients, which allow plants to adjust the carbon partitioning between growth, respiration, and storage according to nutrient availability, moisture stress, and temperature.
-
The consideration of gradual changes in nutrient availability over time and their effects on the surface carbon, water, and energy exchanges: the model represents all biogeochemical and biogeophysical processes in the model at a half-hourly time step. Many processes, e.g. the response of photosynthesis, tissue stoichiometry, and fine root growth to nutrient shortage, are assumed to have a process-specific “memory” timescale, causing a lagged response to instantaneous variations in the environmental conditions. This includes a representation of the acclimation of both photosynthesis and maintenance respiration to the prevailing growth temperature (June et al., 2004; Atkin et al., 2014; Mercado et al., 2018). Together with a dynamic representation of photosynthetic capacity based on soil nutrient availability, this feature reduces the need for regionally defined plant functional types (e.g. boreal versus temperate type) needed to describe the vegetation in different regions.
-
The recognition that biogeochemical processes in the soil (e.g. soil organic matter decomposition, nitrification, denitrification, and weathering) vary strongly within the soil profile (Ahrens et al., 2015; Koven et al., 2013): therefore, soil physics, soil biogeochemical processes, and their interaction with vegetation processes through plant nutrient/water uptake as well as root turnover are explicitly vertically resolved.
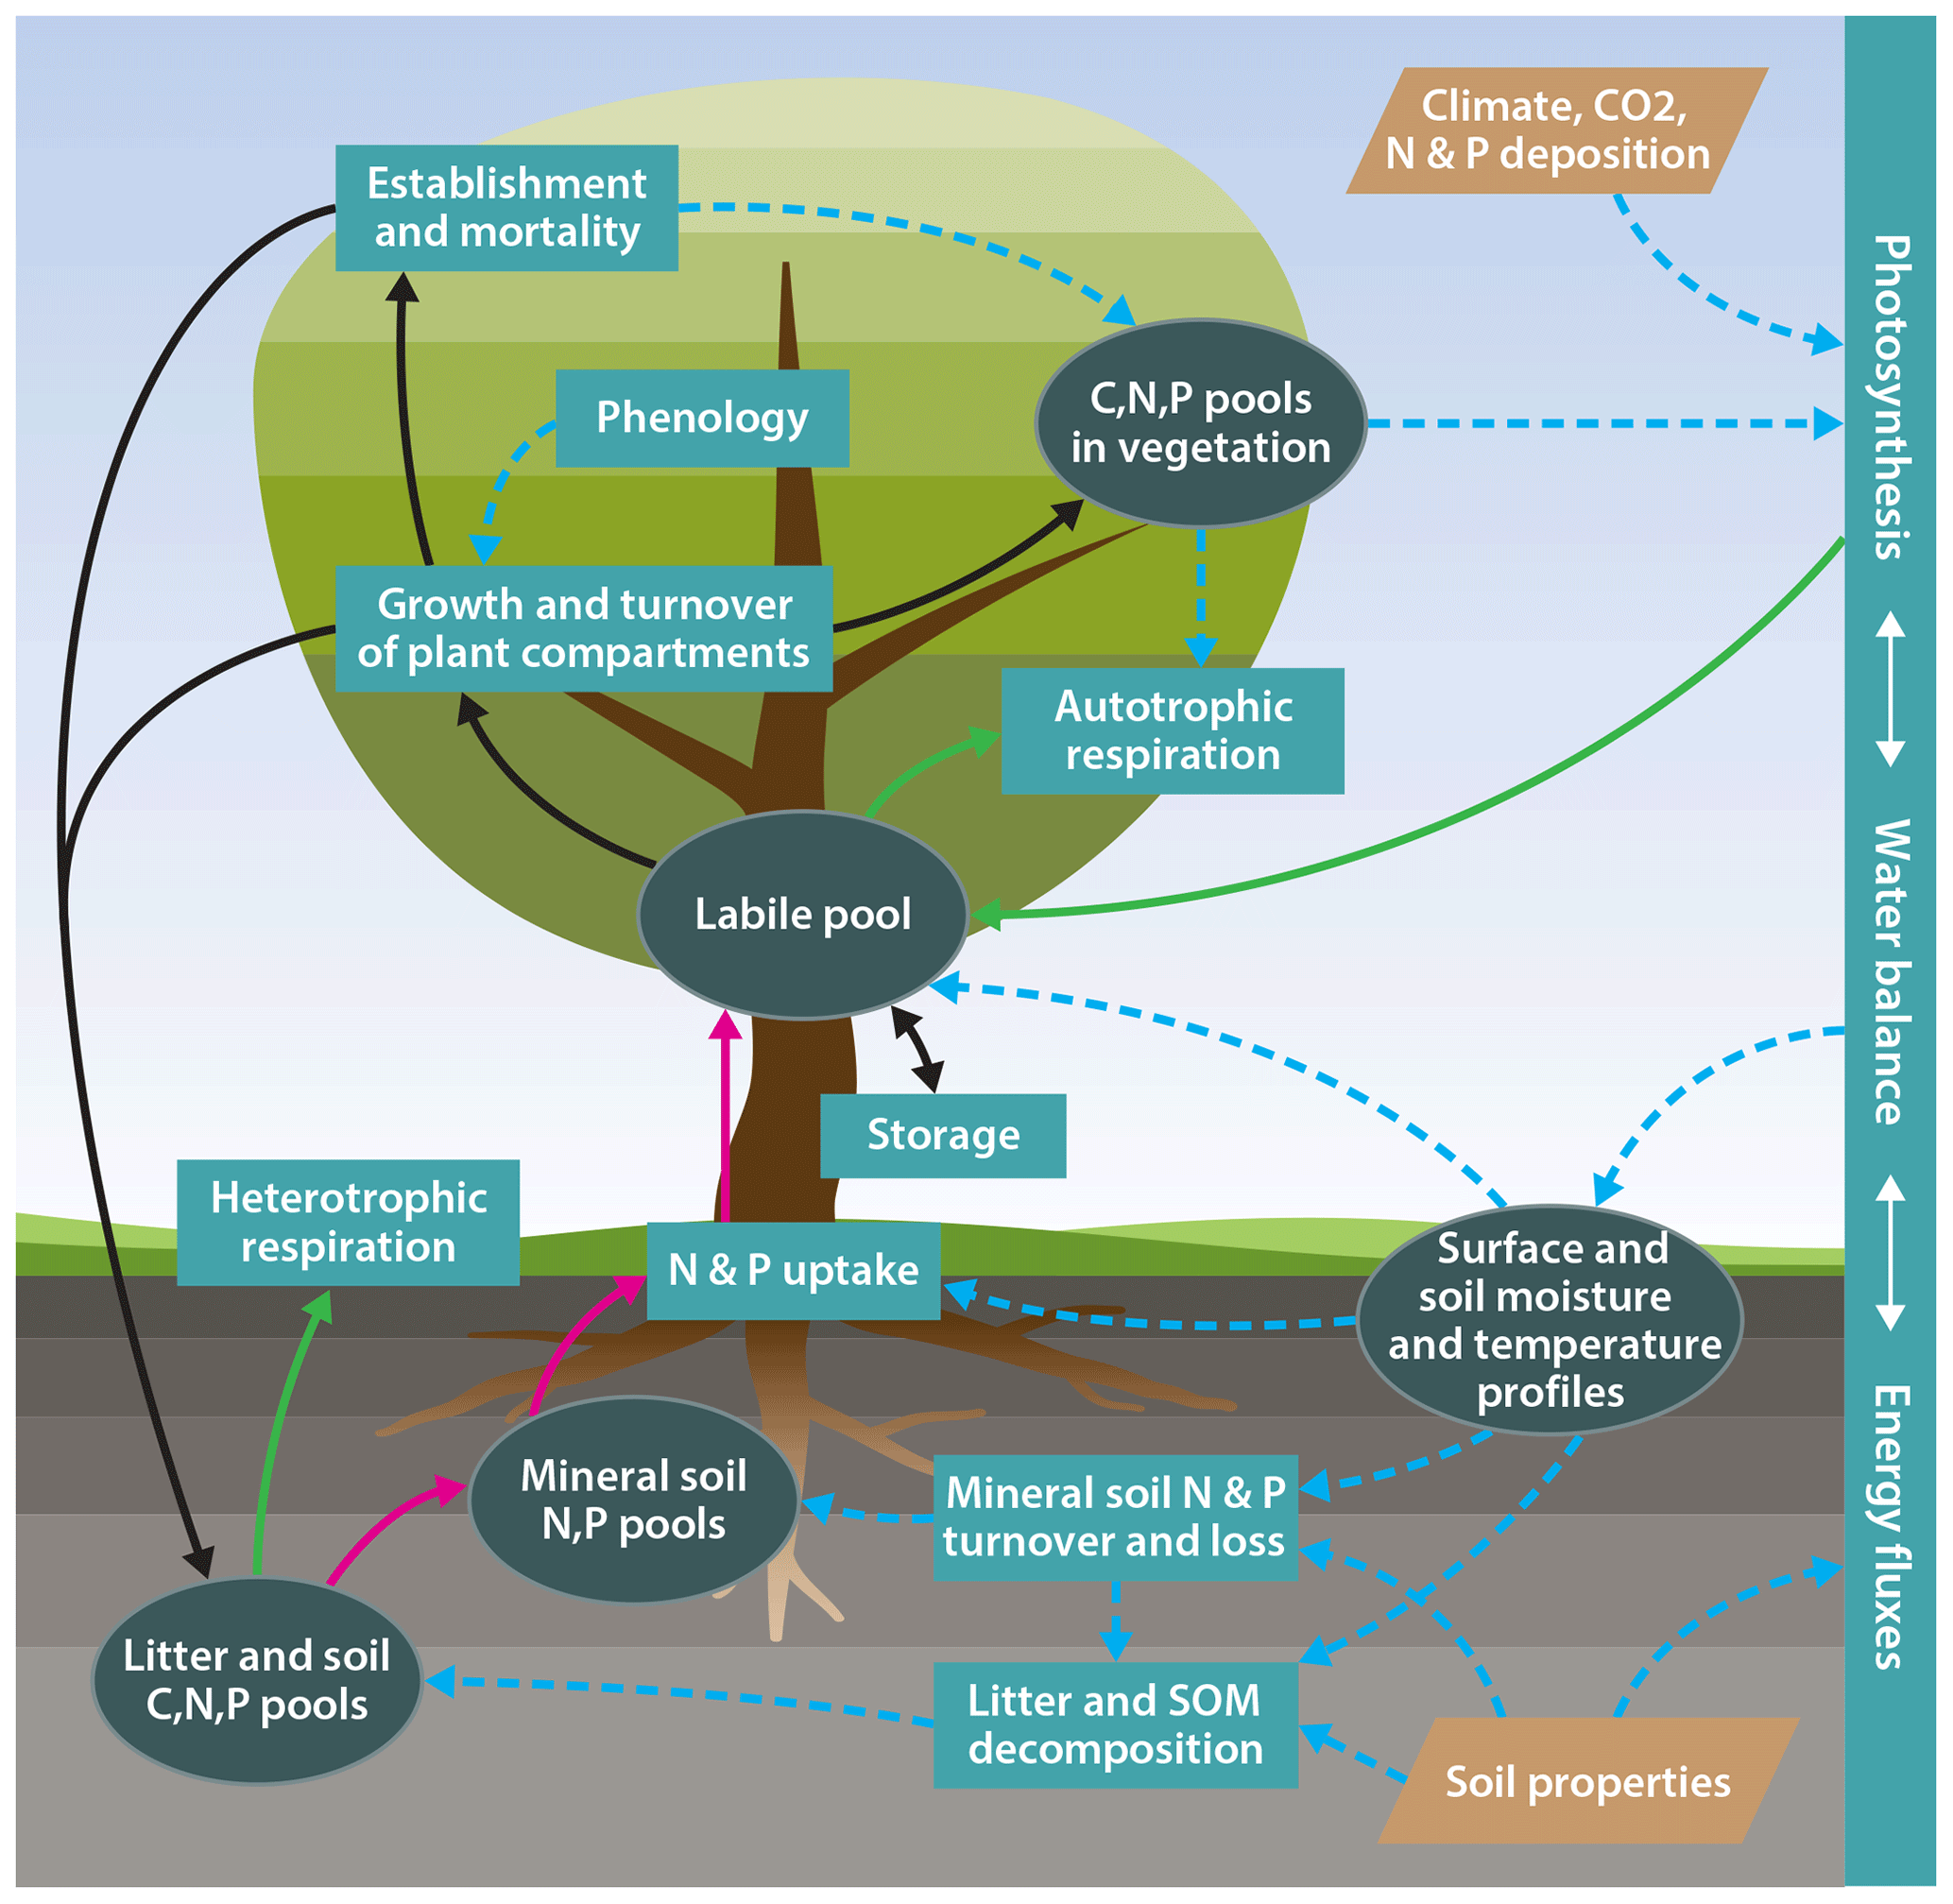
Figure 1Schematic representation of the model structure. Ellipses: biogeochemical pools and other state variables; rectangles: biogeochemical processes; tetraethers: model input; solid green lines: carbon fluxes; solid dark red lines: nitrogen and phosphorus fluxes; solid black lines: carbon, nitrogen, and phosphorus fluxes; dotted blue lines: effects.
The QUINCY model contains entirely newly written code, although certain process representations are adapted from literature and previous models, including but not limited to OCN (Zaehle and Friend, 2010) and JSBACH3 (Roeckner et al., 2003). This new code approach allows for an appropriate separation of model infrastructure (e.g. memory allocation) and scientific code, and a better integration of model components. This permits us to include an internally consistent representation of ecosystem processes and in particular nutrient effects on plant photosynthesis, growth, and soil organic matter turnover through the inclusion of a common set of underlying hypotheses.
The aim of this paper is to present the basic structure and main features of the baseline version of this new model. We provide an assessment of the model's performance against a range of observations from global-scale ecosystem monitoring networks to demonstrate that the framework is capable of simulating ecosystem C fluxes in agreement with these observations given the simulated N, P, and water availability across a large gradient in climate and soil conditions, as well as across different plant functional types. To aid this understanding, we provide an assessment of the model's sensitivity to its parameterisation.
The information from this paper provides the background for future process-specific studies to test and improve process representation. In particular, we have formulated this model in a modular structure to facilitate the testing of multiple hypotheses for one particular process and to reduce the scope of the model (e.g. separately simulating canopy dynamics, vegetation dynamics, or soil biogeochemistry) to study the impact of particular processes (see the Supplement for details). Additionally, we have added a number of important diagnostics that will allow further ways of model evaluation. For instance, the leaf chlorophyll content is explicitly modelled from the leaf N to improve the simulated light response of photosynthesis throughout the canopy (Kull and Kruijt, 1998), but this will also allow for novel ways to compare the simulation results with in situ and remotely sensed observations in the future. The model also keeps track of the isotopic composition of C (in terms of 13C and 14C) and N (15N), which will allow to make use of natural abundance data and isotope tracer studies in the future.
2.1 Model description
QUINCY model v1.0 (rev. 1996) represents the coupled biogeochemical cycles of carbon (C), nitrogen (N), and phosphorus (P) in terrestrial ecosystems, as well as their interaction with the terrestrial water and energy balance (Fig. 1). The model traces the flow of these elements as well as C and N isotopes (13C and 14C, and 15N) through vegetation and soil at a half-hourly time step. The model considers eight broadly defined plant functional types (PFTs; see Table 1), representing differences in leaf type (herbaceous, broad-leaved, coniferous), phenology (evergreen, rain green, and summer green), growth form (grasses and trees), and photosynthesis type (C3 versus C4 photosynthesis) with a set of traits describing time-invariant functional differences across types (see Table S7 in the Supplement). Different from other TBMs, certain “soft” plant functional type characteristics, such as the photosynthetic capacity of leaves or the temperature sensitivity of photosynthesis and respiration acclimate to local environmental conditions, lead to a smoother transition of ecosystem functioning across ecoclimatic gradients. The number of PFTs is not embedded into the code structure and therefore new PFTs can be easily added if sufficient data to parameterise these are available.
Table 1Description of plant functional types used in the model.

A brief overview of the model structure and key processes is given in this section. The detailed mathematical description of the model processes can be found in the Supplement. Although conceived to be coupled to the land surface scheme of an Earth system model, the model is currently applied stand-alone at the ecosystem scale. The stand-alone version requires half-hourly short- and longwave radiation, air temperature, precipitation and snowfall, wind velocity, atmospheric CO2, 13CO2, 14CO2 mole fractions, as well as rates of NHx, NOy, and PO4 deposition as time-dependent driving data. In addition, the model requires input describing the geographical coordinates, vegetation type, and soil physical and chemical parameters (texture, bulk density, rooting and soil depth, as well as inorganic soil P content).
2.1.1 Vegetation processes
Expanding on the concept employed by the Lund–Potsdam–Jena (LPJ) model (Sitch et al., 2003) and OCN (Zaehle and Friend, 2010), vegetation is characterised by an average individual representative of a PFT, composed of three fast-lived structural tissue types (pools: leaves, fine roots, and fruits), a respiring non-structural pool (labile), as well as a seasonal, non-respiring, and non-structural storage pool (reserve). In the case of tree vegetation types, three longer-lived structural tissue types (sapwood, heartwood, and coarse roots) are additionally represented, as are stand characteristics (height, diameter, and individuum density).
Building on Zaehle and Friend (2010), photosynthesis is calculated for sunlit and shaded leaves separately, explicitly taking the vertical canopy gradient of light, foliar chlorophyll, and photosynthetic N into account (Kull and Kruijt, 1998), with extensions for C4 photosynthesis (Friend et al., 2009) and the temperature response as in Bernacchi et al. (2001, Supplement Sect. S2). Different from OCN, temperature acclimation of photosynthesis is modelled to acclimate to air temperature according to Friend (2010). Photosynthetic parameters, including chlorophyll content, further are assumed to depend on leaf N concentration (Friend et al., 1997). As foliar mass and N concentrations both respond to soil N availability (Vicca et al., 2012; Hyvönen et al., 2007; Meyerholt and Zaehle, 2015), this causes canopy photosynthesis to be directly affected by soil N availability in addition to meteorological variables. The stomatal conductance is coupled to the calculation of photosynthesis according to the Ball–Berry formulation (Ball et al., 1987; Knauer et al., 2015). Different from Zaehle and Friend (2010), QUINCY v1.0 accounts for stomatal and biochemical limitations by soil moisture (Egea et al., 2011, Supplement Eq. S18). In addition, photosynthesis can become downregulated due to sink limitation, when nutrient or water availability or low temperatures limit growth and cause accumulation of photosynthates in the labile pool (Fatichi et al., 2013; Hartmann et al., 2018, see Fig. S1 in the Supplement for an example). Plant nutrient uptake is assumed linearly dependent on fine root biomass density for each soil layer and follows a Michaelis–Menten parameterisation to simulate the effects of soil soluble NH4, NO3, and PO4 concentrations (Zaehle and Friend, 2010, Supplement Sect. S4.5). As in Zaehle and Friend (2010), plant internal nutrient demand can up- or downregulate uptake, but rather than relying on instantaneous plant demand, the response of plant nutrient uptake to plant demand is modelled as a lagged response (of a few days) to balance short-term fluctuations in photosynthesis and soil nutrient availability and to represent memory effects in the plant's control of its nutrient uptake (Fig. S2).
As in LPJ and OCN, maintenance respiration is calculated for each tissue type as a function of its N content and tissue temperature (Sect. S3.3, Lloyd and Taylor, 1994). However, a novel feature of QUINCY v1.0 is that it does account for the observed acclimation of basal respiration rates to growth temperature (Atkin et al., 2014). A second new feature is that the costs for actual nutrient transformation, which are dependent on the rate of uptake and source of nitrogen (Eq. S24, Zerihun et al., 1998), are included in the root maintenance respiration term. While maintenance respiration takes priority over growth, under severe C deficit after the downregulation of photosynthesis, the maintenance respiration and nutrient uptake respiration can become downregulated by the meristem activity.
Different from earlier model approaches that included a labile pool (Zaehle and Friend, 2010), plant growth is modelled as the balance of source processes (photosynthesis, nitrogen and phosphorus uptake) and the capacity of the plant to create sinks (production of new biomass tissue, respiration, and storage; Sect. S3.2). The capacity of the plant to generate sinks is dependent on (i) the activity of the plant's meristem controlling the usage of the labile pool for growth, which is reduced at low air temperature and/or soil moisture (Fatichi et al., 2013); (ii) the partitioning of its labile resource to new tissue growth and the availability of nitrogen and phosphorus to create these tissues (Zaehle and Friend, 2010); (iii) the need for longer-term storage production (Fisher et al., 2010); and (iv) respiration for maintenance, which is given priority over growth of new tissue. Short-term fluctuations in the balance between carbon acquisition through photosynthesis and nutrient acquisition by roots are balanced by the timescale of the labile pool turnover. Seasonal and longer-term fluctuations are balanced to some extent by the build-up and use of the reserve pool. The flow of compounds between the labile and reserve pools (Sect. S3.6) is described by a set of pull (from the reserve pool) and push (to the reserve pool) mechanisms attempting to simulate the signalling related to the beginning of the growing season (phenological pull), the need for maintenance and growth (maintenance pull), as well as to provide resources for the next growing season or resilience against interannual variability (reserve push).
Tissue growth follows a set of allometric equations (Shinozaki et al., 1964; Sitch et al., 2003; Zaehle and Friend, 2010), describing size-dependent relationships of foliar, fine root, coarse root, sapwood, and fruit biomass (Sect. S3.4). The allometric relationship between leaves and fine roots responds to N, P, and water limitation and therefore increases uptake capacity under nutrient limitation. The C:N and N:P ratios of the leaves and fine roots are flexible within empirical bounds and respond dynamically to an imbalance between C and N, or N and P availability, respectively (Sect. S3.5). The allometric equations and the N and P content of each tissue give the stoichiometric constraint of plant growth. Tissue turnover is considered at two timescales: (i) the rapid breakdown of enzymes (N) and associated RNA (P) from tissue, and their ensuing replacement from the labile N and P pools (recycling; at the timescale of days; Zaehle and Friend, 2010), which allows for seasonal changes in tissue nutrient concentrations; and (ii) the senescence of entire tissues and their conversion to litter, including the resorption of nutrients from foliage (Sect. S3.9). The tissue senescence is calculated given a fixed turnover time for each tissue, with the exception of the leaves, where turnover is determined by the PFT-specific phenological timing (Sect. S3.8).
Stand-level vegetation dynamics are represented through the establishment and mortality of an average representative individual of the entire tree populations, following largely Sitch et al. (2003) and Zaehle and Friend (2010, see Sect. S3.10). Mortality is simulated as density dependent, constraining the number and size of individuals, as well as a dynamic background mortality related to the overall growth efficiency of the plant. (Re-)establishment and recruitment is dependent on meteorological and space constraints, but a new aspect of the re-establishment representation is that the model explicitly takes account of the available seed pool at the forest/grassland floor, which depends on the vegetation's ability to grow and produce fruit.
2.1.2 Soil biogeochemical processes
The turnover and formation of soil organic matter (SOM) follows, with some modifications, the CENTURY approach (Parton et al., 1993, Sect. S4): the turnover of litter and SOM pools are all calculated using first-order kinetics with temperature and moisture dependence. The litter stoichiometry is determined by the stoichiometry of senescent plant tissue and tissue-specific allocation fractions. The stoichiometry of the fast SOM pool adjusts to available inorganic nutrients, whereas the slow SOM pool is assumed to have fixed stoichiometry. As a result, the decomposition of litter may become N and P limited, leading to the accumulation of an organic litter layer and reducing the rate of N and P cycling in the ecosystem.
The soluble inorganic NH4, NO3, and PO4 are assumed to be available for plant uptake and microbial immobilisation, as concluded by White (2006) and many others. Plant uptake and SOM decomposition compete for these nutrients based on their respective demand and uptake capacity, which vary in time and with soil depth. In the aerobic part of the soil, NH4 is oxidised to NO3 through nitrification and in the anaerobic part of the soil NO3 is reduced to N2 through denitrification (Zaehle et al., 2011). Both processes produce NOy and N2O as byproducts (Sect. S4.7). The representation of soil inorganic P dynamics (Sect. S4.8) follows the concept from Yang et al. (2014) and Wang et al. (2010). The available soluble PO4 is exchanged via ad-/desorption with the mineral surface, leached with soil water and replenished by atmospheric deposition, weathering, and biomineralisation of P that is bound in the slow SOM pool. The adsorbed P is further absorbed into the soil matrix and gradually becomes an inactive form of P (occluded P; Walker and Syers, 1976).
Different from the original CENTURY-style models, the vertical soil profile of biogeochemical pools and processes is explicitly represented, with exponentially increasing layer thickness with increasing soil depth. For each of these layers, the model represents different organic pools (metabolic, structural, and woody litter, as well as fast and slow overturning soil organic matter (SOM)), as well as inorganic pools of N and P (soluble inorganic NH4, NO3, as well as NOy, N2O, and N2, soluble inorganic PO4, adsorbed PO4, occluded PO4, and primary PO4). For each soil layer, temperature and moisture are calculated based on soil physical characteristics, and the transport and atmospheric exchange of energy and water (Sect. S6.3). As an example of the benefit of QUINCY's modular approach, Fig. S3 shows that the explicit representation of the vertical soil profile, compared to a zero-dimensional, lumped soil approach, has little effect on the seasonal course of heterotrophic respiration. However, it does affect the simulated nutrient dynamics because of the explicit separation of a nutrient immobilisation in the litter dominated layers from the gross-mineralisation-dominated soil layers with a proportionally higher content of soil organic matter.
2.2 Data for model evaluation
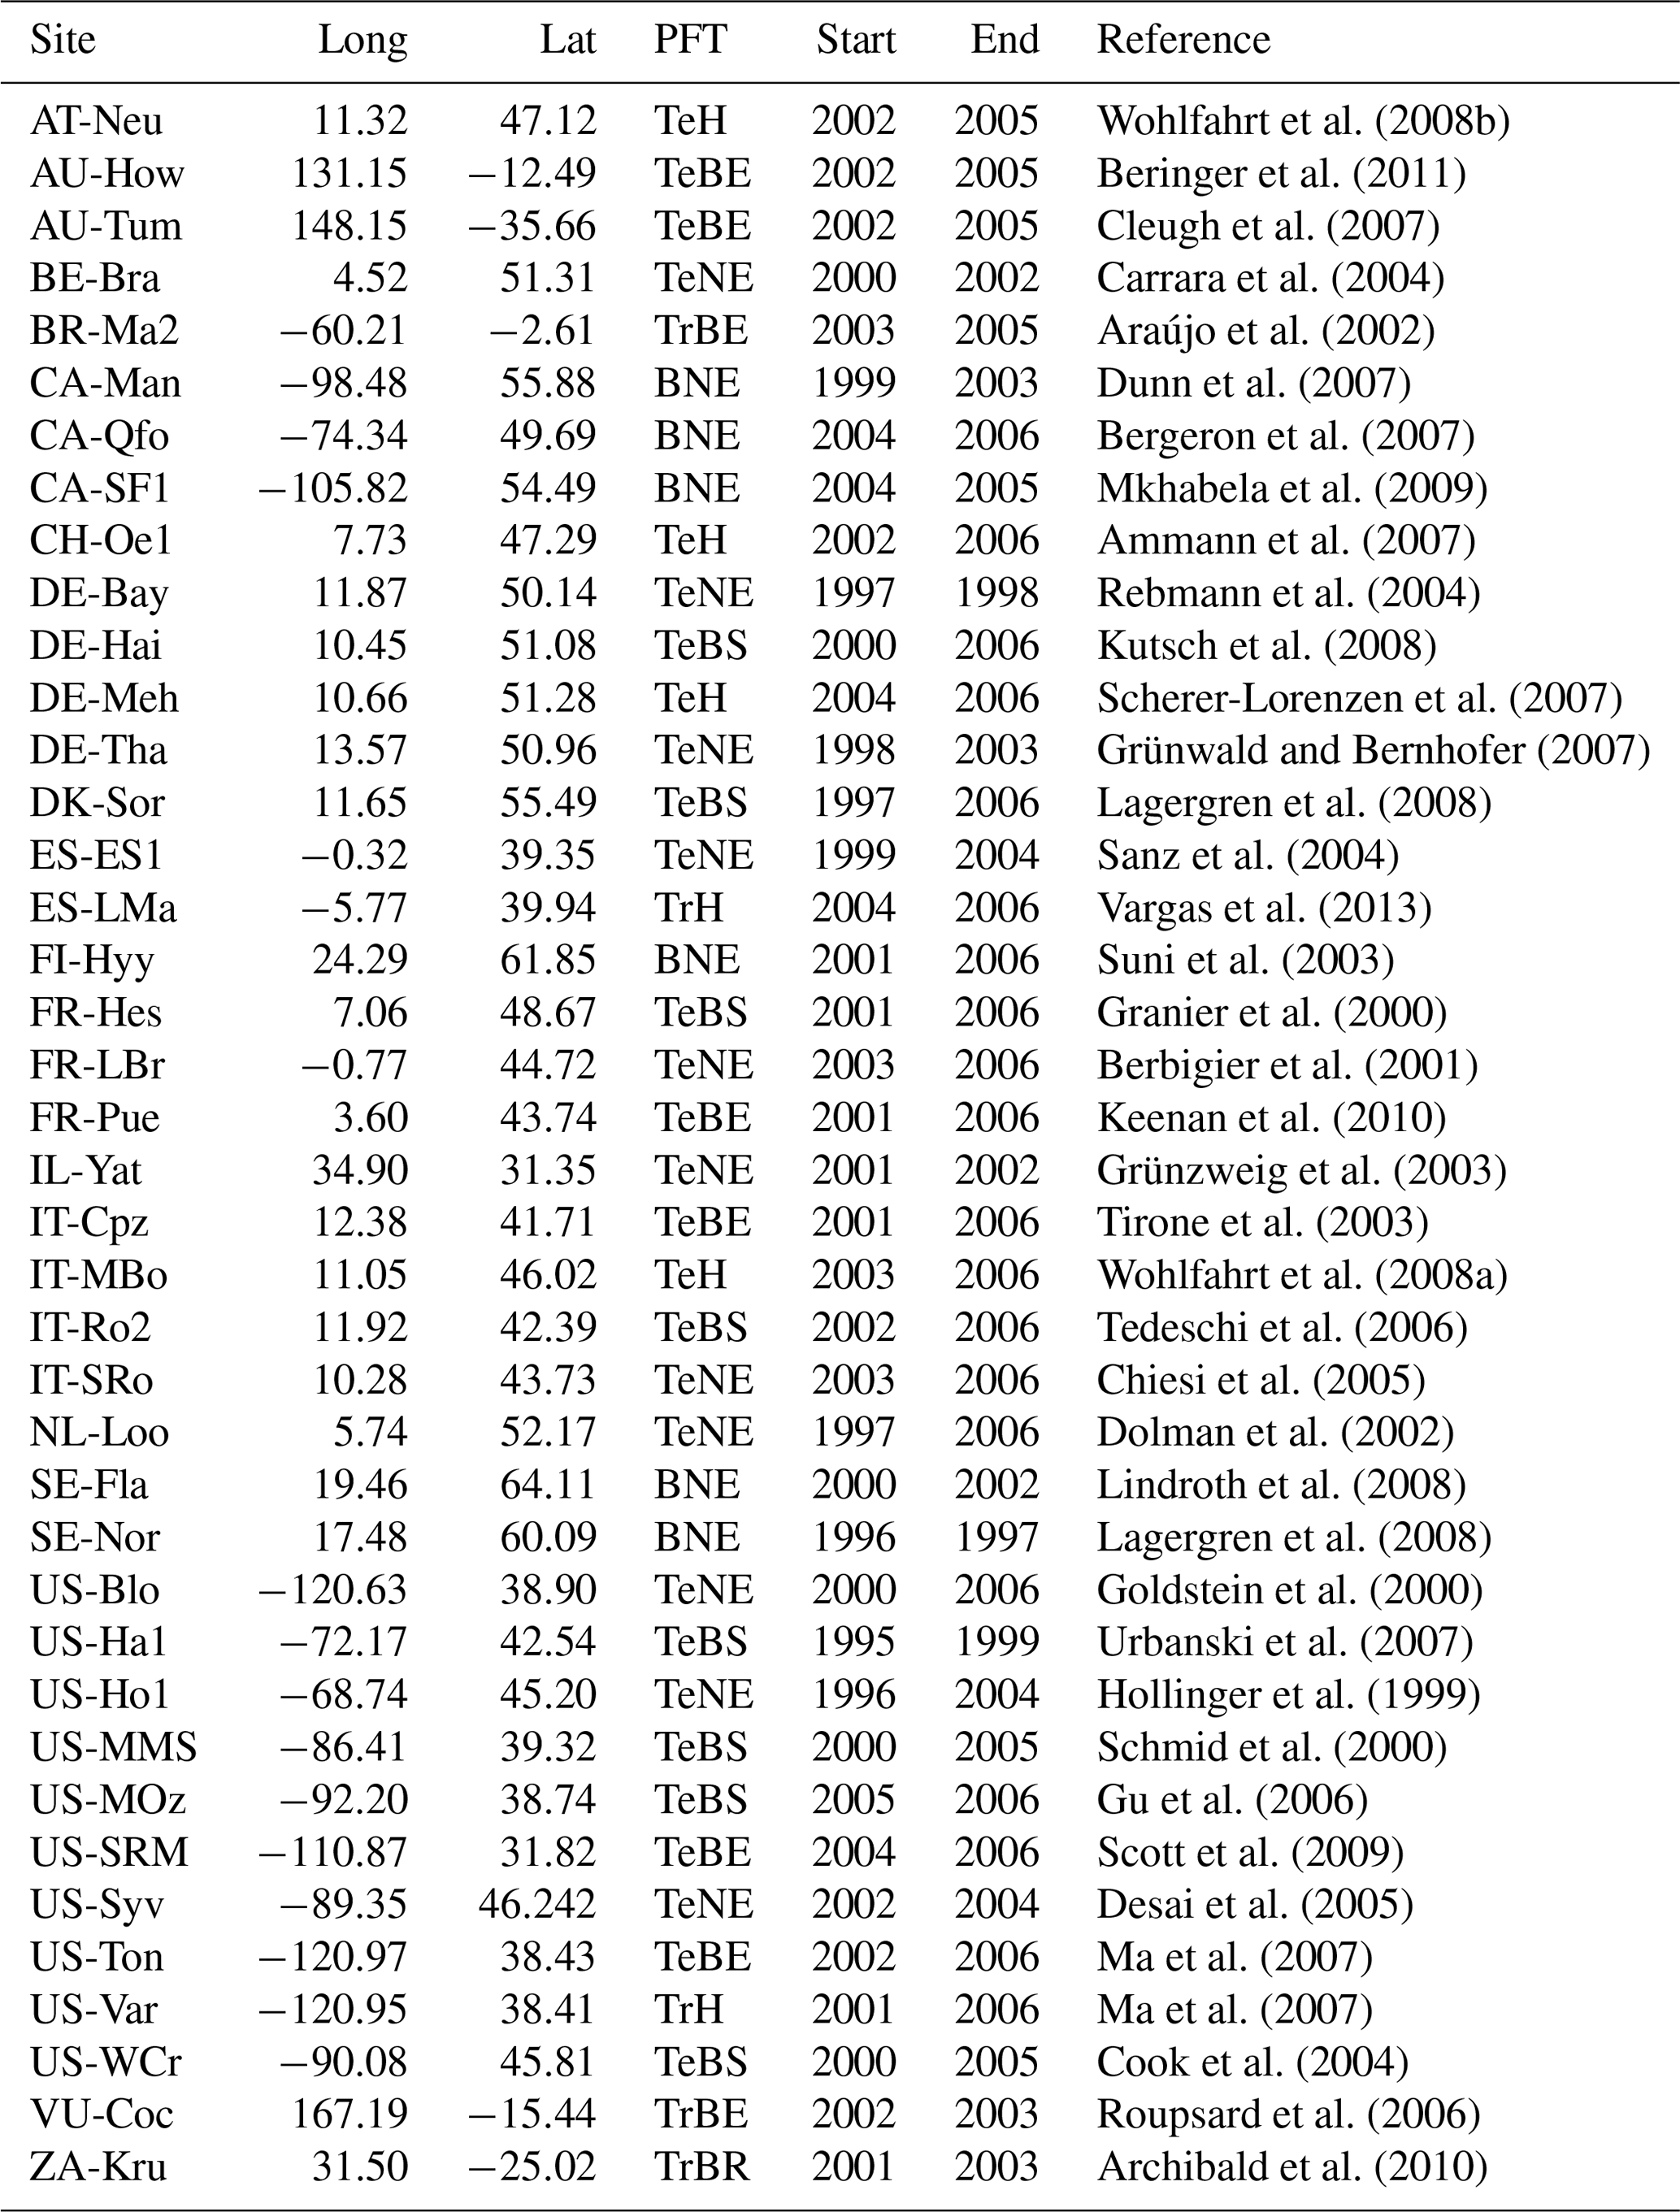
We evaluate simulated diurnal and seasonal patterns of gross primary production and net ecosystem carbon exchange (GPP and NEE, respectively) at a subset of FLUXNET sites (see Table A1) available from the FLUXNET La Thuile synthesis dataset (NOA, 2007). The half-hourly CO2 fluxes have been measured and processed using standard procedures (Papale et al., 2006) as well as gap-filling and partitioning algorithms (Reichstein et al., 2005). We further evaluate the mean annual estimates of gross and net primary production (GPP and NPP, respectively) and their ratio, the carbon-use efficiency (CUE = NPP ∕ GPP) from a global forest database (GFDB; Vicca et al., 2012; Campioli et al., 2015). We further evaluate the simulated growing-season plant water-use efficiency, i.e. the ratio of plant water loss to carbon uptake, by comparing a proxy, foliar isotope discrimination of 13C (Medlyn et al., 2017) against data reported by Cornwell et al. (2018a, b). Figure 2 provides an overview of the sites used for evaluation.
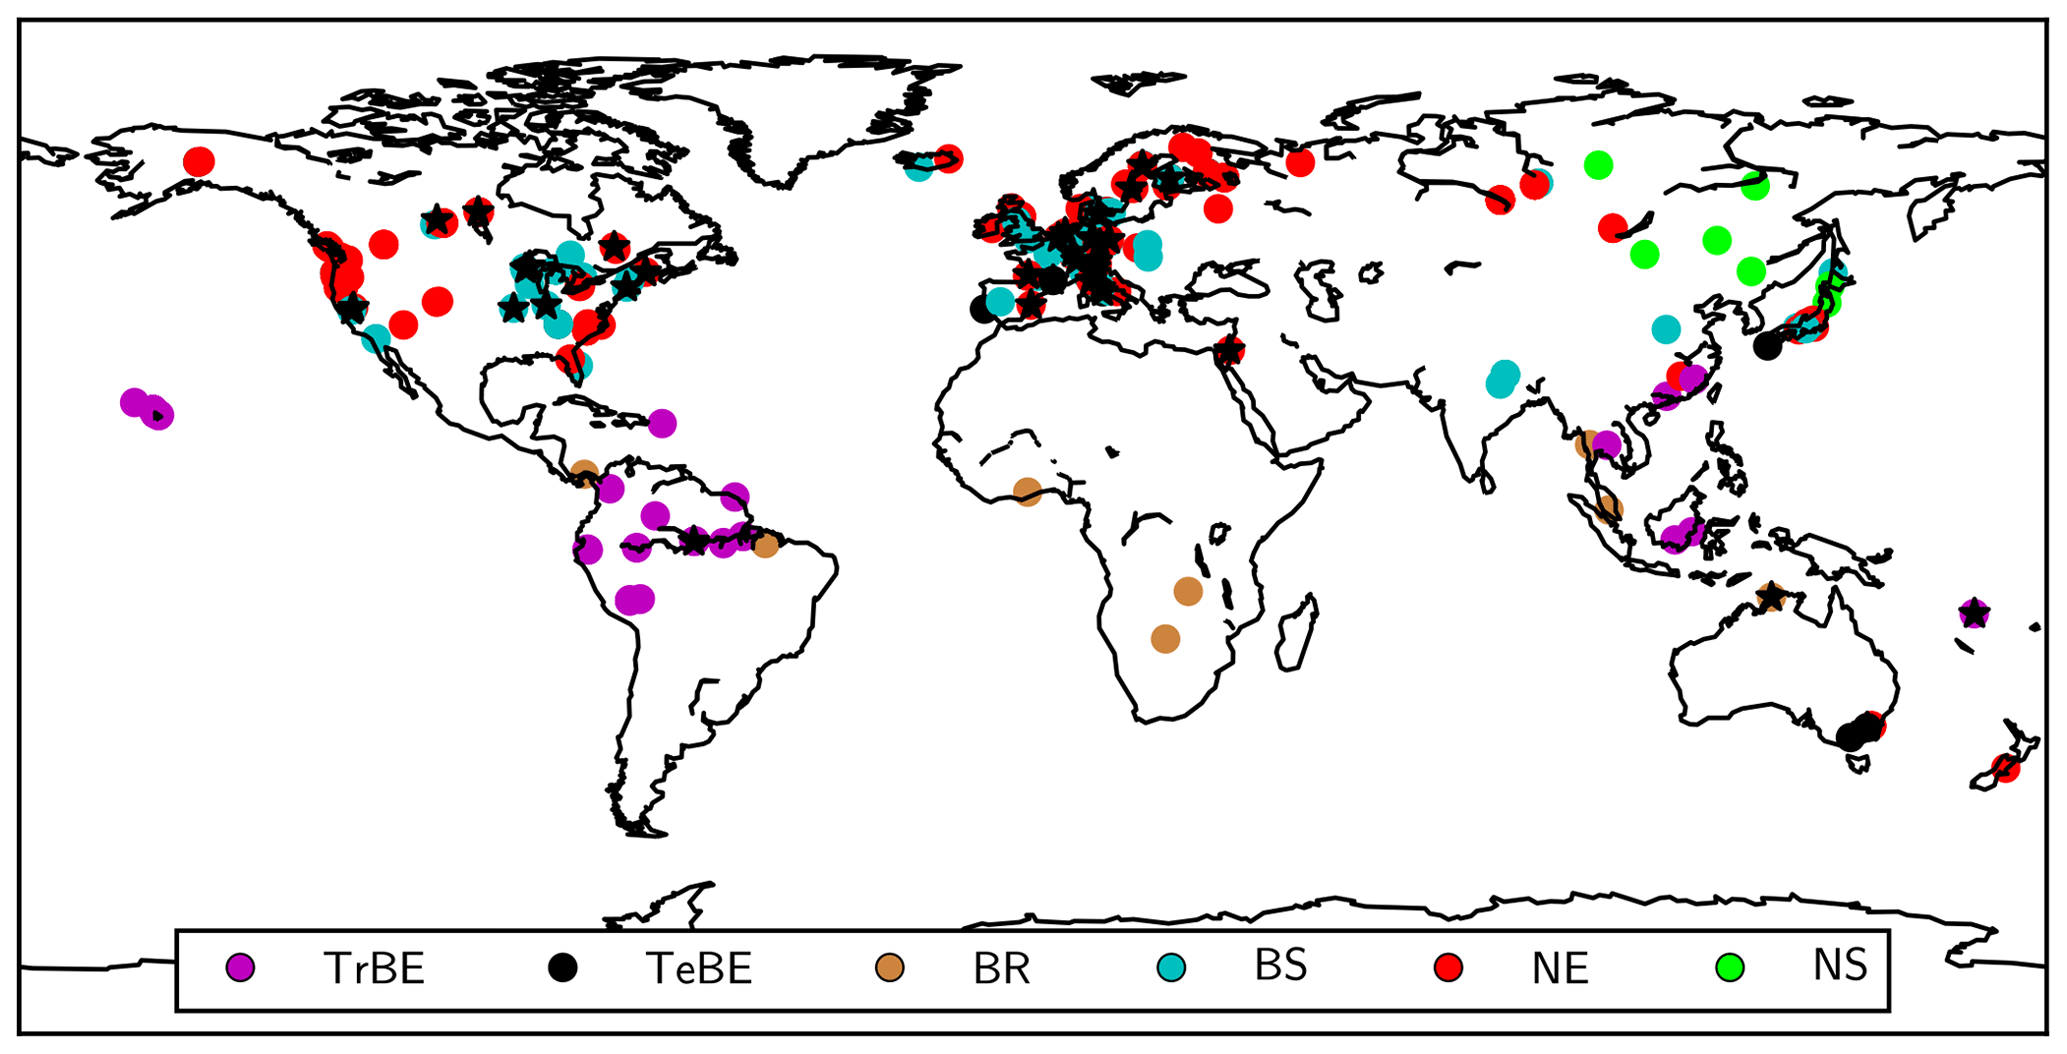
Figure 2Locations of the sites used for model evaluation. Black stars: FLUXNET sites; circles: GFDB sites with circles having colours corresponding to different PFTs (see Table 1).
2.3 Model setup
2.3.1 Boundary conditions and meteorological forcing
The QUINCY model is applied at site scale for the dominant PFT at each site. For the simulations at the FLUXNET sites, the site-specific observed meteorological data were used (NOA, 2007). For the GFDB sites, where site-level meteorology is not readily available, daily meteorological data for 1901 to 2015 were taken from Climate Research Unit – National Centers for Environmental Prediction (CRUNCEP), version 7 (Viovy, 2016) and disaggregated to the model time step using the statistical weather generator as in Zaehle and Friend (2010). The annually changing CO2 mole fraction was obtained from Le Quéré et al. (2018), and the time series of 13C and 14C were obtained from Graven et al. (2017). The time series of N deposition for each site was taken from Lamarque et al. (2010) and Lamarque et al. (2011). For the P deposition model, estimates of nutrient and dust fluxes from Brahney et al. (2015) and Chien et al. (2016) were used.
Soil physical properties (volumetric heat capacity and conductivity, water content at saturation, field capacity, and wilting points, as well as parameters describing the soil water retention curve) are derived from soil texture according to Saxton and Rawls (2006). Where available, texture data are taken from site observations. Alternatively, they are obtained from the nearest grid cell of the SoilGrids dataset (Hengl et al., 2017). The rooting depth has been obtained from Jackson et al. (1996).
The vegetation is initialised as bare ground with a small amount of seed-bed mass to start vegetation growth. The soil organic matter profile is initialised with a default SOM content for each pool, 60 % of which is allocated to the uppermost layer, and the remaining 40 % is allocated to other soil layers in proportion to the assumed rooting profile. Previous tests have shown that the model is not very sensitive to the choice of the SOM initial conditions. The soil inorganic P pools of the first 50 cm are initialised using the soil P dataset by Yang et al. (2013), extrapolated to the whole soil profile assuming (i) a constant total soil inorganic P density (mol P kg−1 soil) and (ii) an increasing fraction of primary P and decreasing fraction of labile P with increasing soil depth.
2.3.2 Spinup and model protocol
The QUINCY model is spun up with repeated meteorological forcing for each site to obtain an near-equilibrium soil and vegetation state. For the GFDB sites, meteorology and other atmospheric forcing (atmospheric CO2, its isotopes, as well as N and P deposition) are taken by randomly drawing years from the period of 1901 to 1930. The same procedure is applied for FLUXNET sites, with the exception that meteorological forcing is only available for more recent years, and data from those years are used in random sequence. The P cycle is activated during the model spinup, but the more stable soil inorganic P pools, i.e. the primary, sorbed, occluded pools, are kept constant to ensure that the simulation initialises at the P status of Yang et al. (2013)'s dataset.
After spinup, the model is run for the period of 1901–2015 using the annual values for atmospheric CO2, 13CO2, and 14CO2, as well as N and P deposition, and the meteorology of the respective year. For the comparison to GFDB data, forest stands are clear cut in the year provided by the database. Upon harvest, vegetation biomass is transferred to the litter pools, with the exception of the wood pool, of which a given fraction, , is removed from the site. In the case of FLUXNET sites, we retain the model output for the years covered by the available data at each individual site (Table A1). For the GFDB sites, we average over the period of 1995–2004 to remove the effects of interannual climate variability and to have modelled forest age close to the actual forest age of each site, as the precise year of measurement is not recorded in the database for all sites.
To test the effect of the simulated N and P availability, we applied the model for the FLUXNET sites with three different setups. Next to the full CNP version of the model described above (referred to hereafter as “CNP”), we performed a simulation (“CN”) in which the P concentration of the soil was kept at concentrations not limiting plant uptake or SOM decomposition, effectively removing the impact of the inorganic P sorption and weathering dynamics, and maintaining N:P stoichiometry at default values. We also added a version (“C”), in which, in addition, biological N fixation in soil (asymbiotic fixation) and in vegetation (symbiotic fixation) was calculated so as to avoid any N limitation of soil turnover and vegetation growth while keeping the C:N stoichiometry at default values.
2.4 Model sensitivity to its parameterisation
We further test the sensitivity of the model to its parameterisation using a hierarchical Latin hypercube sampling design (LHS; Saltelli et al., 2000; Zaehle et al., 2005) to assess the stability of the model with respect to changing parameter values. As many parameters have unknown value ranges and distributions, we simply vary each parameter between 90 % and 110 % of its default value given in the Supplement (Tables S1–S9), drawn with LHS from a uniform distribution. We first generate LHS samples for each module (corresponding to a section in the Supplement; results not shown) and evaluate the model output from these simulations in terms of long-term mean modelled GPP, leaf , net N and P mineralisation, as well as total vegetation and ecosystem carbon storage. Based on these simulations we select parameters (n=45), which have a strong effect on the model outcome to form a new set of 1000 LHS samples, which are used for the model sensitivity analysis presented in this paper. We measure parameter importance as the rank-transformed partial correlation coefficient (RPCC) to take account of potential non-linearities in the relationship between parameters and model output (Saltelli et al., 2000; Zaehle et al., 2005).
3.1 Simulated diurnal to seasonal timescale carbon dioxide fluxes at selected FLUXNET sites
We first compare the simulated mean monthly diurnal as well as the mean seasonal cycle of GPP at four forest sites, representing the major tree plant functional types, with in situ observations (Fig. 3; see Fig. S4 for a comparable evaluation of the latent heat flux). The model simulations agree reasonably well with the observations in that diurnal and seasonal timing and overall magnitude of fluxes are generally consistent. Importantly, while the N and P cycles dampen the overall magnitude of the fluxes at the beech forest site (temperate broad-leaved deciduous; FR-Hes) and the eucalyptus forest site (temperate broad-leaved evergreen; AU-Tum), they do not affect the shape of either the diurnal or seasonal cycles. In other words, the effect of diurnal and seasonal variability in soil nutrient availability is buffered through the labile and reserve storage pools in the vegetation, such that it affects vegetation gross carbon uptake only via slow processes such as foliar nutrient and allocation changes but has no effect on variability at the daily to weekly timescale. This is also demonstrated in the LAI values that are influenced by the long-term dynamics. For instance, at FR-Hes and AU-Tum the LAI is lower at the nitrogen- and phosphorus-dynamics-enabled version than with the C-only version (6.0 compared to 6.2 m2 m−2 at FR-Hes, 3.7 compared to 5.9 m2 m−2 at AU-Tum), whereas it does not have a notable effect for the needle-leaved evergreen site of FI-Hyy.

Figure 3Simulated and observed mean monthly diurnal (a, b, c, d) and seasonal (e, f, g, h) cycles of GPP at four FLUXNET sites (FI-Hyy, FR-Hes, AU-Tum, and BR-Ma2; see Table A1) representing the major QUINCY PFTs (NE, BS, TeBE, and TrBE, respectively; see Table 1). “Obs” corresponds to micrometeorological observations. “C”, “CN”, and “CNP” refer to the model simulations with C, C&N, and C&N&P options enabled. Seasonal cycles have been smoothed by a 16 d running mean.
There is little overall effect of the nutrient cycles on the correlation between half-hourly simulated and observed GPP at FI-Hyy (all versions: r2=0.76), FR-Hes (all versions: r2=0.63), and BR-Ma2 (all versions: r2=0.67), and only a minor reduction for AU-Tum (r2 0.70 versus 0.65 for C and CN(P), respectively). The largest decrease of the model's root mean square error (RMSE) took place at FR-Hes, where introducing N and P cycling reduced the RMSE by nearly 20 % to 5.17 . For FI-Hyy, the RMSE and the improvement were 2.42 and 0.11 . For AU-Tum, the RMSE and worsening of RMSE were 5.44 and 0.36 . At BR-Ma2, the RMSE and the improvement were 7.78 and 0.09 . At the tropical evergreen forest site BR-Ma2 (Fig. 3d, h), the different versions performed similarly. The lower GPP in the daily observation-based estimate between days of year 150 and 200, which are not replicated by the model, is largely caused by lower observation-based GPP at the start of the time series during this time of year in 2003. There was no obvious cause for this behaviour visible in the meteorological drivers. The latent heat fluxes were generally well simulated at these four sites, with the exception of large summertime overestimation (73 %) at FR-Hes (Fig. S4).
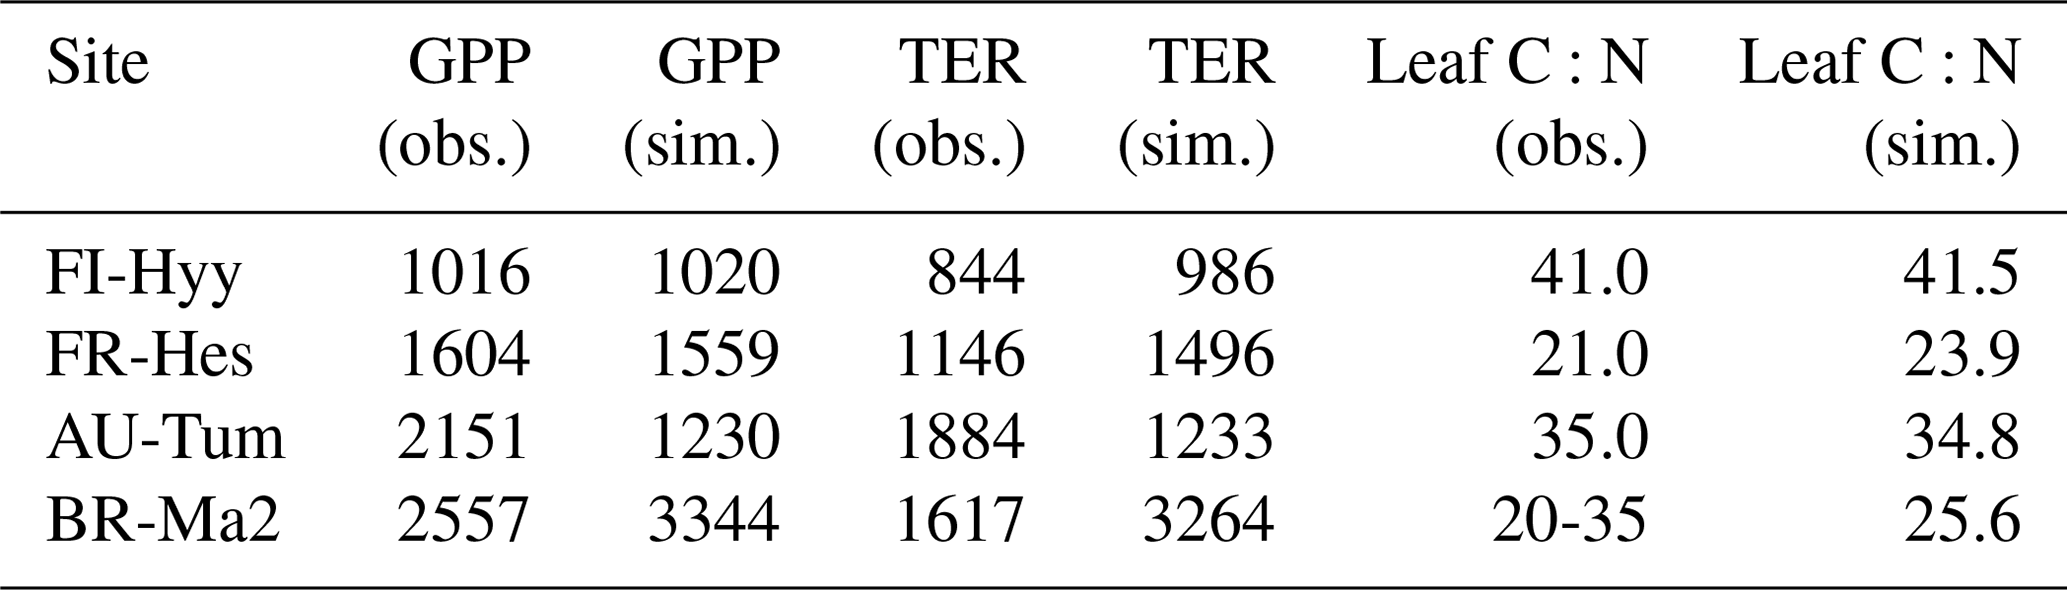
Table 2 summarises the observed and simulated GPP, total ecosystem respiration (TER), and foliar C:N with the CNP version of the model for these four FLUXNET sites, calculated for the time period of the flux observations (Table A1). The annual GPP from the CO2 flux observations is in line with the modelled values for FI-Hyy and FR-Hes, while productivity at BR-Ma2 is somewhat overestimated and strongly underestimated at AU-Tum. The TER is somewhat overestimated for FI-Hyy and FR-Hes, and strong overestimation occurs at BR-Ma2. However, the unusually large discrepancy between observed GPP and TER fluxes at BR-Ma2 suggests that these estimates should be considered with caution. At AU-Tum, the TER is underestimated. Simulated foliar C:N was within the observational range reported in the La Thuile database (NOA, 2007) for all four sites. Observations for nutrient availability and fluxes are not consistently available across these sites.
Table 2Simulated and observed GPP (in ), total ecosystem respiration (TER in ), and leaf C:N (gC gN−1) at four FLUXNET sites, as in Fig. 3. Values are averaged over the years where CO2 flux observations are available.
The Taylor plots of the half-hourly simulated and observation-based time series of GPP and NEE (Fig. 4) demonstrate that the overall model performance noted in Fig. 3 holds across a wider set of sites, spanning a larger climatic gradient and also including grassland sites. The Taylor plot reports results obtained with the CNP version of the model; the plots for the C and CN version were very similar in terms of their correlation and moderately different in terms of the ratio of standard deviations. The simulated GPP shows slightly better performance over the different sites than NEE. Considering that (i) the model has not been parameterised specifically for each site and (ii) eddy-covariance observations at this timescale are subject to considerable fluctuations, the model performance is acceptable in terms of the correlation. While there is a wide spread in the ratio of the simulated to observation-based standard deviation, mostly associated with site-based differences in the seasonal maximum of the flux, there is no systematic model bias for any PFT.
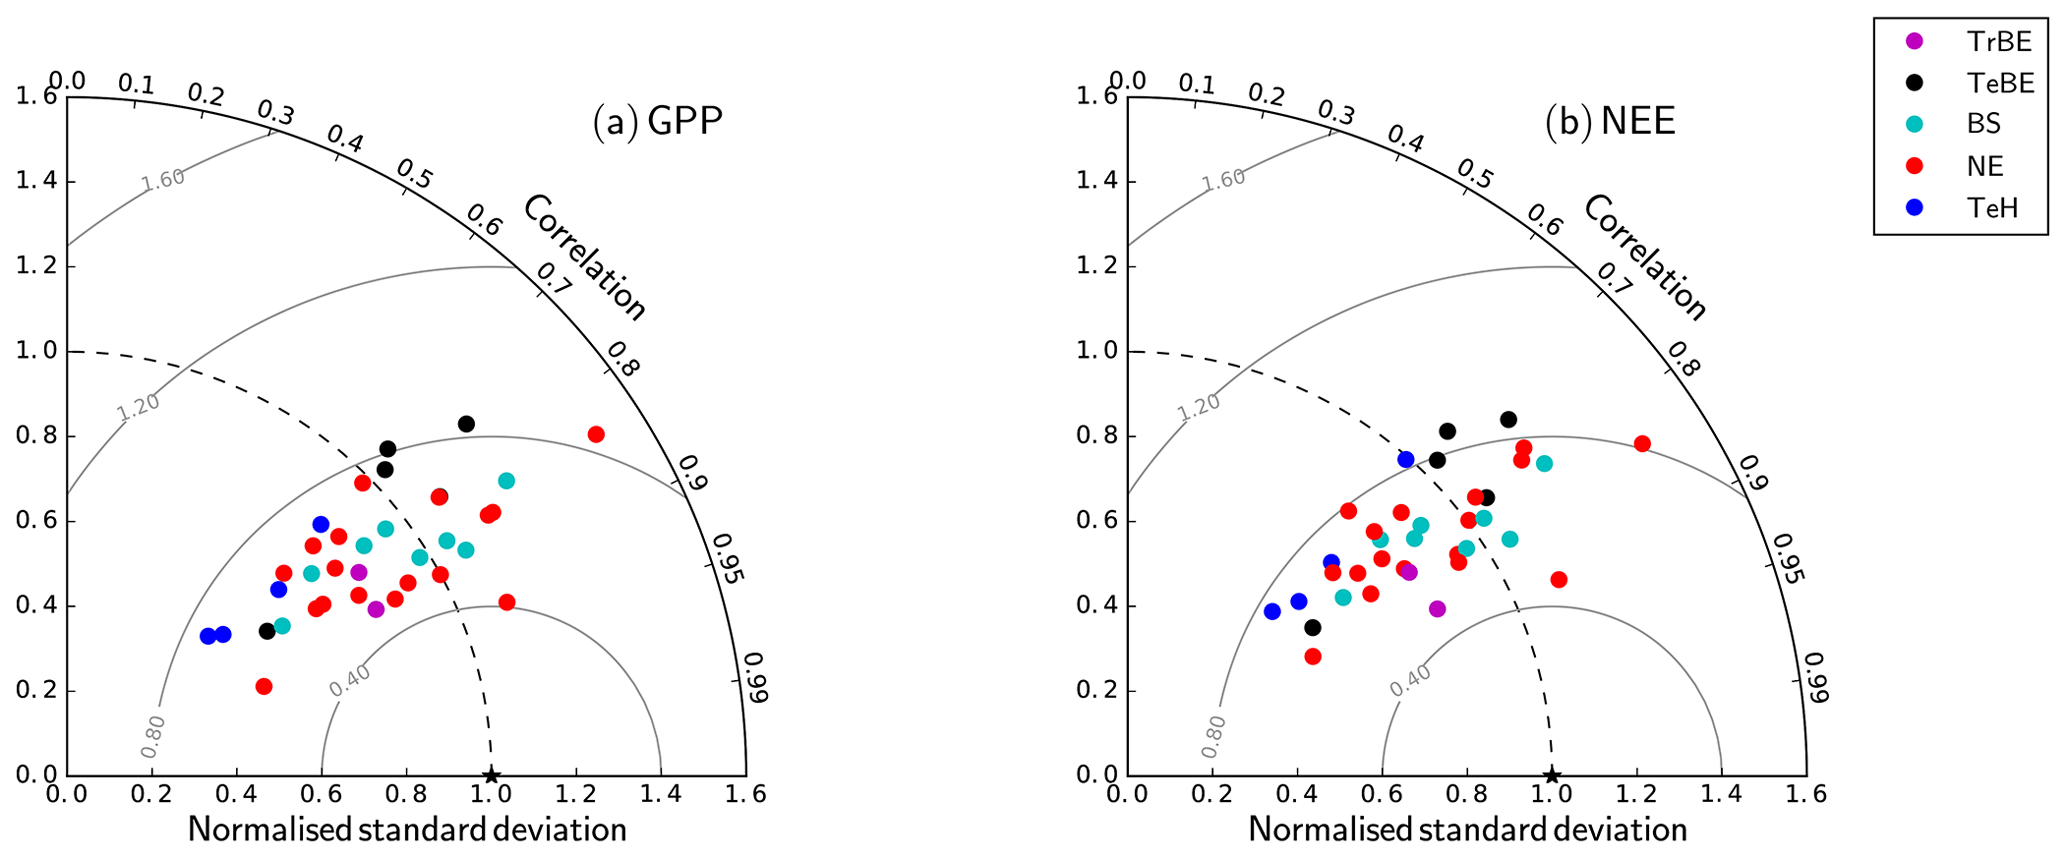
Figure 4Taylor plots for GPP and net ecosystem exchange (NEE) showing the model–data agreement for the FLUXNET sites used in this study (Table A1), separated according to the dominant plant functional type (Table 1). The standard deviation was normalised against the standard deviation of the observations for the corresponding variable. The grey lines correspond to the Euclidean distance from the point of perfect model–data agreement, where both the normalised standard deviation and the correlation coefficient are 1.0, shown as a black star in the figure.
The inclusion of the N cycle (difference between C and CN model versions) reduces the RMSE between simulated and observation-based estimates of GPP for all PFTs apart from the tropical broad-leaved evergreen PFT (Fig. 5). The largest reductions of the RMSE between the different versions occur for TeBE (34.0 %) and TeH (41.6 %). There is no strong effect of including the P cycle on simulated GPP, and in consequence there is no difference in the RMSE values of the CN and CNP versions, even for the tropical broad-leaved evergreen forest sites, which are in regions typically associated with P limitation of biomass production.
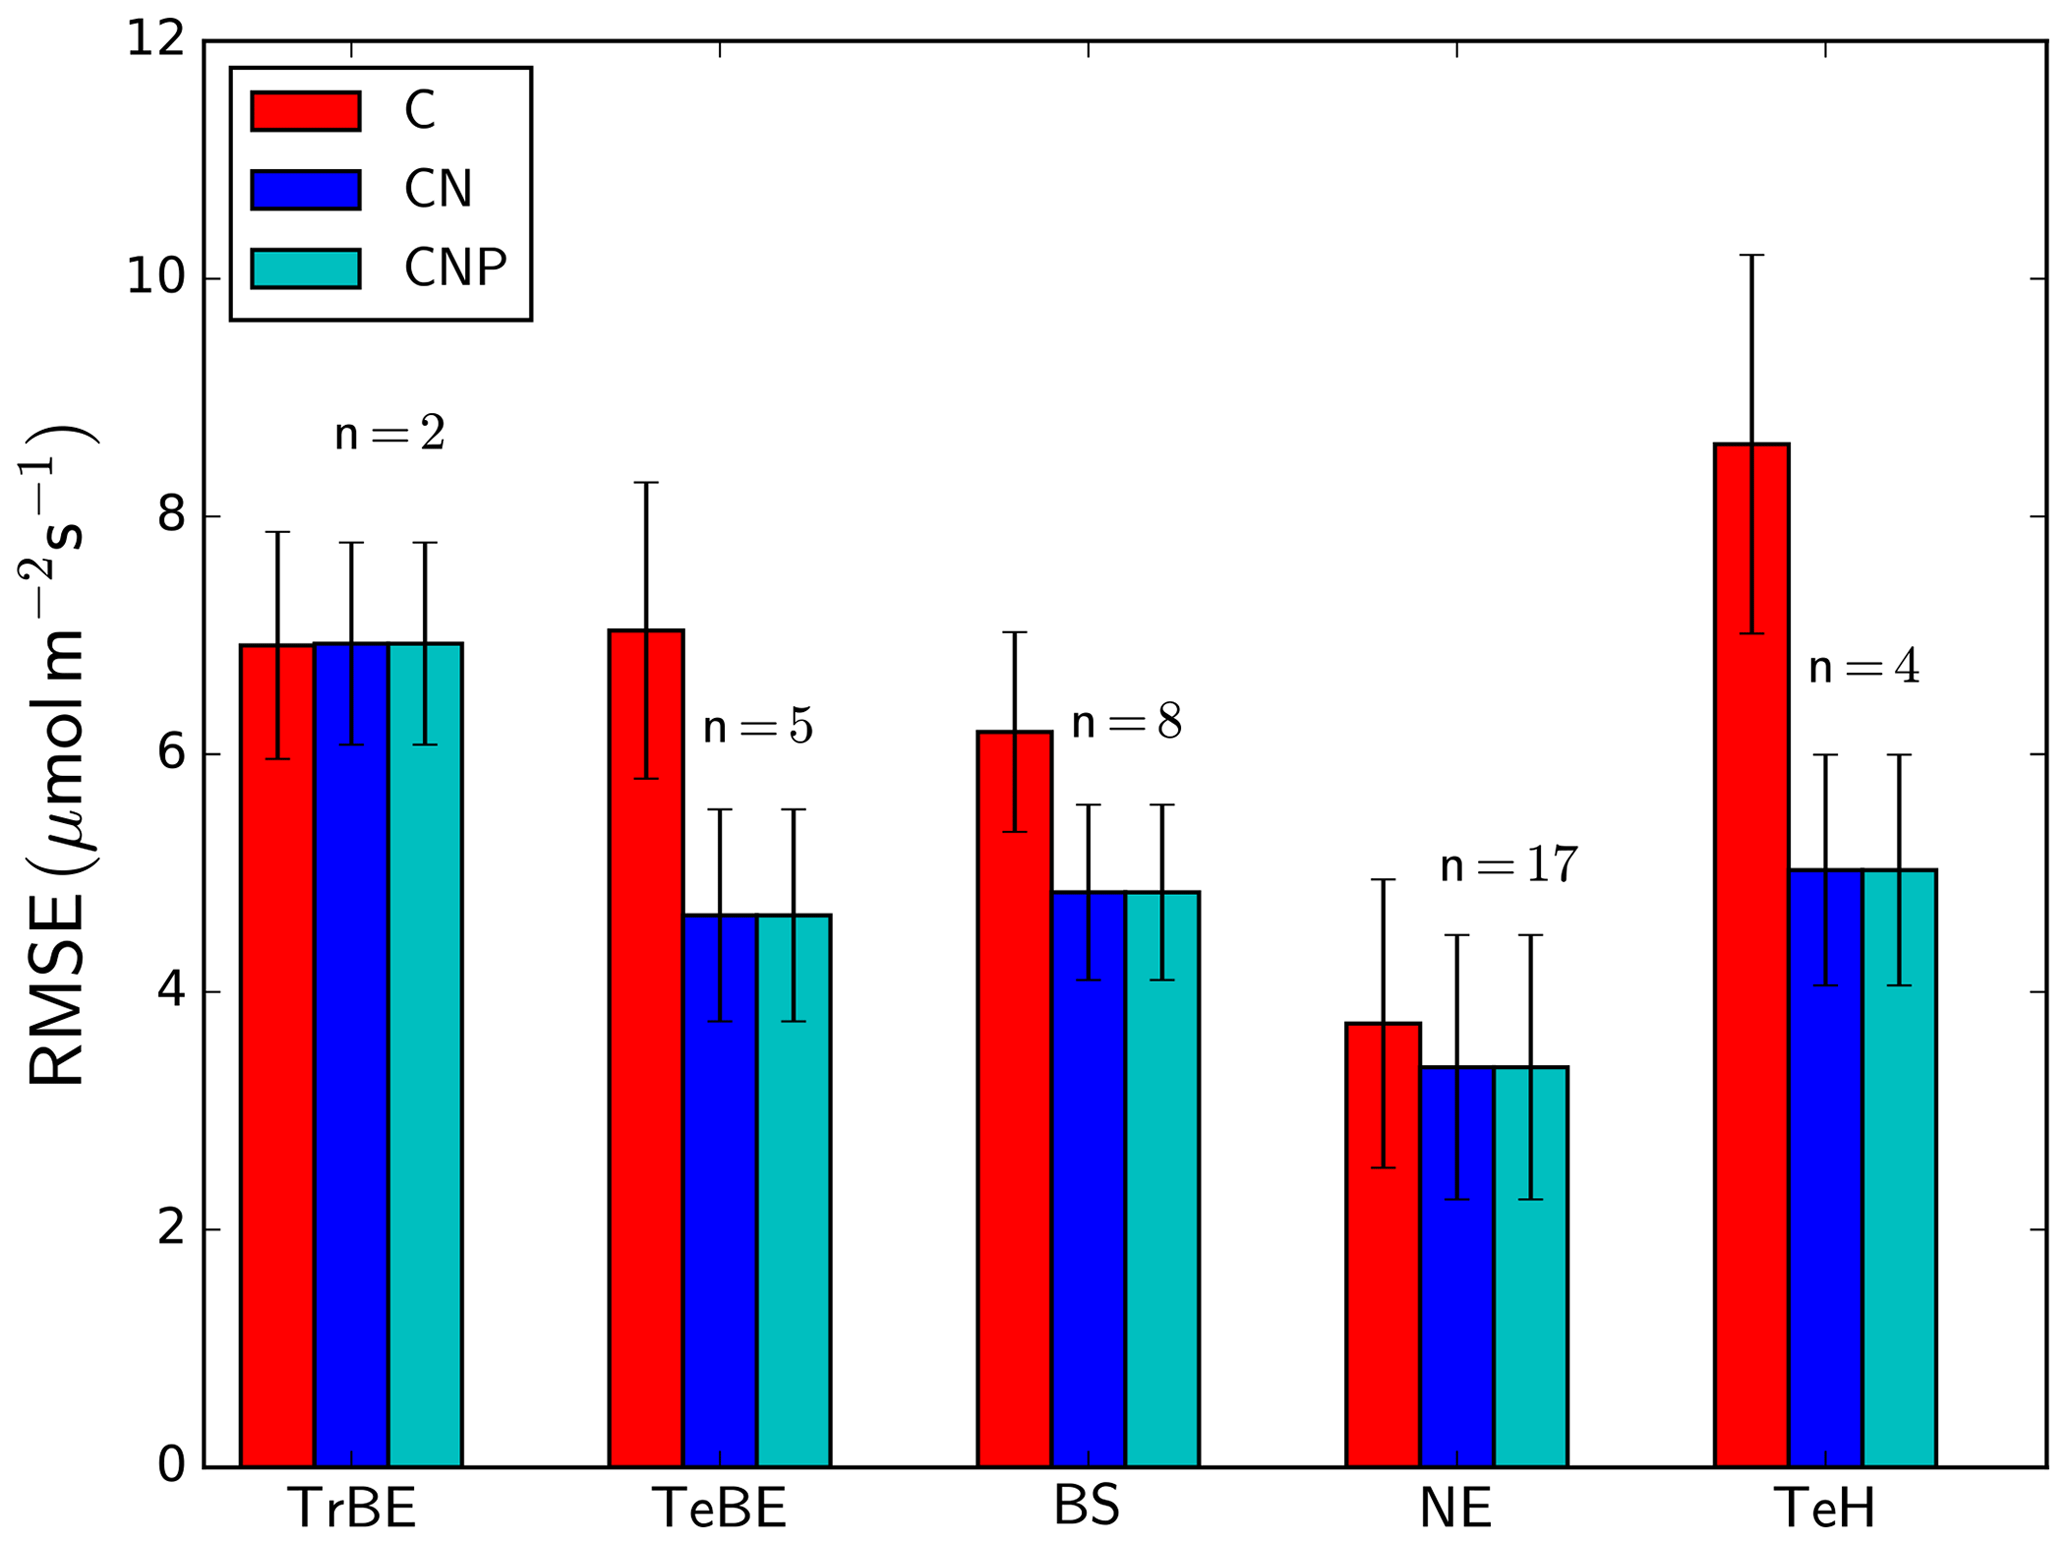
Figure 5Root mean square error (RMSE) for simulated GPP by dominant plant functional type (see Table 1). The number of sites used in the calculation of the PFT-specific RMSE value (n) is shown above the bars for each PFT. The error bars denote the standard deviation of the RMSE values of the different sites within each PFT. “C”, “CN”, and “CNP” refer to the model simulations with C, C&N, and C&N&P options enabled.
3.2 Cross-site analysis of long-term mean GPP and NPP
Simulated GPP across all the GFDB sites (n=434), covering a range of tree PFTs, agrees reasonably well with data (r2=0.55, RMSE =560 ) (Fig. 6a), despite an underestimation of GPP for some sites, both in tropical forest ecosystems and needle-leaved evergreen forests. The data shown are restricted to forests older than 20 years to avoid ambiguities in the model–data comparison as the exact method of forest regeneration after disturbance is not known and the model does not describe stand-level dynamics of very early succession forests that often have very high observed productivity. The model is also able to replicate the observations from low to modest NPP values albeit with a higher relative RMSE (Fig. 6b) (r2=0.35, RMSE =305 ). While there is no systematic over- or underestimation of NPP with PFT or magnitude of NPP, it is noteworthy that the highest NPP value simulated for this dataset was only 1441 , whereas for a few sites, observation-based estimates reached nearly 2000 . The model correctly predicts the range of CUE, i.e. the ratio of net to gross primary production, where the observed CUE values ranged between 0.21 and 0.76 g g−1, while the simulated values were between 0.19 and 0.61 g g−1. The model also predicts correctly a lower CUE in tropical compared to temperate/boreal ecosystems. However, the model is not able to explain the within-PFT variability of the observed CUE values in the dataset (Fig. 6c).
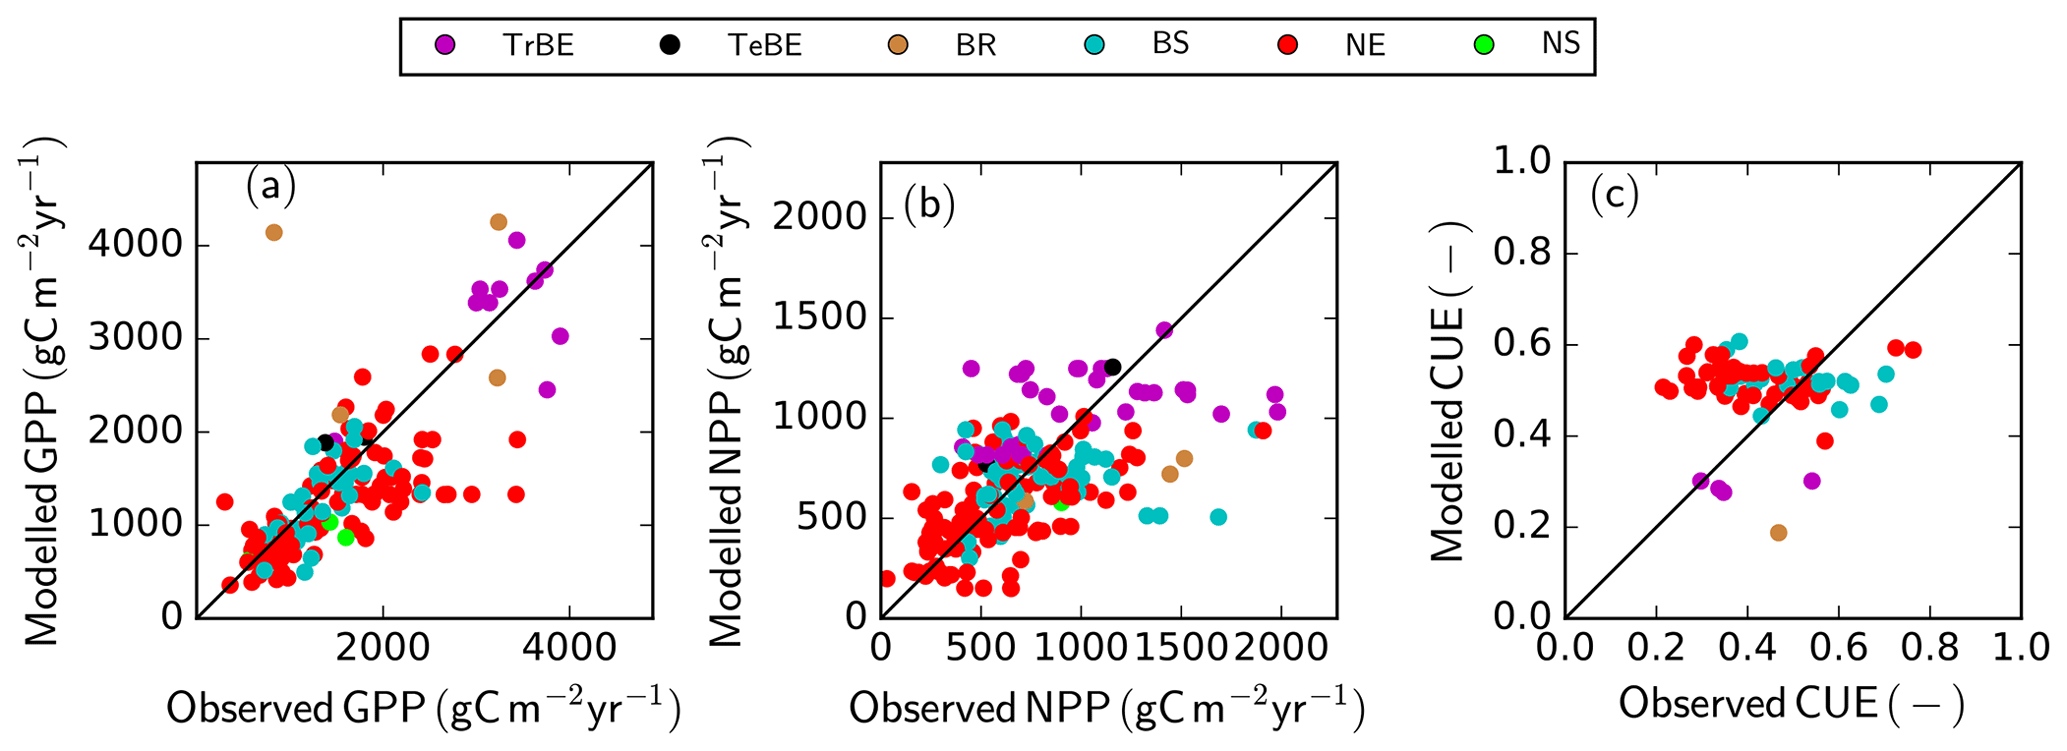
Figure 6Simulated versus observed GPP (a), NPP (b), and carbon use efficiency (CUE = NPP ∕ GPP) (c) at GFDB sites against observations. For PFT abbreviations, see Table 1. Note that observations of GPP and NPP are not consistently available for all sites.
Underlying these results are the emergent sensitivities of ecosystem processes to the model drivers. Figures S5 and S6 show that the large-scale gradients of simulated GPP and NPP are largely controlled by mean annual temperature (MAT), with an additional clear effect of mean annual precipitation. For temperate and boreal forests, also N deposition is positively related to GPP and NPP. While the acclimation of photosynthesis to growth temperature does matter at the diurnal timescale particularly on cloudy days (Fig. S7), the positive and negative effects cancel each other out at the long-term annual mean and therefore play no role in the simulated GPP–MAT relationship. Despite a notable decline of maintenance respiration in higher temperatures due to the acclimation of respiration to growth temperature (see Fig. S8), the spatial trend in simulated CUE is predominantly driven by MAT (Fig. S9). Trends apparent in the CUE response to MAP and N deposition are small and likely confounded by the MAT response. However, the general tendency of PFT-specific foliar C:N to decline with increasing N deposition (Fig. S10), something that is expected to happen based on observational evidence (Hyvönen et al., 2007; Meyerholt and Zaehle, 2015), suggests that the linearly increasing maintenance respiration rates per unit tissue drives whole-plant maintenance respiration up stronger than the saturating effect of increased leaf N on GPP, therefore reducing CUE with increasing N availability, contrary to expectations (Vicca et al., 2012). The root-to-shoot ratio did not show strong dependency to any of these environmental variables (data not shown), probably contributing to the lack of a decline in CUE with declining N availability. Generally, PFT-wise foliar stoichiometry appears to be more strongly influenced by N deposition than MAT or MAP. This result occurs despite a clear dependency of the simulated biological N fixation on temperature and precipitation (Fig. S11), where the simulated range and response to climate drivers are consistent with the available evidence suggesting the highest N fixation in hot and moist environments (Cleveland et al., 1999, 2013). In addition, in agreement with recent evidence, enhanced atmospheric N input suppresses simulated N fixation (Zheng et al., 2019).
The comparison of leaf Δ13C based on observations (Cornwell et al., 2018b) and the GFDB simulations (Fig. 7) provides another look into the underlying processes of GPP evaluation, as they are documenting the simulated and observed trends in water-use efficiency with water availability. Both observations and model showed lower Δ13C in drier conditions, indicating an effect of seasonal water availability in overall drought stress on photosynthesis. Comparing PFT-wise mean values, constrained to estimates of ET∕PET >0.25 to remove the effect of modelled outliers under high water limitation, the average for broad-leaved deciduous forest (BS) was 20.88 ‰ for the observations and 20.67 ‰ for the modelled values. For the needle-leaved deciduous (NS) PFT, the average values were very similar (observations 20.29 ‰ and simulations 20.12 ‰). Somewhat larger discrepancies occurred for the needle-leaved evergreen PFT, where the average of the observations was 20.00 ‰ and the average of the simulation results was 19.59 ‰. For the broad-leaved evergreen forests, there was a large deviation between the observed (22.68 ‰) and modelled values (20.55 ‰), but also the sample sizes were very different (n=1617 for observations and n=54 for simulations). For the modelled values, the difference between needle-leaved deciduous and evergreen forests was more pronounced than in the observations, but the sample size of modelled NS sites was very small (n=6).
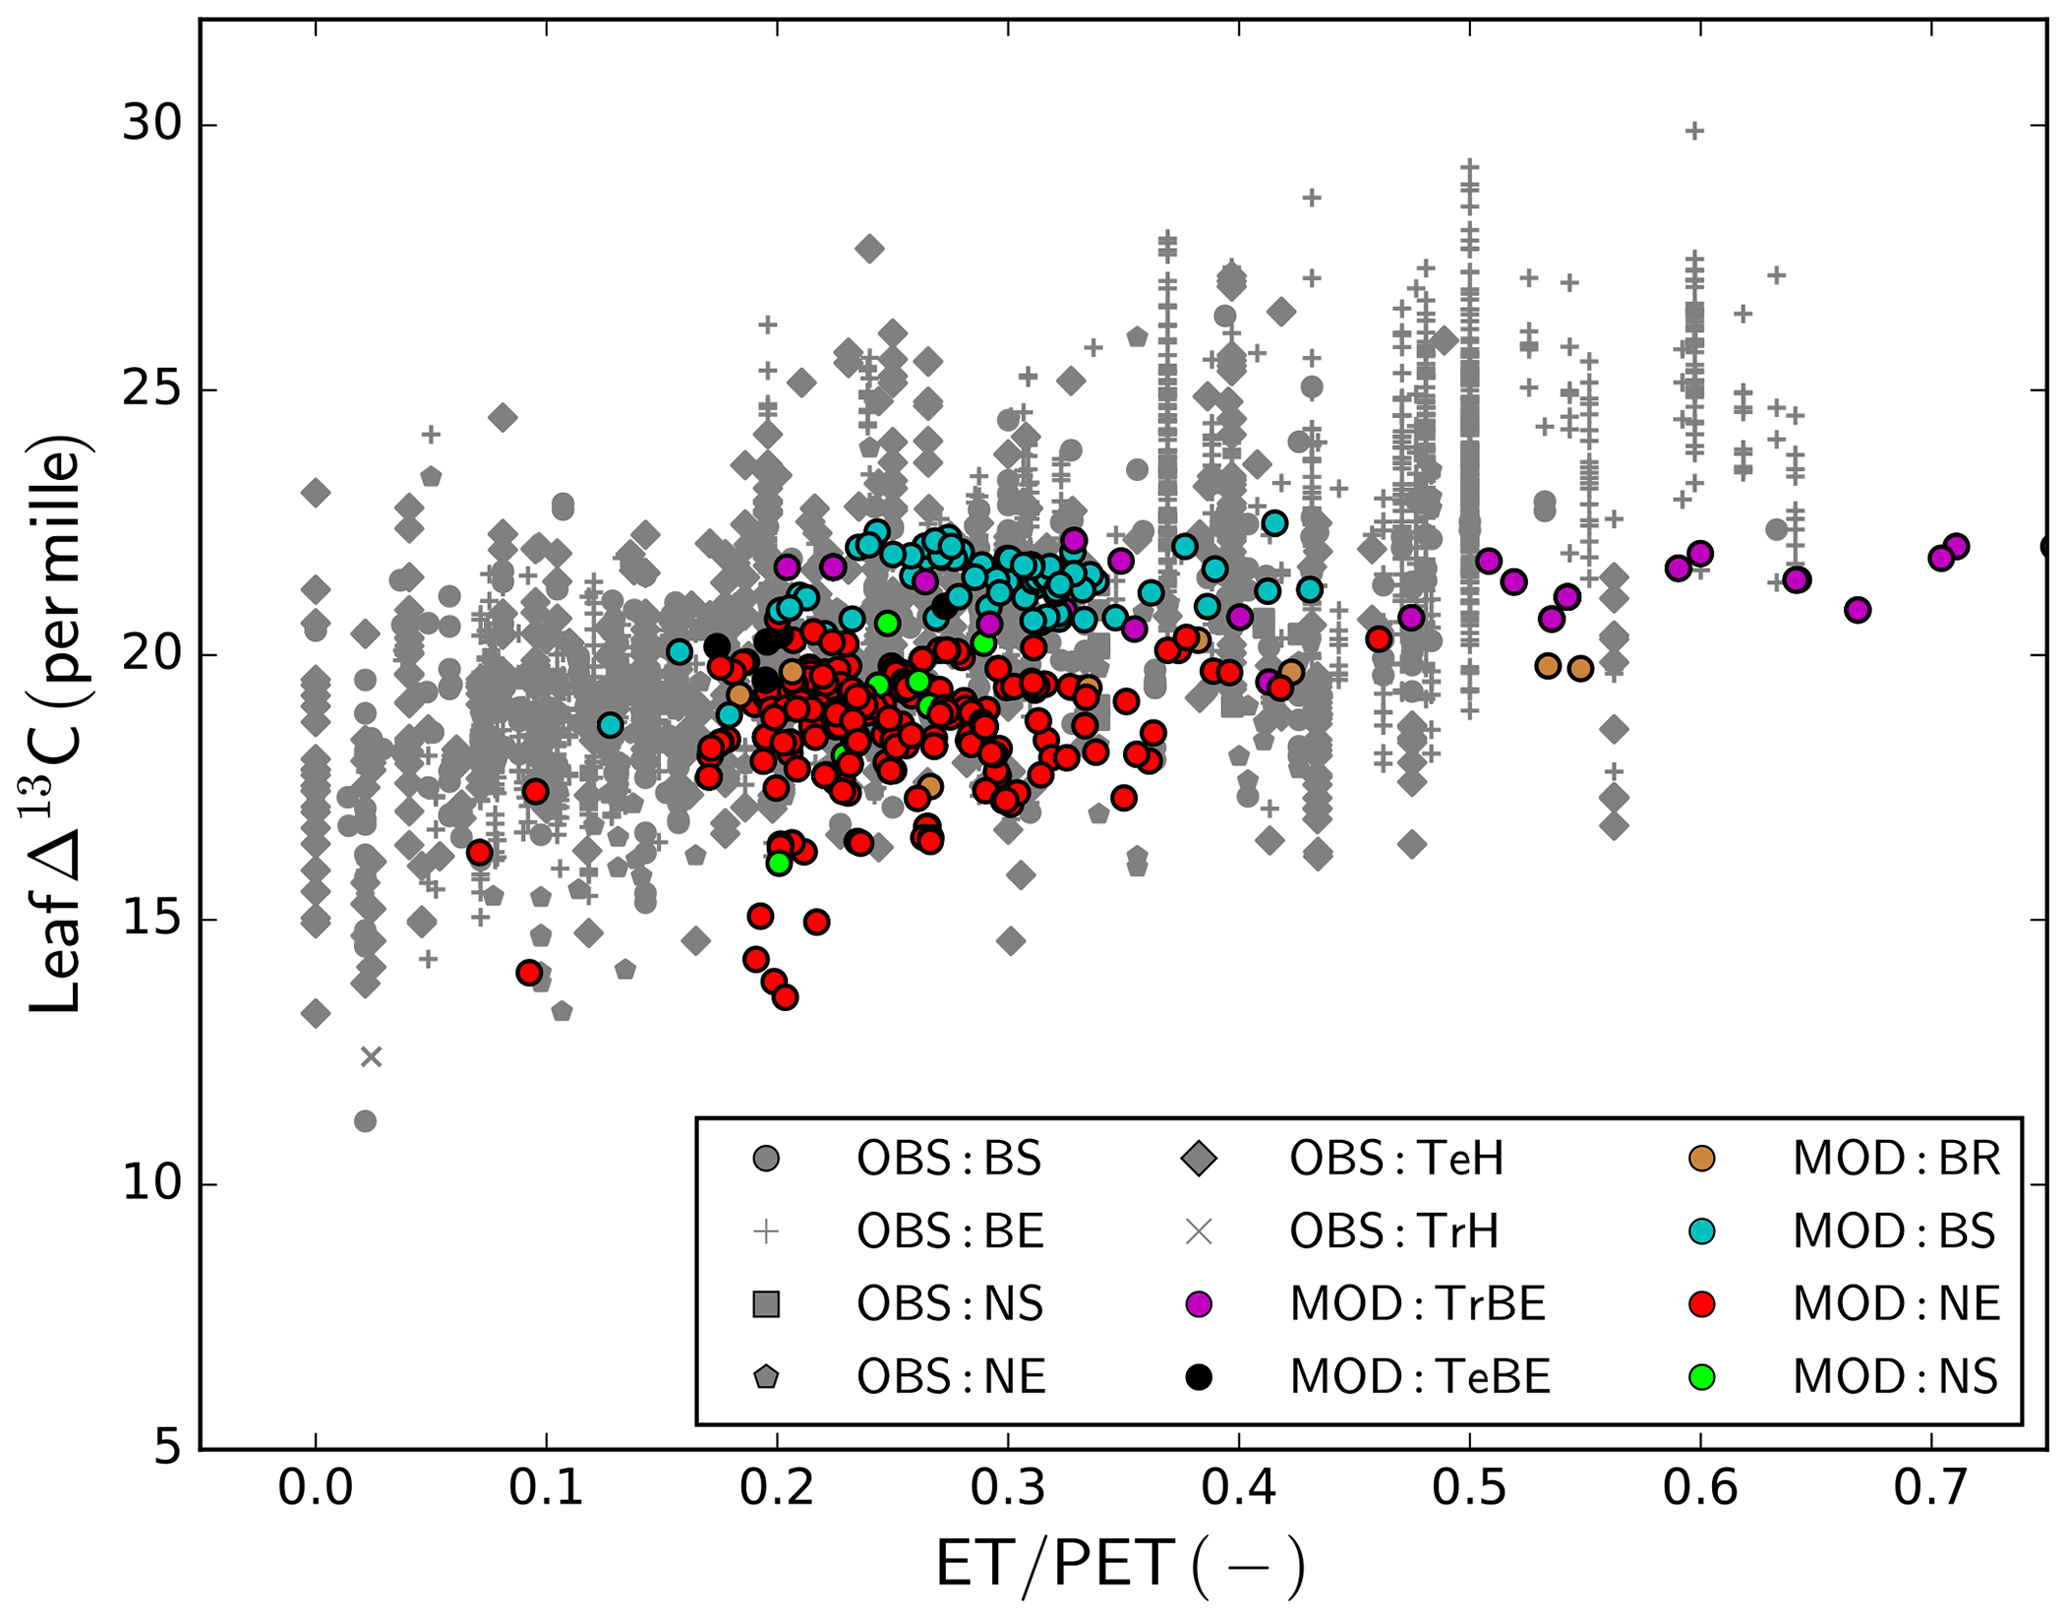
Figure 7Observed and simulated leaf Δ13C. Observations are taken from the global database of Cornwell et al. (2018b); simulations are derived from the GFDB set of sites (see Fig. 2). As there is no direct correspondence between data and model location, the data are plotted as a function of climatic water deficit, measured as the ratio of actual to potential evapotranspiration (ET∕PET). For model PFT abbreviations, see Table 1.
3.3 Model sensitivity analysis
The parameter sensitivity study reveals that from the many parameters introduced in this model (see the Supplement), the model output is sensitive only to a limited amount of these parameters. The role of specific parameters varies across sites (Table 3) and with the output quantity of interest (Table S1). A number of interesting things can be noted when looking at which parameters dominate across sites (Table 3). In line with reports from other studies for other models (e.g. Zaehle et al., 2005; Zaehle and Friend, 2010; Wramneby et al., 2008; Massoud et al., 2019), the first set of parameters is related to those affecting the photosynthetic nitrogen-use efficiency, which directly affect the C assimilation per unit leaf area. In QUINCY v1.0, this is mostly related to the magnitude of leaf N assumed to be structural N (), the scaling of leaf N to leaf chlorophyll content (, ), and the efficiency of RuBisCO-limited carboxylation rate per unit N ().
Table 3The 10 most important parameters (P) determining model uncertainty at four FLUXNET sites (FI-Hyy, FR-Hes, AU-Tum, and BR-Ma2, as in Figs. 3 and 8) and reference to the respective parameter description table in the Supplement (T). Overall importance of parameters is measured by first calculating the RPCC for each output variable and then calculating the mean of the absolute RPCC values across GPP, net N∕P mineralisation, vegetation, and ecosystem C, as well as leaf , weighted by the uncertainty contribution of these model outputs. The parameter names are denoted by asterisks: * refers to photosynthesis-related parameters; to soil-biogeochemistry-related parameters; to parameters related to vegetation growth and dynamics. See also Table S9 for a detailed breakdown of RPCCs according to output variable.
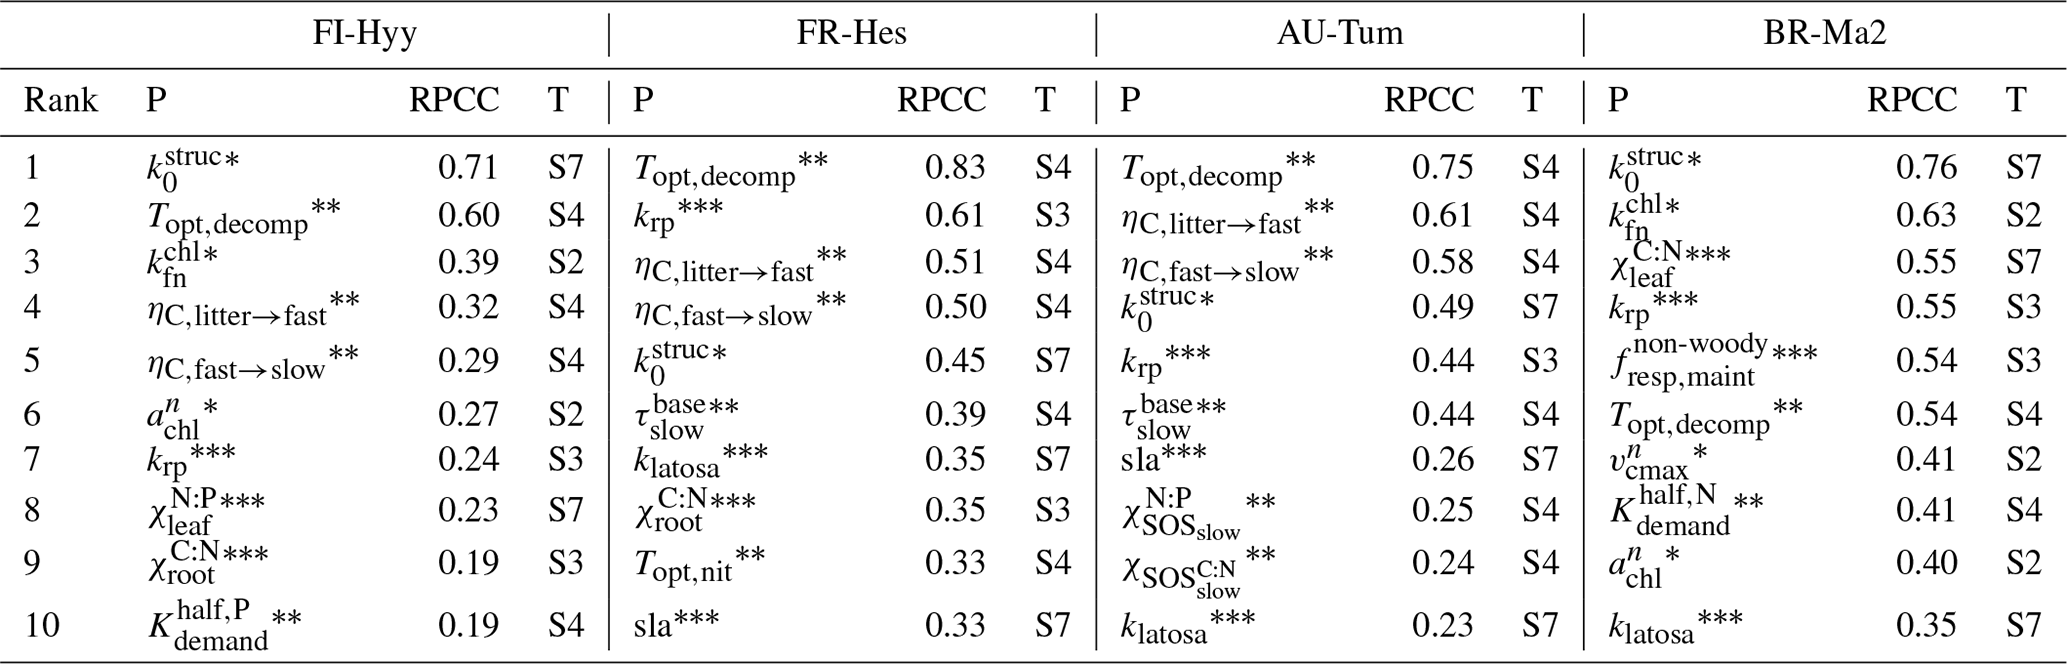
The second set of parameters to which the model is sensitive, unlike other carbon-only models, relates to parameters determining the rate of litter and soil organic matter turnover (Topt,decomp, ), the efficiency of microbial SOM processing (, ), and the C:N of the slow decomposing soil organic matter (). All these parameters control the rate at which nitrogen and phosphorus are released by SOM decomposition, which in the QUINCY 1.0 model is important for the growth of leaves and associated photosynthesis. Such a dependency is to be expected by a nutrient-cycle-enabled model and this is clearly documented in the dependence of simulated GPP on simulated net N and P mineralisation (Fig. S12). It is important to note that for the effect of uncertainty in the temperature optimum of decomposition, Topt,decomp, it is not the direct effect of the optimum point that matters, since it is larger than common soil temperatures for most of the sites, but a side effect of changing the default turnover time of litter and SOM along with the change in optimum temperature. Consistent with expectation, the rate of soil turnover is more important in cold that warm environments. Soil-based parameters are less important that photosynthetic parameters for the tropical site compared to the three non-tropical sites.
The third set of parameters identified as sensitive can be characterised as being related to vegetation growth and dynamics. On one hand, these are parameters dominating the carbon allocation within plants (klatosa, sla), also as noted by Zaehle et al. (2005) and Massoud et al. (2019) for other models, as well as the tissue stoichiometry (, ). Importantly, also the scaling exponent krp, relating diameter to crown area, and thereby determining the space constraint for the establishment and mortality of tree PFTs, plays some role in some of the sites due to its effect on LAI and total vegetation biomass. At the tropical BR-Ma2 site, despite temperature acclimation, the basal maintenance respiration rate for leaves and fine roots is also a sensitive parameter, as is the scaling parameter for limiting nutrient uptake under high nutrient availability ().
The parameter sensitivities investigated here propagate to uncertainty in the model output. The interquartile range of the model output (Fig. 8) is well constrained and centred around the results of the standard parameterisation reported in Table 2. Extreme parameter combinations cause larger variations but do not fundamentally change the model behaviour. Including wider parameter ranges for some more uncertain parameters will likely affect the absolute mean and uncertainty range of particular model output. Therefore, the results shown in Fig. 8 should not be interpreted as an estimate of parameter-based model uncertainty. However, the results do suggest that despite introducing a complex ecosystem model with many non-linear equations and parameters, the model does not reveal fundamental model instabilities.

Figure 8Median, interquartile range, and absolute range of simulated GPP, net mineralisation of NH4 () and PO4 (), leaf C:N and N:P, as well as vegetation C (veg. C) and total ecosystem C (up to a depth of 1 m) obtained for the four FLUXNET sites in Fig. 3 using Latin hypercube sampling (n=1000) for 45 parameters. Values have been normalised to the ensemble mean, given as the number for each site and variable to improve readability. The numbers below each individual box correspond the median value for each variable: GPP in units , in units , in units , and vegetation and total carbon in units kgC m−2.
By varying parameters, we essentially generate an ensemble of simulations with identical climate and atmospheric nutrient input, but different soil nutrient-cycle rates and vegetation nutrient-use efficiencies. At the example of the broad-leaved deciduous forest site FR-Hes, the model shows, as expected, clear dependencies between the rates of net N and P mineralisation and GPP, which also propagate to the simulated carbon stock in vegetation (Fig. S12) underlying the uncertainty ranges reported in Fig. 8. For this example, there is also a clearly negative correlation between the net N mineralisation and foliar C:N, which gives rise to a negative covariation of GPP and leaf C:N. Interestingly, such a correlation does not exist for foliar N:P, probably due to a lack of effect of foliar P concentrations on photosynthesis.
Land surface models with coupled carbon–nitrogen and phosphorus cycles have been published before (Goll et al., 2017; Wang et al., 2010; Yang et al., 2014). The QUINCY v1.0 model introduced in this paper distinguishes itself from these models in (i) that it seamlessly integrates nutrient dynamics with carbon, water, and energy calculations (e.g. there is no difference in time stepping between biogeophysical and biogeochemical processes) and (ii) that there is an explicit decoupling of the growth processes from C supply due to photosynthesis by accounting for temperature, moisture, and nutrient constraints in the formation of new tissue, as opposed to the simpler treatment of these dynamics in Zaehle and Friend (2010) and applied in Goll et al. (2017). The purpose of this paper is to provide a background for future studies on the effect of coupled biogeochemical cycles at large scales as well as on testing the effect alternative representations of important nutrient-cycle-related processes, for which the model is suitable due to its modular design. A detailed evaluation of all new submodules of the model is beyond the scope of this paper.
Overall, QUINCY v1.0 performs well in terms of diurnal, seasonal, and annual carbon fluxes across a range of ecosystem monitoring flux sites, spanning a large geographic gradient and a variety of ecosystem types. Despite the lack of any site-specific parameterisation, there is no systematic model bias for any single PFT for either the FLUXNET (Figs. 3 and 4) or the GFDB (Fig. 6) analyses. Including a coupling of the carbon cycle to representations of the nitrogen and phosphorus cycle affects long-term average productivity through its effects on photosynthetic capacity (changed foliar nitrogen concentration) and leaf area (as a result of the changes in root-to-shoot allocation). However, short-term diurnal or subseasonal shortage of soil nitrogen or phosphorus does not directly and instantaneously affect simulated productivity because of the buffering introduced through the labile and reserve storage.
Model predictions generally show an improvement in the prediction of GPP with the addition of the N cycle. This occurs despite a slight low bias in simulated foliar nitrogen concentration compared to the mean values of the TRY database (BS: 2.1 (0.6–3.2) % versus 1.7±0.3, TrBE∕TeBE: 1.7 (0.5–3.9) % versus 1.7±0.2, NE: 1.3 (0.5–1.9) % versus 1.0±0.4, NS: 1.9 (0.9–3.0) % versus 1.8±0.2 observed and simulated, respectively, Kattge et al., 2011). This comparison is indicative only, since there is a geographic mismatch between the spatial coverage and distribution of the modelled sites and the data in the TRY database. Note that these estimates are not fully independent because the minimum and maximum ranges of permissable foliar N were derived from Kattge et al. (2011).
The P-enabled version does not show additional improvement in simulating the regional differences in productivity. This is partly due to the fact that the sites with sufficient information on GPP and NPP available for model evaluation are as a majority located in temperate and boreal regions, where the main limiting nutrient is likely to be nitrogen (LeBauer and Treseder, 2008). However, even for the few tropical sites included in the analysis, where in general terms limitation of productivity by P would be expected (LeBauer and Treseder, 2008; Vitousek et al., 2010), we do not find any significant effect of the simulated P cycle. An important contributor is the fact that in QUINCY v1.0, the vertically explicit description of SOM dynamics permits very efficient recycling of organic P in the litter layer, where low mineral sorption capacities lead to efficient P uptake of soil microorganisms and vegetation. The efficient recycling in the litter layer is partially due to the biochemical mineralisation flux. Further observations are required in order to constrain this flux better (Reed et al., 2011). One further important factor is the unknown initial soil concentration of plant-available P, as well as uncertainties in the rate of P weathering. Improving the understanding of P availability across the globe remains an important challenge for the representation of P effects on productivity (Wang et al., 2010; Goll et al., 2017), requiring detailed observations of soil and vegetation P dynamics and manipulation experiments (e.g. Medlyn et al., 2016). In addition, similar to other models (Goll et al., 2017; Yang et al., 2014), QUINCY v1.0 currently assumes that P limitation solely affects productivity due to a stoichiometric constraint on growth, while other mechanisms may also play an important role in the acclimation of plant processes to different levels of P availability (Jiang et al., 2019).
The predicted GPP and NPP across a large range of climatic and biogeographic situations are in good agreement with observations and so is the average of the CUE (NPP ∕ GPP). However, the model does not reproduce the observed range in CUE in temperate and boreal forests, and the analysis of the main drivers of CUE shows that in the current model version, CUE is mostly a function of mean annual temperature. Vicca et al. (2012) suggested that this variance is associated with altered carbon partitioning and in particular increased belowground carbon allocation in response to nutrient shortage. The QUINCY v1.0 model simulates an increase of the root-to-shoot ratio with response to nutrient stress. However, the effect of this change on CUE is small, as increased root allocation not only decreases biomass production through increased allocation to higher turnover tissues, but also whole-plant-mass-specific respiration, given the implicit model assumption that mass-specific fine root respiration is smaller than leaf-mass-specific respiration. This inference is consistent with detailed observations at the FLUXNET site FI-Hyy (Ilvesniemi et al., 2009; Korhonen et al., 2013), where the QUINCY v1.0 model successfully simulated GPP and vegetation C storage (simulated/observed 7.0∕6.8 kgC m−2, Ilvesniemi et al., 2009) but substantially overestimated the NPP (simulated/observed: 536∕242 ). Additionally, the N uptake by the vegetation in addition to the N losses was in the same order of magnitude as the observations (Korhonen et al., 2013), suggesting that C partitioning rather than N availability is the source of the underestimation. Further causes of this model–data mismatch include alternative pathways of carbon partitioning not represented in the model (e.g. exudation), changes in tissue turnover times with changes in nutrient availability, and the magnitude of mass-specific autotrophic respiration. For instance, the estimated autotrophic respiration in FI-Hyy was 714 (Ilvesniemi et al., 2009), compared to 494 in the model , which may be the combined result of allocation, temperature response, and specific respiration rates, particularly below ground. The novel structure of the QUINCY v1.0 model that decouples photosynthesis from growth, and therefore permits to adjust carbon partitioning to different sinks at short timescales, will allow to investigate the effect of these processes in the future. Finally, the intra-PFT variation of observed CUE likely depends on other site-specific factors that affect site fertility, which are currently not adequately represented in the model, such as the effects of soil pH, site history, and species-level variability.
The comparison of simulated leaf 13C discrimination to observations recorded in the global dataset by (Cornwell et al., 2018b) suggests that the overall parameterisation of long-term mean leaf- and ecosystem-level water-use efficiency, derived from instantaneous leaf-level gas exchange measurements (Lin et al., 2015), broadly conforms with observations. Notably, the model also simulates the trend in discrimination with respect to changing water availability in accordance with observations, which suggests that the overall effect of moisture availability on water-use efficiency is appropriately considered by the model. Discrepancies between the observation-based estimates of water-use efficiency derived from leaf-level flux and isotope measurements have been noted before (Medlyn et al., 2017), and these may contribute to the remaining model–data mismatch. One possible reason for this mismatch may be the omission of mesophyll conductance in model formulations, which may induce systematic shifts in chloroplast [CO2] and thereby affect the simulated value of leaf Δ13C without affecting leaf-level water-use efficiency (Knauer et al., 2019).
In this paper, we presented the mathematical formulation of a new terrestrial biosphere model, QUINCY v1.0, that includes a number of ecophysiological processes (short-term and long-term storage pools, acclimation processes) that have not been represented in earlier TBMs. We evaluated QUINCY v1.0 against a range of observations from worldwide datasets and demonstrated that it is successful in simulating photosynthesis and plant dynamics across large geographical ranges and different ecosystem types with different levels of chronic nutrient input and water availability. We further demonstrated that despite increased complexity and therefore increased numbers of weakly constrained parameters, the model produces predictions of the coupled biogeochemical cycles at site level within reasonable and well-defined bounds. Whether or not the same parameter and therefore process ranking applies also to perturbation situations, e.g. from the manipulation of C, N, or P availability, still remains to be evaluated. The model evaluation provided in this paper points to shortcomings of the baseline QUINCY model in terms of the responses of carbon partitioning to nutrient availability and the interactions between plants and soil processes.
The next logical step in the model's evaluation is to subject it to a range of manipulative experimental settings that will test the realism of the coupling of the carbon–nitrogen–phosphorus cycle in different climate regimes (Zaehle et al., 2014; Yang et al., 2014; Medlyn et al., 2015). Such model evaluation can help point to the adequate representation of individual processes rather than just overall model performance. The inclusion of isotope tracers will increase the scope of such comparisons, since this will allow to better track carbon and nitrogen flows.
One of the motivations behind the development of the QUINCY v1.0 model was the recognition that there may be more than one adequate model representation for one process (Beven, 2008). Therefore, the model has been constructed with a modular design, allowing to replace some of its components by alternative representations to test their effect on model predictions. Examples of future work with QUINCY v1.0 include the control of plants to shape carbon, nitrogen, and phosphorus partitioning and thereby plant functioning in response to environmental change and plant–soil processes by including better representations of the interactions between root growth/activity and SOM turnover and stabilisation.
These basic benchmarks provide a baseline test to integrate QUINCY v1.0 into the JSBACH land surface model (Mauritsen et al., 2019) to allow for a spatially explicit simulation and integration of a range of important processes such as fire disturbance, land-use, and permafrost dynamics. This integration will also allow more comprehensive and rigorous benchmarking against a wider variety of data products. In the midterm, this will allow coupling to the Max Planck Institute's Earth System Model (MPI-ESM) framework ICON to address feedbacks between land biogeochemistry and climate on the basis of an improved representation of biological processes affecting land biogeochemical and biogeophysical processes.
The scientific part of the code is available under a GPL v3 licence. The scientific code of QUINCY relies on software infrastructure from the MPI-ESM environment, which is subject to the MPI-M software license agreement in its most recent form (http://www.mpimet.mpg.de/en/science/models/license, last access: 14 November 2019). The source code is available online (https://git.bgc-jena.mpg.de/quincy/quincy-model-releases, Thum et al., 2019), but its access is restricted to registered users. Readers interested in running the model should request a username and password from the corresponding authors or via the Git repository. Model users are strongly encouraged to follow the fair-use policy stated on https://www.bgc-jena.mpg.de/bgi/index.php/Projects/QUINCYModel (last access: 14 November 2019).
The supplement related to this article is available online at: https://doi.org/10.5194/gmd-12-4781-2019-supplement.
SZ conceived the model. TT, SC, LY, MK, and SZ developed the model. JE and RS helped with model implementation and testing. All authors contributed to the interpretation of the results and writing of the manuscript.
The authors declare that there are no competing interests.
We are grateful to Steffen Richter for technical assistance in developing the code, as well as to Sara Vicca for providing access to the GFDB database. This work used eddy-covariance data acquired by the FLUXNET community and in particular by the following networks: AmeriFlux (US Department of Energy, Biological and Environmental Research, Terrestrial Carbon Program (DE-FG02-04ER63917 and DE-FG02-04ER63911)), AfriFlux, AsiaFlux, CarboAfrica, CarboEuropeIP, CarboItaly, CarboMont, ChinaFlux, FluxnetCanada (supported by CFCAS, NSERC, BIOCAP, Environment Canada, and NRCan), GreenGrass, KoFlux, LBA, NECC, OzFlux, TCOS-Siberia, and USCCC. We acknowledge the financial support to the eddy-covariance data harmonisation provided by CarboEuropeIP, FAO-GTOS-TCO, iLEAPS, the Max Planck Institute for Biogeochemistry, the National Science Foundation, the University of Tuscia, Université Laval and Environment Canada, and the US Department of Energy and the database development and technical support from Berkeley Water Center, Lawrence Berkeley National Laboratory, Microsoft Research eScience, Oak Ridge National Laboratory, the University of California-Berkeley, and the University of Virginia. The authors are grateful to the three anonymous reviewers whose comments greatly improved this manuscript.
This research has been supported by the European Research Council (QUINCY (grant no. 647204)) and the German Research Foundation (grant no. ZA 763/2-1).
The article processing charges for this open-access
publication were covered by the Max Planck Society.
This paper was edited by Philippe Peylin and reviewed by three anonymous referees.
Ahrens, B., Braakhekke, M. C., Guggenberger, G., Schrumpf, M., and Reichstein, M.: Contribution of sorption, DOC transport and microbial interactions to the 14C age of a soil organic carbon profile: Insights from a calibrated process model, Soil Biol. Biochem., 88, 390–402, 2015. a
Ammann, C., Flechard, C., Leifeld, J., Neftel, A., and Fuhrer, J.: The carbon budget of newly established temperate grassland depends on management intensity, Agr. Ecosyst. Environ., 121, 5–20, https://doi.org/10.1016/j.agee.2006.12.002, 2007. a
Araújo, A. C., Nobre, A. D., Kruijt, B., Elbers, J. A., Dallarosa, R., Stefani, P., von Randow, C., Manzi, A. O., Culf, A. D., Gash, J. H. C., Valentini, R., and Kabat, P.: Comparative measurements of carbon dioxide fluxes from two nearby towers in a central Amazonian rainforest: The Manaus LBA site, J. Geophys. Res.-Atmos., 107, LBA 58–1–LBA 58–20, https://doi.org/10.1029/2001JD000676, 2002. a
Archibald, S., Nickless, A., Govender, N., Scholes, R. J., and Lehsten, V.: Climate and the inter-annual variability of fire in southern Africa: a meta-analysis using long-term field data and satellite-derived burnt area data, Global Ecol. Biogeogr., 19, 794–809, https://doi.org/10.1111/j.1466-8238.2010.00568.x, 2010. a
Atkin, O. K., Meir, P., and Turnbull, M. H.: Improving representation of leaf respiration in large-scale predictive climate–vegetation models, New Phytol., 202, 743–748, https://doi.org/10.1111/nph.12686, 2014. a, b
Ball, J., Wooddrow, I., and Berry, J. A.: A model predicting stomatal conductance and its contribution to the control of photosynthesis under different environmental conditions, in: Progress in Photosynthesis Research, edited by: Biggens, J., Dordrecht, The Netherlands, 1–4, 1987. a
Berbigier, P., Bonnefond, J.-M., and Mellmann, P.: CO2 and water vapour fluxes for 2 years above Euroflux forest site, Agr. Forest Meteorol., 108, 183–197, https://doi.org/10.1016/S0168-1923(01)00240-4, 2001. a
Bergeron, O., Margolis, H. A., Black, T. A., Coursolle, C., Dunn, A. L., Barr, A. G., and Wofsy, S. C.: Comparison of carbon dioxide fluxes over three boreal black spruce forests in Canada, Glob. Change Biol., 13, 89–107, https://doi.org/10.1111/j.1365-2486.2006.01281.x, 2007. a
Beringer, J., Hutley, L. B., Hacker, J. M., Neininger, B., and Paw, U. K. T.: Patterns and processes of carbon, water and energy cycles across northern Australian landscapes: From point to region, Agr. Forest Meteorol., 151, 1409–1416, https://doi.org/10.1016/j.agrformet.2011.05.003, 2011. a
Bernacchi, C. J., Singsaas, E. L., Pimentel, C., Protis Jr., A. R., and Long, S. P.: Improved temperature response functions for models of Rubisco-limited photosynthesis, Plant Cell Environ., 24, 253–259, 2001. a
Beven, K.: On doing better hydrological science, Hydrol. Process., 22, 3549–3553, 2008. a
Bonan, G. B.: Forests and Climate Change: Forcings, Feedbacks, and the Climate Benefits of Forests, Science, 320, 1444–1449, https://doi.org/10.1126/science.1155121, 2008. a
Bonan, G. B. and Doney, S. C.: Climate, ecosystems, and planetary futures: The challenge to predict life in Earth system models, Science, 359, eaam8328, https://doi.org/10.1126/science.aam8328, 2018. a
Bradford, M. A., Wieder, W. R., Bonan, G. B., Fierer, N., Raymond, P. A., and Crowther, T. W.: Managing uncertainty in soil carbon feedbacks to climate change, Nat. Clim. Change, 6, 751–758, https://doi.org/10.1038/nclimate3071, 2016. a
Brahney, J., Mahowald, N., Ward, D. S., Ballantyne, A. P., and Neff, J. C.: Is atmospheric phosphorus pollution altering global alpine Lake stoichiometry?, Global Biogeochem. Cy., 29, 1369–1383, https://doi.org/10.1002/2015GB005137, 2015. a
Campioli, M., Vicca, S., Luyssaert, S., and Bilcke, J.: Biomass production efficiency controlled by management in temperate and boreal ecosystems, Nat. Geosci., 8, 843–846, 2015. a
Carrara, A., Janssens, I. A., Yuste, J. C., and Ceulemans, R.: Seasonal changes in photosynthesis, respiration and NEE of a mixed temperate forest, Agr. Forest Meteorol., 126, 15–31, https://doi.org/10.1016/j.agrformet.2004.05.002, 2004. a
Chien, C.-T., Mackey, K. R. M., Dutkiewicz, S., Mahowald, N. M., Prospero, J. M., and Paytan, A.: Effects of African dust deposition on phytoplankton in the western tropical Atlantic Ocean off Barbados, Global Biogeochem. Cy., 30, 716–734, https://doi.org/10.1002/2015GB005334, 2016. a
Chiesi, M., Maselli, F., Bindi, M., Fibbi, L., Cherubini, P., Arlotta, E., Tirone, G., Matteucci, G., and Seufert, G.: Modelling carbon budget of Mediterranean forests using ground and remote sensing measurements, Agr. Forest Meteorol., 135, 22–34, https://doi.org/10.1016/j.agrformet.2005.09.011, 2005. a
Best, M. J., Pryor, M., Clark, D. B., Rooney, G. G., Essery, R. L. H., Ménard, C. B., Edwards, J. M., Hendry, M. A., Porson, A., Gedney, N., Mercado, L. M., Sitch, S., Blyth, E., Boucher, O., Cox, P. M., Grimmond, C. S. B., and Harding, R. J.: The Joint UK Land Environment Simulator (JULES), model description – Part 1: Energy and water fluxes, Geosci. Model Dev., 4, 677–699, https://doi.org/10.5194/gmd-4-677-2011, 2011. a
Cleugh, H. A., Leuning, R., Mu, Q., and Running, S. W.: Regional evaporation estimates from flux tower and MODIS satellite data, Remote Sens. Environ., 106, 285–304, https://doi.org/10.1016/j.rse.2006.07.007, 2007. a
Cleveland, C. C., Townsend, A. R., Schimel, D. S., Fisher, H., Howarth, R. W., Hedin, L. O., Perakis, S. S., Latty, E. F., Von Fischer, J. C., Elseroad, A., and Wasson, M. F.: Global patterns of terrestrial biological nitrogen (N-2) fixation in natural ecosystems, Global Biogeochem. Cy., 13, 623–645, 1999. a
Cleveland, C. C., Houlton, B. Z., Smith, W. K., Marklein, A. R., Reed, S. C., Parton, W. J., Del Grosso, S. J., and Running, S.: Patterns of new versus recycled primary production in the terrestrial biosphere, P. Natl. Acad. Sci. USA, 110, 12733–12737, https://doi.org/10.1073/pnas.1302768110, 2013. a
Cook, B. D., Davis, K. J., Wang, W., Desai, A., Berger, B. W., Teclaw, R. M., Martin, J. G., Bolstad, P. V., Bakwin, P. S., Yi, C., and Heilman, W.: Carbon exchange and venting anomalies in an upland deciduous forest in northern Wisconsin, USA, Agr. Forest Meteorol., 126, 271–295, https://doi.org/10.1016/j.agrformet.2004.06.008, 2004. a
Cornwell, W., Wright, I., Turner, J., Maire, V., Barbour, M., Cernusak, L., Dawson, T., Ellsworth, D., Farquhar, G., Griffiths, H., Keitel, C., Knohl, A., Reich, P., Williams, D., Bhaskar, R., Cornelissen, J., Richards, A., Schmidt, S., Valladares, F., C, K., Schulze, E.-D., Buchmann, N., and Santiago, L.: Leaf Δ13C database, available at: https://github.com/wcornwell/leaf13C/tree/v0.1.0 (last access: 31 July 2018), 2018a. a
Cornwell, W. K., Wright, I. J., Turner, J., Maire, V., Barbour, M. M., Cernusak, L. A., Dawson, T., Ellsworth, D., Farquhar, G. D., Griffiths, H., Keitel, C., Knohl, A., Reich, P. B., Williams, D. G., Bhaskar, R., Cornelissen, J. H. C., Richards, A., Schmidt, S., Valladares, F., Körner, C., Schulze, E.-D., Buchmann, N., and Santiago, L. S.: Climate and soils together regulate photosynthetic carbon isotope discrimination within C3 plants worldwide, Global Ecol. Biogeogr., 27, 1056–1067, 2018b. a, b, c, d
De Kauwe, M. G., Medlyn, B. E., Zaehle, S., Walker, A. P., Dietze, M. C., Hickler, T., Jain, A. K., Luo, Y., Parton, W. J., Prentice, I. C., Smith, B., Thornton, P. E., Wang, S., Wang, Y.-P., Wårlind, D., Weng, E., Crous, Kristine, Y., Ellsworth, D. S., Hanson, P. J., Seok, K. H., Warren, J. M., Oren, R., and Norby, R. J.: Forest water use and water use efficiency at elevated CO2: a model-data intercomparison at two contrasting temperate forest FACE sites, Glob. Change Biol., 19, 1759–1779, https://doi.org/10.1111/gcb.12164, 2013. a, b
De Kauwe, M. G., Medlyn, B. E., Zaehle, S., Walker, A. P., Dietze, M. C., Wang, Y.-P., Luo, Y., Jain, A. K., El-Masri, B., Hickler, T., Wårlind, D., Weng, E., Parton, W. J., Thornton, P. E., Wang, S., Prentice, I. C., Asao, S., Smith, B., McCarthy, H. R., Iversen, C. M., Hanson, P. J., Warren, J. M., Oren, R., and Norby, R. J.: Where does the carbon go? A model–data intercomparison of vegetation carbon allocation and turnover processes at two temperate forest free-air CO2 enrichment sites, New Phytol., 203, 883–899, https://doi.org/10.1111/nph.12847, 2014. a
Desai, A. R., Bolstad, P. V., Cook, B. D., Davis, K. J., and Carey, E. V.: Comparing net ecosystem exchange of carbon dioxide between an old-growth and mature forest in the upper Midwest, USA, Agr. Forest Meteorol., 128, 33–55, https://doi.org/10.1016/j.agrformet.2004.09.005, 2005. a
Dickinson, R. E., Oleson, K. W., Bonan, G., Hoffman, F., Thornton, P., Vertenstein, M., Yang, Z.-L., and Zeng, X.: The Community Land Model and Its Climate Statistics as a Component of the Community Climate System Model, J. Climate, 19, 2302–2324, https://doi.org/10.1175/JCLI3742.1, 2006. a
Dolman, A., Moors, E., and Elbers, J.: The carbon uptake of a mid latitude pine forest growing on sandy soil, Agr. Forest Meteorol., 111, 157–170, https://doi.org/10.1016/S0168-1923(02)00024-2, 2002. a
Dunn, A. L., Barford, C. C., Wofsy, S. C., Goulden, M. L., and Daube, B. C.: A long-term record of carbon exchange in a boreal black spruce forest: means, responses to interannual variability, and decadal trends, Glob. Change Biol., 13, 577–590, https://doi.org/10.1111/j.1365-2486.2006.01221.x, 2007. a
Egea, G., Verhoef, A., and Vidale, P. L.: Towards an improved and more flexible representation of water stress in coupled photosynthesis–stomatal conductance models, Agr. Forest Meteorol., 151, 1370–1384, 2011. a
Fatichi, S., Leuzinger, S., and Körner, C.: Moving beyond photosynthesis: from carbon source to sink-driven vegetation modeling, New Phytol., 201, 1086–1095, 2013. a, b, c
Fisher, R., McDowell, N., Purves, D., Moorcroft, P., Sitch, S. A., Cox, P. M., Huntingford, C., Meir, P., and Ian Woodward, F.: Assessing uncertainties in a second-generation dynamic vegetation model caused by ecological scale limitations, New Phytol., 187, 666–681, 2010. a
Friedlingstein, P., Meinshausen, M., Arora, V. K., Jones, C. D., Anav, A., Liddicoat, S. K., and Knutti, R.: Uncertainties in CMIP5 Climate Projections due to Carbon Cycle Feedbacks, J. Climate, 27, 511–526, https://doi.org/10.1175/JCLI-D-12-00579.1, 2014. a
Friend, A. D.: Terrestrial plant production and climate change, J. Exp. Bot., 61, 1293–1309, 2010. a
Friend, A. D., Stevens, A. K., Knox, R. G., and Cannell, M. G. R.: A process-based, terrestrial biosphere model of ecosystem dynamics (Hybrid v3.0), Ecol. Model., 95, 249–287, 1997. a
Friend, A. D., Geider, R. J., Behrenfeld, M. J., and Still, C. J.: Photosynthesis in Global-Scale Models, in: Photosynthesis in silico: Understanding complexity from molecules to ecosystems, edited by: Laisk, A., Nedbal, L., and Govindjee, Springer, 465–497, 2009. a
Gerber, S., Hedin, L. O., Oppenheimer, M., Pacala, S. W., and Shevliakova, E.: Nitrogen cycling and feedbacks in a global dynamic land model, Global Biogeochem. Cy., 24, GB1001 https://doi.org/10.1029-2008GB003336, 2010. a
Goldstein, A., Hultman, N., Fracheboud, J., Bauer, M., Panek, J., Xu, M., Qi, Y., Guenther, A., and Baugh, W.: Effects of climate variability on the carbon dioxide, water, and sensible heat fluxes above a ponderosa pine plantation in the Sierra Nevada (CA), Agr. Forest Meteorol., 101, 113–129, https://doi.org/10.1016/S0168-1923(99)00168-9, 2000. a
Goll, D. S., Vuichard, N., Maignan, F., Jornet-Puig, A., Sardans, J., Violette, A., Peng, S., Sun, Y., Kvakic, M., Guimberteau, M., Guenet, B., Zaehle, S., Penuelas, J., Janssens, I., and Ciais, P.: A representation of the phosphorus cycle for ORCHIDEE (revision 4520), Geosci. Model Dev., 10, 3745–3770, https://doi.org/10.5194/gmd-10-3745-2017, 2017. a, b, c, d, e
Granier, A., Ceschia, E., Damesin, C., Dufrêne, E., Epron, D., Gross, P., Lebaube, S., Le Dantec, V., Le Goff, N., Lemoine, D., Lucot, E., Ottorini, J. M., Pontailler, J. Y., and Saugier, B.: The carbon balance of a young Beech forest, Funct. Ecol., 14, 312–325, https://doi.org/10.1046/j.1365-2435.2000.00434.x, 2000. a
Graven, H., Allison, C. E., Etheridge, D. M., Hammer, S., Keeling, R. F., Levin, I., Meijer, H. A. J., Rubino, M., Tans, P. P., Trudinger, C. M., Vaughn, B. H., and White, J. W. C.: Compiled records of carbon isotopes in atmospheric CO2 for historical simulations in CMIP6, Geosci. Model Dev., 10, 4405–4417, https://doi.org/10.5194/gmd-10-4405-2017, 2017. a
Grünwald, T. and Bernhofer, C.: A decade of carbon, water and energy flux measurements of an old spruce forest at the Anchor Station Tharandt, Tellus B, 59, 387–396, https://doi.org/10.1111/j.1600-0889.2007.00259.x, 2007. a
Grünzweig, J. M., Lin, T., Rotenberg, E., Schwartz, A., and Yakir, D.: Carbon sequestration in arid-land forest, Glob. Change Biol., 9, 791–799, https://doi.org/10.1046/j.1365-2486.2003.00612.x, 2003. a
Gu, L., Meyers, T., Pallardy, S. G., Hanson, P. J., Yang, B., Heuer, M., Hosman, K. P., Riggs, J. S., Sluss, D., and Wullschleger, S. D.: Direct and indirect effects of atmospheric conditions and soil moisture on surface energy partitioning revealed by a prolonged drought at a temperate forest site, J. Geophys. Res.-Atmos., 111, D16102, https://doi.org/10.1029/2006JD007161, 2006. a
Hararuk, O., Smith, M. J., and Luo, Y.: Microbial models with data-driven parameters predict stronger soil carbon responses to climate change, Glob. Change Biol., 21, 2439–2453, https://doi.org/10.1111/gcb.12827, 2015. a
Hartmann, H., Adams, H. D., Hammond, W. M., Hoch, G., Landhäusser, S. M., Wiley, E., and Zaehle, S.: Identifying differences in carbohydrate dynamics of seedlings and mature trees to improve carbon allocation in models for trees and forests, Environ. Exp. Bot., 152, 7–18, 2018. a
Hengl, T., Mendes de Jesus, J., Heuvelink, G. B., Ruiperez Gonzalez, M., and Kilibarda, M.: SoilGrids250m: global gridded soil information based on Machine Learning, PLoS ONE, 12, e0169748, https://doi.org/10.1371/journal.pone.0169748, 2017. a
Hollinger, D. Y., Goltz, S. M., Davidson, E. A., Lee, J. T., Tu, K., and Valentine, H. T.: Seasonal patterns and environmental control of carbon dioxide and water vapour exchange in an ecotonal boreal forest, Glob. Change Biol., 5, 891–902, https://doi.org/10.1046/j.1365-2486.1999.00281.x, 1999. a
Hou, E., Chen, C., Luo, Y., Zhou, G., Kuang, Y., Zhang, Y., Heenan, M., Lu, X., and Wen, D.: Effects of climate on soil phosphorus cycle and availability in natural terrestrial ecosystems, Glob. Change Biol., 24, 3344–3356, https://doi.org/10.1111/gcb.14093, 2018. a
Hungate, B. A., Dukes, J. S., Shaw, M. R., Luo, Y., and Field, C. B.: Nitrogen and Climate Change, Science, 302, 1512–1513, https://doi.org/10.1126/science.1091390, 2003. a
Hyvönen, R., Agren, G. I., Linder, S., Persson, T., Cotrufo, M. F., Ekblad, A., Freeman, M., Grelle, A., Janssens, I. A., Jarvis, P. G., Kellomäki, S., Lindroth, A., Loustau, D., Lundmark, T., Norby, R. J., Oren, R., Pilegaard, K., Ryan, M. G., Sigurdsson, B. D., Strömgren, M., van Oijen, M., and Wallin, G.: The likely impact of elevated [CO2], nitrogen deposition, increased temperature and management on carbon sequestration in temperate and boreal forest ecosystems: a literature review, New Phytol., 173, 463–480, 2007. a, b
Ilvesniemi, H., Levula, J., Ojansuu, R., Kolari, P., Kulmala, L., Pumpanen, J. Launiainen, S., Vesala, T., and Nikinmaa, E.: Long-term measurements of the carbon balance of a boreal Scots pine dominated forest ecosystem, Boreal Environ. Res., 14, 731–753, 2009. a, b, c
Jackson, R. B., Canadell, J., Ehleringer, J. R., Mooney, H. A., Sala, O. E., and Schulze, E. D.: A global analysis of root distributions for terrestrial biomes, Oecologia, 108, 389–411, 1996. a
Jiang, M., Caldararu, S., Zaehle, S., Ellsworth, D. S., and Medlyn, B. E.: Towards a more physiological representation of vegetation phosphorus processes in land surface models, New Phytol., 222, 1223–1229, https://doi.org/10.1111/nph.15688, 2019. a
June, T., Evans, J. R., and Farquhar, G. D.: A simple new equation for the reversible temperature dependence of photosynthetic electron transport: a study on soybean leaf, Funct. Plant Biol., 31, 275–283 2004. a
Kattge, J., Díaz, S., Lavorel, S., Prentice, I. C., Leadley, P., Bönisch, G., Garnier, E., Westoby, M., Reich, P. B., Wright, I. J., Cornelissen, J. H. C., Violle, C., Harrison, S. P., Van Bodegom, P. M., Reichstein, M., Enquist, B. J., Soudzilovskaia, N. A., Ackerly, D. D., Anand, M., Atkin, O., Bahn, M., Baker, T. R., Baldocchi, D., Bekker, R., Blanco, C. C., Blonder, B., Bond, W. J., Bradstock, R., Bunker, D. E., Casanoves, F., Caverner-Bares, J., Chambers, J. Q., Chapin III, F. S., Chave, J., Coomes, D., Cornwell, W. K., Craine, J. M., Dobrin, B. H., Duarte, L., Durka, W., Elser, J., Esser, G., Estiarte, M., Fagan, W. F., Fand, J., Fernández-Méndez, F., Fidelis, A., Finegan, B., Flores, O., Ford, H., Frank, D., Freschet, G. T., Fyllas, N. M., Gallagher, R. V., Green, W. A., Gutierrez, A. G., Thomas, H., Higgins, S. I., Hodgson, J. G., Jalili, A., Jansen, S., Joly, C. A., Kerkhoff, A. J., Kirkup, D., Kitajima, K., Kleyer, M., Klotz, S., Knops, J. M. H., Kramer, K., Kühn, I., Kurokawa, H., Laughlin, D., Lee, T. D., Leishman, M., Lens, F., Lenz, T., Lewis, S. L., Lloyd, J., Llusià, J., Louault, F., Ma, S., Mahecha, M. D., Manning, P., Massad, T., Medlyn, B. E., Messier, J., Moles, A. T., Müller, S. C., Nadrowski, K., Naeem, S., Niinemets, Ü., Nöllert, S., Nüske, A., Ogaya, R., Oleksyn, J., Onipchenko, V. G., Onoda, Y., Ordoñez, J., Overbeck, G., Ozinga, W. A., Patino, S., Paula, S., Pausas, J. G., Peñuelas, J., Phillips, O. L., Pillar, V., Poorter, H., Poorter, L., Poschlod, P., Prinzing, A., Proulx, R., Rammig, A., Reinsch, S., Reu, B., Sack, L., Salgado-Negret, B., Sardans, J., Shiodera, S., Shipley, B., Siefert, A., Sosinski, E., Soussana, J. F., Swaine, E., Swenson, N., Thompson, K., Thornton, P., Waldram, M., Weiher, E., White, M., White, S., Wright, S. J., Yguel, B., Zaehle, S., Zanne, A. E., and Wirth, C.: TRY – a global database of plant traits, Glob. Change Biol., 17, 2905–2935, 2011. a, b
Keenan, T., Sabate, S., and Gracia, C.: Soil water stress and coupled photosynthesis–conductance models: Bridging the gap between conflicting reports on the relative roles of stomatal, mesophyll conductance and biochemical limitations to photosynthesis, Agr. Forest Meteorol., 150, 443–453, https://doi.org/10.1016/j.agrformet.2010.01.008, 2010. a
Knauer, J., Werner, C., and Zaehle, S.: Evaluating stomatal models and their atmospheric drought response in a land surface scheme: A multibiome analysis, J. Geophys. Res.-Biogeo., 120, 1894–1911, 2015. a
Knauer, J., Zaehle, S., Reichstein, M., Medlyn, B. E., Forkel, M., Hagemann, S., and Werner, C.: The response of ecosystem water-use efficiency to rising atmospheric CO2 concentrations: sensitivity and large-scale biogeochemical implications, New Phytol., 213, 1654–1666, https://doi.org/10.1111/nph.14288, 2016. a
Knauer, J., Zaehle, S., De Kauwe, M., Bahar, N. H., Evans, J. R., Medlyn, B. E., Reichstein, M., and Werner, C.: Effects of mesophyll conductance on vegetation responses to elevated CO2 concentrations in a land surface model, Glob. Change Biol., 25, 1820–1838,https://doi.org/10.1111/gcb.14604, 2019. a
Korhonen, J. F. J., Pihlatie, M., Pumpanen, J., Aaltonen, H., Hari, P., Levula, J., Kieloaho, A.-J., Nikinmaa, E., Vesala, T., and Ilvesniemi, H.: Nitrogen balance of a boreal Scots pine forest, Biogeosciences, 10, 1083–1095, https://doi.org/10.5194/bg-10-1083-2013, 2013. a, b
Koven, C. D., Riley, W. J., Subin, Z. M., Tang, J. Y., Torn, M. S., Collins, W. D., Bonan, G. B., Lawrence, D. M., and Swenson, S. C.: The effect of vertically resolved soil biogeochemistry and alternate soil C and N models on C dynamics of CLM4, Biogeosciences, 10, 7109–7131, https://doi.org/10.5194/bg-10-7109-2013, 2013. a
Krinner, G., Viovy, N., de Noblet-Ducoudré, N., Ogée, J., Polcher, J., Friedlingstein, P., Ciais, P., Sitch, S. A., and Prentice, I. C.: A dynamic global vegetation model for studies of the coupled atmosphere-biosphere system, Global Biogeochem. Cy., 19, GB1015, https://doi.org/10.1029/2003GB002199, 2005. a
Kull, O. and Kruijt, B.: Leaf photosynthetic light response: a mechanistic model for scaling photosynthesis to leaves and canopies, Funct. Ecol., 12, 767–777, 1998. a, b
Kutsch, W. L., Kolle, O., Rebmann, C., Knohl, A., Ziegler, W., and Schulze, E.-D.: Advection and resulting CO2 exchange uncertainty in a tall forest in central Germany, Ecol. App., 18, 1391–1405, https://doi.org/10.1890/06-1301.1, 2008. a
Lagergren, F., Lindroth, A., Dellwik, E., Ibrom, A., Lankreijer, H., Launiainen, S., Mölder, M., Kolari, P., Pilegaard, K., and Vesala, T.: Biophysical controls on CO2 fluxes of three Northern forests based on long-term eddy covariance data, Tellus B, 60, 143–152, https://doi.org/10.1111/j.1600-0889.2006.00324.x, 2008. a, b
Lamarque, J.-F., Bond, T. C., Eyring, V., Granier, C., Heil, A., Klimont, Z., Lee, D., Liousse, C., Mieville, A., Owen, B., Schultz, M. G., Shindell, D., Smith, S. J., Stehfest, E., Van Aardenne, J., Cooper, O. R., Kainuma, M., Mahowald, N., McConnell, J. R., Naik, V., Riahi, K., and van Vuuren, D. P.: Historical (1850–2000) gridded anthropogenic and biomass burning emissions of reactive gases and aerosols: methodology and application, Atmos. Chem. Phys., 10, 7017-7039, https://doi.org/10.5194/acp-10-7017-2010, 2010. a
Lamarque, J.-F., Kyle, G. P., Meinshausen, M., Riahi, K., Smith, S. J., van Vuuren, D. P., Conley, A. J., and Vitt, F.: Global and regional evolution of short-lived radiatively-active gases and aerosols in the Representative Concentration Pathways, Climatic Change, 109, 191–212, https://doi.org/10.1007/s10584-011-0155-0, 2011. a
LeBauer, D. S. and Treseder, K. K.: Nitrogen limitation of net primary productivity in terrestrial ecosystems is globally distributed, Ecology, 89, 371–379, 2008. a, b
Le Quéré, C., Andrew, R. M., Friedlingstein, P., Sitch, S., Pongratz, J., Manning, A. C., Korsbakken, J. I., Peters, G. P., Canadell, J. G., Jackson, R. B., Boden, T. A., Tans, P. P., Andrews, O. D., Arora, V. K., Bakker, D. C. E., Barbero, L., Becker, M., Betts, R. A., Bopp, L., Chevallier, F., Chini, L. P., Ciais, P., Cosca, C. E., Cross, J., Currie, K., Gasser, T., Harris, I., Hauck, J., Haverd, V., Houghton, R. A., Hunt, C. W., Hurtt, G., Ilyina, T., Jain, A. K., Kato, E., Kautz, M., Keeling, R. F., Klein Goldewijk, K., Körtzinger, A., Landschützer, P., Lefèvre, N., Lenton, A., Lienert, S., Lima, I., Lombardozzi, D., Metzl, N., Millero, F., Monteiro, P. M. S., Munro, D. R., Nabel, J. E. M. S., Nakaoka, S., Nojiri, Y., Padin, X. A., Peregon, A., Pfeil, B., Pierrot, D., Poulter, B., Rehder, G., Reimer, J., Rödenbeck, C., Schwinger, J., Séférian, R., Skjelvan, I., Stocker, B. D., Tian, H., Tilbrook, B., Tubiello, F. N., van der Laan-Luijkx, I. T., van der Werf, G. R., van Heuven, S., Viovy, N., Vuichard, N., Walker, A. P., Watson, A. J., Wiltshire, A. J., Zaehle, S., and Zhu, D.: Global Carbon Budget 2017, Earth Syst. Sci. Data, 10, 405–448, https://doi.org/10.5194/essd-10-405-2018, 2018. a
Lin, Y.-S., Medlyn, B. E., Duursma, R. A., Prentice, I. C., Wang, H., Baig, S., Eamus, D., de Dios, V. R., Mitchell, P., Ellsworth, D. S., de Beeck, M. O., Wallin, G., Uddling, J., Tarvainen, L., Linderson, M.-L., Cernusak, L. A., Nippert, J. B., Ocheltree, T. W., Tissue, D. T., Martin-StPaul, N. K., Rogers, A., Warren, J. M., De Angelis, P., Hikosaka, K., Han, Q., Onoda, Y., Gimeno, T. E., Barton, C. V. M., Bennie, J., Bonal, D., Bosc, A., Low, M., Macinins-Ng, C., Rey, A., Rowland, L., Setterfield, S. A., Tausz-Posch, S., Zaragoza-Castells, J., Broadmeadow, M. S. J., Drake, J. E., Freeman, M., Ghannoum, O., Hutley, L. B., Kelly, J. W., Kikuzawa, K., Kolari, P., Koyama, K., Limousin, J. M., Meir, P., Lola da Costa, A. C., Mikkelsen, T. N., Salinas, N., Sun, W., and Wingate, L.: Optimal stomatal behaviour around the world, Nat. Clim. Change, 5, 459–464, 2015. a
Lindroth, A., Klemedtsson, L., Grelle, A., Weslien, P., and Langvall, O.: Measurement of net ecosystem exchange, productivity and respiration in three spruce forests in Sweden shows unexpectedly large soil carbon losses, Biogeochem., 89, 43–60, https://doi.org/10.1007/s10533-007-9137-8, 2008. a
Lloyd, J. and Taylor, J. A.: On the temperature dependence of soil respiration, Funct. Ecol., 8, 315–323, 1994. a
Ma, S., Baldocchi, D. D., Xu, L., and Hehn, T.: Inter-annual variability in carbon dioxide exchange of an oak/grass savanna and open grassland in California, Agr. Forest Meteorol., 147, 157–171, https://doi.org/10.1016/j.agrformet.2007.07.008, 2007. a, b
Massoud, E. C., Xu, C., Fisher, R. A., Knox, R. G., Walker, A. P., Serbin, S. P., Christoffersen, B. O., Holm, J. A., Kueppers, L. M., Ricciuto, D. M., Wei, L., Johnson, D. J., Chambers, J. Q., Koven, C. D., McDowell, N. G., and Vrugt, J. A.: Identification of key parameters controlling demographically structured vegetation dynamics in a land surface model: CLM4.5(FATES), Geosci. Model Dev., 12, 4133–4164, https://doi.org/10.5194/gmd-12-4133-2019, 2019. a, b
Mauritsen, T., Bader, J., Becker, T., Behrens, J., Bittner, M., Brokopf, R., Brovkin, V., Claussen, M., Crueger, T., Esch, M., Fast, I., Fiedler, S., Fläschner, D., Gayler, V., Giorgetta, M., Goll, D. S., Haak, H., Hagemann, S., Hedemann, C., Hohenegger, C., Ilyina, T., Jahns, T., Jimenez de la Cuesta Otero, D., Jungclaus, J., Kleinen, T., Kloster, S., Kracher, D., Kinne, S., Kleberg, D., Lasslop, G., Kornblueh, L., Marotzke, J., Matei, D., Meraner, K., Mikolajewicz, U., Modali, K., Möbis, B., Müller, W. A., Nabel, J. E. M. S., Nam, C. C. W., Notz, D., Nyawira, S.-S., Paulsen, H., Peters, K., Pincus, R., Pohlmann, H., Pongratz, J., Popp, M., Raddatz, T., Rast, S., Redler, R., Reick, C. H., Rohrschneider, T., Schemann, V., Schmidt, H., Schnur, R., Schulzweida, U., Six, K. D., Stein, L., Stemmler, I., Stevens, B., von Storch, J.-S., Tian, F., Voigt, A., de Vrese, P., Wieners, K.-H., Wilkenskjeld, S., Winkler, A., and Roeckner, E.: Developments in the MPI-M Earth System Model version 1.2 (MPI-ESM 1.2) and its response to increasing CO2, J. Adv. Model. Earth Sy., 11, 998–1038, https://doi.org/10.1029/2018MS001400, 2019. a
Medlyn, B. E., Zaehle, S., De Kauwe, M. G., Walker, A. P., Dietze, M. C., Hanson, P. J., Hickler, T., Jain, A. K., Luo, Y., Parton, W., Prentice, I. C., Thornton, P. E., Wang, S., Wang, Y.-P., Weng, E., Iversen, C. M., McCarthy, H. R., Warren, J. M., Oren, R., and Norby, R. J.: Using ecosystem experiments to improve vegetation models, Nat. Clim. Change, 5, 528–534, 2015. a
Medlyn, B. E., De Kauwe, M. G., Zaehle, S., Walker, A. P., Duursma, R. A., Luus, K., Mishurov, M., Pak, B., Smith, B., Wang, Y.-P., Yang, X., Crous, K. Y., Drake, J. E., Gimeno, T. E., Macdonald, C. A., Norby, R. J., Power, S. A., Tjoelker, M. G., and Ellsworth, D. S.: Using models to guide field experiments: a priori predictions for the CO2 response of a nutrient- and water-limited native Eucalypt woodland, Glob. Change Biol., 22, 2834–2851, 2016. a
Medlyn, B. E., De Kauwe, M. G., Lin, Y.-S., Knauer, J., Duursma, R. A., Williams, C. A., Arneth, A., Clement, R., Isaac, P., Limousin, J. M., Linderson, M.-L., Meir, P., Martin-StPaul, N., and Wingate, L.: How do leaf and ecosystem measures of water-use efficiency compare?, New Phytol., 216, 758–770, 2017. a, b
Mercado, L. M., Medlyn, B. E., Huntingford, C., Oliver, R. J., Clark, D. B., Sitch, S. A., Zelazowski, P., Kattge, J., Harper, A. B., and Cox, P. M.: Large sensitivity in land carbon storage due to geographical and temporal variation in the thermal response of photosynthetic capacity, New Phytol., 218, 1462–1477, 2018. a
Meyerholt, J. and Zaehle, S.: The role of stoichiometric flexibility in modelling forest ecosystem responses to nitrogen fertilization, New Phytol., 208, 1042–1055, https://doi.org/10.1111/nph.13547, 2015. a, b
Mkhabela, M., Amiro, B., Barr, A., Black, T., Hawthorne, I., Kidston, J., McCaughey, J., Orchansky, A., Nesic, Z., Sass, A., Shashkov, A., and Zha, T.: Comparison of carbon dynamics and water use efficiency following fire and harvesting in Canadian boreal forests, Agr. Forest Meteorol., 149, 783–794, https://doi.org/10.1016/j.agrformet.2008.10.025, 2009. a
NOA: FLUXNET Data Download, available at: http://www.fluxdata.org/DataDownload/default.aspx (last access: 17 February 2015), 2007. a, b, c
Papale, D., Reichstein, M., Aubinet, M., Canfora, E., Bernhofer, C., Kutsch, W., Longdoz, B., Rambal, S., Valentini, R., Vesala, T., and Yakir, D.: Towards a standardized processing of Net Ecosystem Exchange measured with eddy covariance technique: algorithms and uncertainty estimation, Biogeosciences, 3, 571–583, https://doi.org/10.5194/bg-3-571-2006, 2006. a
Parton, W. J., Scurlock, J. M. O., Ojima, D. S., Gilmanov, T. G., Scholes, R. J., Schimmel, D. S., Kirchner, T., Menaut, J. C., Seastedt, T., Moya, E. G., Kamnalrut, A., and Kinyamario, J. I.: Observations and modelling of biomass and soil organic matter dynamics for the grassland biome worldwide, Global Biogeochem. Cy., 7, 785–809, 1993. a
Peng, J., Dan, L., and Huang, M.: Sensitivity of Global and Regional Terrestrial Carbon Storage to the Direct CO2 Effect and Climate Change Based on the CMIP5 Model Intercomparison, PLOS ONE, 9, 1–17, https://doi.org/10.1371/journal.pone.0095282, 2014. a
Peñuelas, J., Poulter, B., Sardans, J., Ciais, P., van der Velde, M., Bopp, L., Boucher, O., Godderis, Y., Hinsinger, P., Llusia, Joan Nardin, E., Vicca, S., Obersteiner, M., and Janssens, I. A.: Human-induced nitrogen–phosphorus imbalances alter natural and managed ecosystems across the globe, Nat. Commun., 4, 2934, https://doi.org/10.1038/ncomms3934, 2013. a
Prentice, I. C., Liang, X., Medlyn, B. E., and Wang, Y.-P.: Reliable, robust and realistic: the three R's of next-generation land-surface modelling, Atmos. Chem. Phys., 15, 5987-6005, https://doi.org/10.5194/acp-15-5987-2015, 2015. a
Raddatz, T. J., Reick, C. H., Knorr, W., Kattge, J., Roeckner, E., Schnur, R., Schnitzler, K.-G., Wetzel, P., and Jungclaus, J.: Will the tropical land biosphere dominate the climate–carbon cycle feedback during the twenty-first century?, Clim. Dynam., 29, 565–574, https://doi.org/10.1007/s00382-007-0247-8, 2007. a
Rebmann, C., Anthoni, P., E., F., Göckede, M., Mangold, A., Subke, J.-A., Thomas, C., Wichura, B., Schulze, E.-D., Tenhunen, J. D., and Foken, T.: Carbon Budget of a Spruce Forest Ecosystem, in: Biogeochemistry of Forested Catchments in a Changing Environment, edited by: Matzner, E., Springer, 143–159, https://doi.org/10.1007/978-3-662-06073-5_8, 2004. a
Reed, S. C., Townsend, A. R., Taylor, P. G., and Cleveland, C. C.: Phosphorus Cycling in Tropical Forests Growing on Highly Weathered Soils, in: Phosphorus in Action Biological Processes in Soil Phosphorus Cycling, edited by: Bünemann, E., Oberson, A., and Frossard, E., Springer Berlin Heidelberg, Berlin, Heidelberg, 339–369, https://doi.org/10.1007/978-3-642-15271-9, 2011. a
Reichstein, M., Falge, E., Baldocchi, D., Papale, D., Aubinet, M., Berbigier, P., Bernhofer, C., Buchmann, N., Gilmanov, T., Granier, A., Grünwald, T., Havránková, K., Ilvesniemi, H., Janous, D., Knohl, A., Laurila, T., Lohila, A., Loustau, D., Matteucci, G., Meyers, T., Miglietta, F., Ourcival, J.-M., Pumpanen, J., Rambal, S., Rotenberg, E., Sanz, M., Tenhunen, J., Seufert, G., Vaccari, F., Vesala, T., Yakir, D., and Valentini, R.: On the separation of net ecosystem exchange into assimilation and ecosystem respiration: review and improved algorithm, Glob. Change Biol., 11, 1424–1439, https://doi.org/10.1111/j.1365-2486.2005.001002.x, 2005. a
Roeckner, E., Tompkins, A., Bäuml, G., Bonaventura, L., Brokopf, R., Esch, M., Giorgetta, M., Hagemann, S., Kirchner, I., Kornblueh, L., Manzini, E., Rhodin, E., Schlese, U., and Schulzweida, U.: The atmospheric general circulation model ECHAM5 – Part I: Model description, Tech. Rep. 349, Max Planck Institute for Meteorology, Hamburg, 2003. a
Roupsard, O., Bonnefond, J.-M., Irvine, M., Berbigier, P., Nouvellon, Y., Dauzat, J., Taga, S., Hamel, O., Jourdan, C., Saint-André, L., Mialet-Serra, I., Labouisse, J.-P., Epron, D., Joffre, R., Braconnier, S., Rouzière, A., Navarro, M., and Bouillet, J.-P.: Partitioning energy and evapo-transpiration above and below a tropical palm canopy, Agr. Forest Meteorol., 139, 252–268, https://doi.org/10.1016/j.agrformet.2006.07.006, 2006. a
Saltelli, A., Chan, K., and Scott, E. M.: Sensitivity Analysis, John Wiley & Sons Ltd., Chichester, New York, 2000. a, b
Sanz, M., Carrara, A., Gimeno, C., Bucher, A., and Lopez, R.: Effects of a dry and warm summer conditions on CO2 and energy fluxes from three Mediterranean ecosystems, Geophys. Res. Abstr., 6, 3239–3239, 2004. a
Saxton, K. E. and Rawls, W. J.: Soil Water Characteristic Estimates by Texture and Organic Matter for Hydrologic Solutions, Soil Sci. Soc. Am. J., 70, 1569–1578, 2006. a
Scherer-Lorenzen, M., Schulze, E.-D., Don, A., Schumacher, J., and Weller, E.: Exploring the functional significance of forest diversity: A new long-term experiment with temperate tree species (BIOTREE), Perspect. Plant Ecol., 9, 53–70, https://doi.org/10.1016/j.ppees.2007.08.002, 2007. a
Schmid, H. P., Grimmond, C. B., Cropley, F., Offerle, B., and Su, H.-B.: Measurements of CO2 and energy fluxes over a mixed hardwood forest in the mid-western United States, Agr. Forest Meteorol., 103, 357–374, https://doi.org/10.1016/S0168-1923(00)00140-4, 2000. a
Scott, R. L., Jenerette, G. D., Potts, D. L., and Huxman, T. E.: Effects of seasonal drought on net carbon dioxide exchange from a woody-plant-encroached semiarid grassland, J. Geophys. Res.-Biogeo., 114, G04004, https://doi.org/10.1029/2008JG000900, 2009. a
Shinozaki, K., Yoda, K., Hozumi, K., and Kira, T.: A quantitative analysis of the plant form – the pipe model theory, Japanese Journal of Ecology, 14, 98–104, 1964. a
Sitch, S., Friedlingstein, P., Gruber, N., Jones, S. D., Murray-Tortarolo, G., Ahlström, A., Doney, S. C., Graven, H., Heinze, C., Huntingford, C., Levis, S., Levy, P. E., Lomas, M., Poulter, B., Viovy, N., Zaehle, S., Zeng, N., Arneth, A., Bonan, G., Bopp, L., Canadell, J. G., Chevallier, F., Ciais, P., Ellis, R., Gloor, M., Peylin, P., Piao, S. L., Le Quéré, C., Smith, B., Zhu, Z., and Myneni, R.: Recent trends and drivers of regional sources and sinks of carbon dioxide, Biogeosciences, 12, 653–679, https://doi.org/10.5194/bg-12-653-2015, 2015. a
Sitch, S. A., Smith, B., Prentice, I. C., Arneth, A., Bondeau, A., Cramer, W., Kaplan, J. O., Levis, S., Lucht, W., Sykes, M. T., and Venevsky, S.: Evaluation of ecosystem dynamics, plant geography and terrestrial carbon cycling in the LPJ Dynamic Global Vegetation Model, Glob. Change Biol., 9, 161–185, 2003. a, b, c, d
Suni, T., Rinne, J., Reissell, A., Altimir, N., Keronen, P., Rannik, Ü., Dal Maso, M., Kulmala, M., and Vesala, T.: Long-term measurements of surface fluxes above a Scots pine forest in Hyytiälä, southern Finland, 1996–2001, Boreal Environ. Res., 8, 287–301, 2003. a
Swann, A. L. S., Hoffman, F. M., Koven, C. D., and Randerson, J. T.: Plant responses to increasing CO2 reduce estimates of climate impacts on drought severity, P. Natl. Acade. Sci. USA, 113, 10019–10024, https://doi.org/10.1073/pnas.1604581113, 2016. a
Tedeschi, V., Rey, A., Manca, G., Valentini, R., Jarvis, P. G., and Borghetti, M.: Soil respiration in a Mediterranean oak forest at different developmental stages after coppicing, Glob. Change Biol., 12, 110–121, https://doi.org/10.1111/j.1365-2486.2005.01081.x, 2006. a
Thornton, P., Lamarque, J.-F., Rosenbloom, N. A., and Mahowald, N. M.: Influence of carbon-nitrogen cycle coupling on land model response to CO2 fertilization and climate variability, Global Biogeochem. Cy., 21, GB4018, https://doi.org/10.1029/2006GB002868, 2007. a
Thum, T., Zaehle, S., Köhler, P., Aalto, T., Aurela, M., Guanter, L., Kolari, P., Laurila, T., Lohila, A., Magnani, F., Van Der Tol, C., and Markkanen, T.: Modelling sun-induced fluorescence and photosynthesis with a land surface model at local and regional scales in northern Europe, Biogeosciences, 14, 1969–1987, https://doi.org/10.5194/bg-14-1969-2017, 2017. a
Tirone, G., Dore, S., Matteucci, G., Greco, S., and Valentini, R.: Evergreen Mediterranean Forests. Carbon and Water Fluxes, Balances, Ecological and Ecophysiological Determinants, in: Fluxes of Carbon, Water and Energy of European Forests, edited by: Valentini, R., Springer Berlin Heidelberg, Berlin, Heidelberg,125–149, https://doi.org/10.1007/978-3-662-05171-9_7, 2003. a
Urbanski, S., Barford, C., Wofsy, S., Kucharik, C., Pyle, E., Budney, J., McKain, K., Fitzjarrald, D., Czikowsky, M., and Munger, J. W.: Factors controlling CO2 exchange on timescales from hourly to decadal at Harvard Forest, J. Geophys. Res.-Biogeo., 112, G02020, https://doi.org/10.1029/2006JG000293, 2007. a
Vargas, R., Sonnentag, O., Abramowitz, G., Carrara, A., Chen, J. M., Ciais, P., Correia, A., Keenan, T. F., Kobayashi, H., Ourcival, J.-M., Papale, D., Pearson, D., Pereira, J. S., Piao, S., Rambal, S., and Baldocchi, D. D.: Drought Influences the Accuracy of Simulated Ecosystem Fluxes: A Model-Data Meta-analysis for Mediterranean Oak Woodlands, Ecosystems, 16, 749–764, https://doi.org/10.1007/s10021-013-9648-1, 2013. a
Vicca, S., Luyssaert, S., Peñuelas, J., Campioli, M., Chapin III, F. S., Ciais, P., Heinemeyer, A., Hogberg, P., Kutsch, W. L., Law, B. E., Malhi, Y., Papale, D., Piao, S. L., Reichstein, M., Schulze, E. D., and Janssens, I. A.: Fertile forests produce biomass more efficiently, Ecol. Lett., 15, 520–526, 2012. a, b, c, d
Viovy, N.: CRU-NCEP dataset, v7, available at: https://vesg.ipsl.upmc.fr/thredds/catalog/store/p529viov/cruncep/V7_1901_2015/catalog.html (last access: 27 June 2017), 2016. a
Vitousek, P. M. and Howarth, R. W.: Nitrogen limitation on land and in the sea – how it can occur, Biogeochem., 13, 87–115, 1991. a
Vitousek, P. M., Porder, S., Houlton, B. Z., and Chadwick, O. A.: Terrestrial phosphorus limitation: mechanisms, implications, and nitrogen–phosphorus interactions, Ecol. Appl., 20, 5–15, https://doi.org/10.1890/08-0127.1, 2010. a, b
Walker, T. W. and Syers, J. K.: The fate of phosphorus during pedogenesis, Geoderma, 15, 1–19, https://doi.org/10.1016/0016-7061(76)90066-5, 1976. a
Wang, Y. P., Law, R. M., and Pak, B.: A global model of carbon, nitrogen and phosphorus cycles for the terrestrial biosphere, Biogeosciences, 7, 2261–2282, https://doi.org/10.5194/bg-7-2261-2010, 2010. a, b, c, d
Wårlind, D., Smith, B., Hickler, T., and Arneth, A.: Nitrogen feedbacks increase future terrestrial ecosystem carbon uptake in an individual-based dynamic vegetation model, Biogeosciences, 11, 6131–6146, https://doi.org/10.5194/bg-11-6131-2014, 2014. a
White, R. E.: Principles and Practice of Soil Science The soil as a Natural Resource, vol. 32, Blackwell Publishing, Malden, 4th Edn., https://doi.org/10.1177/0340035206070163, 2006. a
Wohlfahrt, G., Anderson-Dunn, M., Bahn, M., Balzarolo, M., Berninger, F., Campbell, C., Carrara, A., Cescatti, A., Christensen, T., Dore, S., Eugster, W., Friborg, T., Furger, M., Gianelle, D., Gimeno, C., Hargreaves, K., Hari, P., Haslwanter, A., Johansson, T., Marcolla, B., Milford, C., Nagy, Z., Nemitz, E., Rogiers, N., Sanz, M. J., Siegwolf, R. T., Susiluoto, S., Sutton, M., Tuba, Z., Ugolini, F., Valentini, R., Zorer, R., and Cernusca, A.: Biotic, Abiotic, and Management Controls on the Net Ecosystem CO2 Exchange of European Mountain Grassland Ecosystems, Ecosystems, 11, 1338–1351, https://doi.org/10.1007/s10021-008-9196-2, 2008a. a
Wohlfahrt, G., Hammerle, A., Haslwanter, A., Bahn, M., Tappeiner, U., and Cernusca, A.: Seasonal and inter-annual variability of the net ecosystem CO2 exchange of a temperate mountain grassland: Effects of weather and management, J. Geophys. Res.-Atmos., 113, D08110, https://doi.org/10.1029/2007JD009286, 2008b. a
Wramneby, A., Smith, B., Zaehle, S., and Sykes, M. T.: Parameter uncertainties in the modelling of vegetation dynamics – Effects on tree community structure and ecosystem functioning in European forest biomes, Ecol. Model., 216, 277–290, 2008. a
Yang, X., Post, W. M., Thornton, P. E., and Jain, A.: The distribution of soil phosphorus for global biogeochemical modeling, Biogeosciences, 10, 2525–2537, https://doi.org/10.5194/bg-10-2525-2013, 2013. a, b
Yang, X., Thornton, P. E., Ricciuto, D. M., and Post, W. M.: The role of phosphorus dynamics in tropical forests – a modeling study using CLM-CNP, Biogeosciences, 11, 1667–1681, https://doi.org/10.5194/bg-11-1667-2014, 2014. a, b, c, d, e, f
Zaehle, S. and Dalmonech, D.: Carbon–nitrogen interactions on land at global scales: current understanding in modelling climate biosphere feedbacks, Curr. Opin. Env. Sust., 3, 311–320, 2011. a
Zaehle, S. and Friend, A. D.: Carbon and nitrogen cycle dynamics in the O-CN land surface model: 1. Model description, site-scale evaluation, and sensitivity to parameter estimates, Global Biogeochem. Cy., 24, GB1005, https://doi.org/10.1029/2009GB003521, 2010. a, b, c, d, e, f, g, h, i, j, k, l, m, n, o
Zaehle, S., Sitch, S. A., Smith, B., and Hatterman, F.: Effects of parameter uncertainties on the modeling of terrestrial biosphere dynamics, Global Biogeochem. Cy., 19, GB3020, https://doi.org/10.1029/2004GB002395, 2005. a, b, c, d
Zaehle, S., Friedlingstein, P., and Friend, A. D.: Terrestrial nitrogen feedbacks may accelerate future climate change, Geophys. Res. Lett., 37, L01401, https://doi.org/10.1029/2009GL041345, 2010. a
Zaehle, S., Ciais, P., Friend, A. D., and Prieur, V.: Carbon benefits of anthropogenic reactive nitrogen offset by nitrous oxide emissions, Nat. Geosci., 4, 601–605, 2011. a
Zaehle, S., Medlyn, B. E., De Kauwe, M. G., Walker, A. P., Dietze, M. C., Hickler, T., Luo, Y., Wang, Y.-P., El-Masri, B., Thornton, P., Jain, A., Wang, S., Warlind, D., Weng, E., Parton, W., Iversen, C. M., Gallet-Budynek, A., McCarthy, H., Finzi, A., Hanson, P. J., Prentice, I. C., Oren, R., and Norby, R. J.: Evaluation of 11 terrestrial carbon–nitrogen cycle models against observations from two temperate Free-Air CO2 Enrichment studies, New Phytol., 202, 803–822, https://doi.org/10.1111/nph.12697, 2014. a, b
Zerihun, A., McKenzie, B. A., and Morton, J. D.: Photosynthate costs associated with the utilization of different nitrogen–forms: influence on the carbon balance of plants and shoot–root biomass partitioning, New Phytol., 138, 1–11, 1998. a
Zheng, M., Zhou, Z., Luo, Y., Zhao, P., and Mo, J.: Global pattern and controls of biological nitrogen fixation under nutrient enrichment: A meta-analysis, Glob. Change Biol., 25, 3018–3030, 2019. a