the Creative Commons Attribution 4.0 License.
the Creative Commons Attribution 4.0 License.
 | 01 Apr 2020
COSMO-BEP-Tree v1.0: a coupled urban climate model with explicit representation of street trees
Gianluca Mussetti
Stephan Henne
Jonas Allegrini
E. Scott Krayenhoff
Sebastian Schubert
Christian Feigenwinter
Roland Vogt
Andreas Wicki
Jan Carmeliet
Street trees are more and more regarded as an effective measure to reduce excessive heat in urban areas. However, the vast majority of mesoscale urban climate models do not represent street trees in an explicit manner and, for example, do not take the important effect of shading by trees into account. In addition, urban canopy models that take interactions of trees and urban fabrics directly into account are usually limited to the street or neighbourhood scale and hence cannot be used to analyse the citywide effect of urban greening. In order to represent the interactions between street trees, urban elements and the atmosphere in realistic regional weather and climate simulations, we coupled the Building Effect Parameterisation with Trees (BEP-Tree) vegetated urban canopy model and the Consortium for Small-scale Modeling (COSMO) mesoscale weather and climate model. The performance and applicability of the coupled model, named COSMO-BEP-Tree, are demonstrated over the urban area of Basel, Switzerland, during the heatwave event of June–July 2015. Overall, the model compared well with measurements of individual components of the surface energy balance and with air and surface temperatures obtained from a flux tower, surface stations and satellites. Deficiencies were identified for nighttime air temperature and humidity, which can mainly be traced back to limitations in the simulation of the nighttime stable boundary layer in COSMO. The representation of street trees in the coupled model generally improved the agreement with observations. Street trees produced large changes in simulated sensible and latent heat flux, and wind speed. Within the canopy layer, the presence of street trees resulted in a slight reduction in daytime air temperature and a very minor increase in nighttime air temperature. The model was found to realistically respond to changes in the parameters defining the street trees: leaf area density and stomatal conductance. Overall, COSMO-BEP-Tree demonstrated the potential of (a) enabling city-wide studies on the cooling potential of street trees and (b) further enhancing the modelling capabilities and performance in urban climate modelling studies.
- Article
(4948 KB) -
Supplement
(4344 KB) - BibTeX
- EndNote


Street trees – trees located in street canyons – and urban vegetation in general are more and more regarded as an effective measure to reduce excessive heat conditions in urban areas (e.g. Shashua-Bar et al., 2009; Armson et al., 2012; Coutts et al., 2016; Tan et al., 2016; Gunawardena et al., 2017; Manickathan et al., 2018). Excessive heat conditions are typically caused by the combination of regional-scale hot weather (heatwave) situations and the urban heat island (UHI) effect. The UHI refers to the air temperature increase in urban areas compared to their rural surroundings, and it is caused by the alteration of the surface energy balance due to the presence of man-made structures and activities (Oke et al., 2017). Climate change is expected to further accentuate the magnitude and frequency of excessive heat conditions in cities with potentially severe impacts on human health, energy consumption, air pollution and urban ecology (Rosenzweig et al., 2018).
Street trees impact the urban atmosphere through radiative, heat, moisture and flow interactions (Oke, 1989). Street trees intercept radiation through their foliage canopy. By intercepting the direct short-wave (solar) radiation, they reduce the temperature of underlying surfaces (Armson et al., 2012). Additionally, street trees also intercept radiation coming from the canyon surfaces, such as the long-wave radiation emitted by warm wall and street surfaces. At night, this effect can actually reduce the radiative cooling of wall and street surfaces (Bowler et al., 2010). Through tree transpiration, leaf surface temperature is reduced, resulting in the extraction of sensible heat from the air (Green, 1993). Finally, the tree foliage extracts momentum from the mean flow, contributing to turbulent kinetic energy (TKE) generation due to wake production and TKE dissipation due to the small scale of the leaves (Wilson and Shaw, 1977).
The climatic impact of urban vegetation has been investigated in numerous previous studies from the scale of the single street canyon to that of the entire urban region (e.g. Gromke et al., 2015; Ng et al., 2012; De Munck et al., 2018). However, studies on entire urban regions primarily focused on low vegetation, representing low height gardens and green roofs (Wang et al., 2013; De Munck et al., 2018). Street trees, instead, have generally only been represented in a separate natural tile (e.g. Schubert and Grossman-Clarke, 2013; Li and Norford, 2016). This approach precluded considering any interactions between trees and urban surfaces in a street canyon, such as shading and sheltering effects (Krayenhoff et al., 2014, 2015). Other studies employed somewhat more sophisticated methods but still neglect some of the critical interactions between trees, canyon surface and airflow (Thatcher and Hurley, 2012).
The very first example of a weather and climate model with an integrated representation of street trees was developed by Dupont et al. (2004). They built an urban canopy model, called DA-SM2-U, for the Penn State–NCAR fifth-generation mesoscale model (MM5; Grell et al., 1994). DA-SM2-U was based on the multi-layer urban canopy concept where a drag-force approach is used to represent the dynamic and turbulent effects of buildings and vegetation. In the meantime, the Weather Research and Forecasting model (WRF; Skamarock et al., 2005) has replaced MM5 and, to the authors' best knowledge, DA-SM2-U was not ported to WRF. Lee and Park (2008) developed an urban canopy model with an explicit representation of street trees named Vegetated Urban Canopy Model (VUCM). VUCM adopts a single-layer urban canopy concept (i.e. the urban canopy is represented by only one model layer), where street trees are represented as a single tree canopy characterised by canopy cover fraction, mean height and mean leaf area density. Lee (2011) further developed VUCM by including a grass-covered soil surface within the canyon. Lee et al. (2016) incorporated VUCM into WRF and performed an application over Seoul, South Korea. VUCM was also used by Loughner et al. (2012), coupled with WRF, to simulate the role of street trees in Washington, DC, USA. Wang et al. (2018) incorporated a representation of the radiative effects of street trees (Wang, 2014) into the single-layer urban canopy model of WRF (F. Chen et al., 2011). They simulated the impact of street trees over the contiguous United States using a 20 km model resolution. Krayenhoff et al. (2018) used WRF, coupled with the single-layer urban canopy model, to simulate the impact of urban adaptation strategies (including street tree planting) for air temperature during contemporary and future climate over the contiguous United States. A couple of other urban canopy models (UCMs) with explicit representation of street trees have been developed (Ryu et al., 2016; Redon et al., 2017) but, to the authors' best knowledge, not yet coupled with a mesoscale weather and climate model.
The literature review revealed a number of major limitations in the models used to study the city-wide impact of street trees. Several studies neglected some the interactions between street trees and urban fabrics. For example, the exchange of long-wave radiation between street trees and urban fabrics is often neglected (Wang et al., 2018; Krayenhoff et al., 2018), together with the impact of street trees on the flow field. Neglecting long-wave radiation exchanges and impacts of trees on the flow field may overestimate their cooling potential. Another simplistic assumption concerns the representation of tree shading, which was in some cases independent of the solar direction (Dupont et al., 2004; Lee and Park, 2008).
A second common assumption concerns the characterisation of street trees in model applications. In all the previous studies, no real data on the location, density height and species of street trees were used. Instead, a homogeneous distribution of street trees has often been assumed (Dupont et al., 2004; Loughner et al., 2012). The increasing availability of detailed street tree datasets (e.g. Alonzo et al., 2014; Konarska et al., 2016) now gives a chance to represent the distribution of street tree characteristics more realistically during model applications.
Finally, the majority of the studies did not include a comprehensive evaluation of their model. Typically, only the underlying urban canopy model used in the coupled model has been evaluated offline. Online model evaluation against surface stations, flux towers and satellite observations are needed to better understand the model performance and to identify future lines of development.
Motivated by the great potential of using an integrated model to study the urban climate impact of street trees in a city-wide manner, the objective of this study is two-fold. First, we aim to document the development of an urban climate model with explicit representation of street trees, featuring a two-way coupling between the Building Effect Parameterisation with Trees (BEP-Tree) vegetated urban canopy model (Krayenhoff, 2014; Krayenhoff et al., 2020) and the Consortium for Small-scale Modeling (COSMO) Community Land Model (CLM) (COSMO hereinafter; Rockel et al., 2008). The coupled model, named COSMO-BEP-Tree, represents the multiple interactions between street trees, urban fabrics and the atmosphere in a comprehensive way considering the exchange of heat, moisture and momentum, and the transfer of short- and long-wave radiation. COSMO-BEP-Tree enables city-wide studies on the cooling potential of street trees in comparison, or in combination, with other UHI mitigation measures (e.g. albedo changes). Additionally, it has the potential to enhance the performance in urban climate modelling studies by a more realistic representation of the surface and its interaction with the atmosphere. In order to facilitate the application, the model comes with a tool to pre-process the additional inputs required for COSMO-BEP-Tree, such as street tree datasets or a 3-D city model.
Second, we present an application and comprehensive evaluation of COSMO-BEP-Tree over the transnational urban agglomeration of Basel (Switzerland, Germany and France) during a heatwave event in June–July 2015. The evaluation makes use of the extensive measurement infrastructure for urban climate studies available in Basel (Feigenwinter et al., 2018; Wicki et al., 2018), including an urban flux tower and a network of surface stations, and additionally uses land surface temperature (LST) observations from satellite. In order to verify the model's response to the parameters that define the street trees, a sensitivity analysis is also presented.
We remark that this study only aims to document the development and evaluation of COSMO-BEP-Tree. Analyses on the role of street trees in urban climate and on their potential for mitigating excessive heat conditions are out of the scope of this paper and will be presented in follow-up studies. Although the focus of this study is on street trees, it is important to consider that other components of the so-called urban forest, such as trees in parks and private gardens as well as peri-urban trees, are also likely to have a remarkable impact on the urban climate.
The paper is structured as follows. The two model components (COSMO and BEP-Tree), together with the coupling strategy and the pre-processor, are described in Sect. 2. Sections 3 and 4 present the model evaluation and sensitivity. In Sects. 5 and 6 future work and conclusions are discussed.
2.1 COSMO model
The COSMO is a non-hydrostatic limited-area atmospheric prediction model (COSMO, 2019). It has been designed for operational numerical weather prediction, regional climate simulation and other applications at the mesoscale (weather phenomena of sizes between about 1 km and a few hundred kilometres). COSMO evolved from the operational weather forecast Lokal Modell (LM) of the German Weather Service (Steppeler et al., 2003) and has been developed by a consortium of weather services in Europe and by the CLM community for climate applications (CCLM-Community, 2020). The regional climate model version of COSMO, called COSMO-CLM, includes modifications allowing the application on timescales up to centuries (Rockel et al., 2008). These modifications comprise a representation of phenological cycles as well as externally prescribed, time-dependent atmospheric CO2 concentrations.
The COSMO model is based on the thermohydrodynamical equations describing non-hydrostatic compressible flow in a moist atmosphere. A variety of physical processes are taken into account by parameterisation schemes: cloud formation and precipitation, moist and shallow convection, subgrid-scale turbulence, radiation and land surface exchanges (see Fig. 1a). At the convection-resolving model resolution used in this study, the parameterisations for subgrid-scale clouds and moist convection are switched off. Additional information on the governing equations and physical parameterisations can be found in the model documentation (COSMO, 2019).
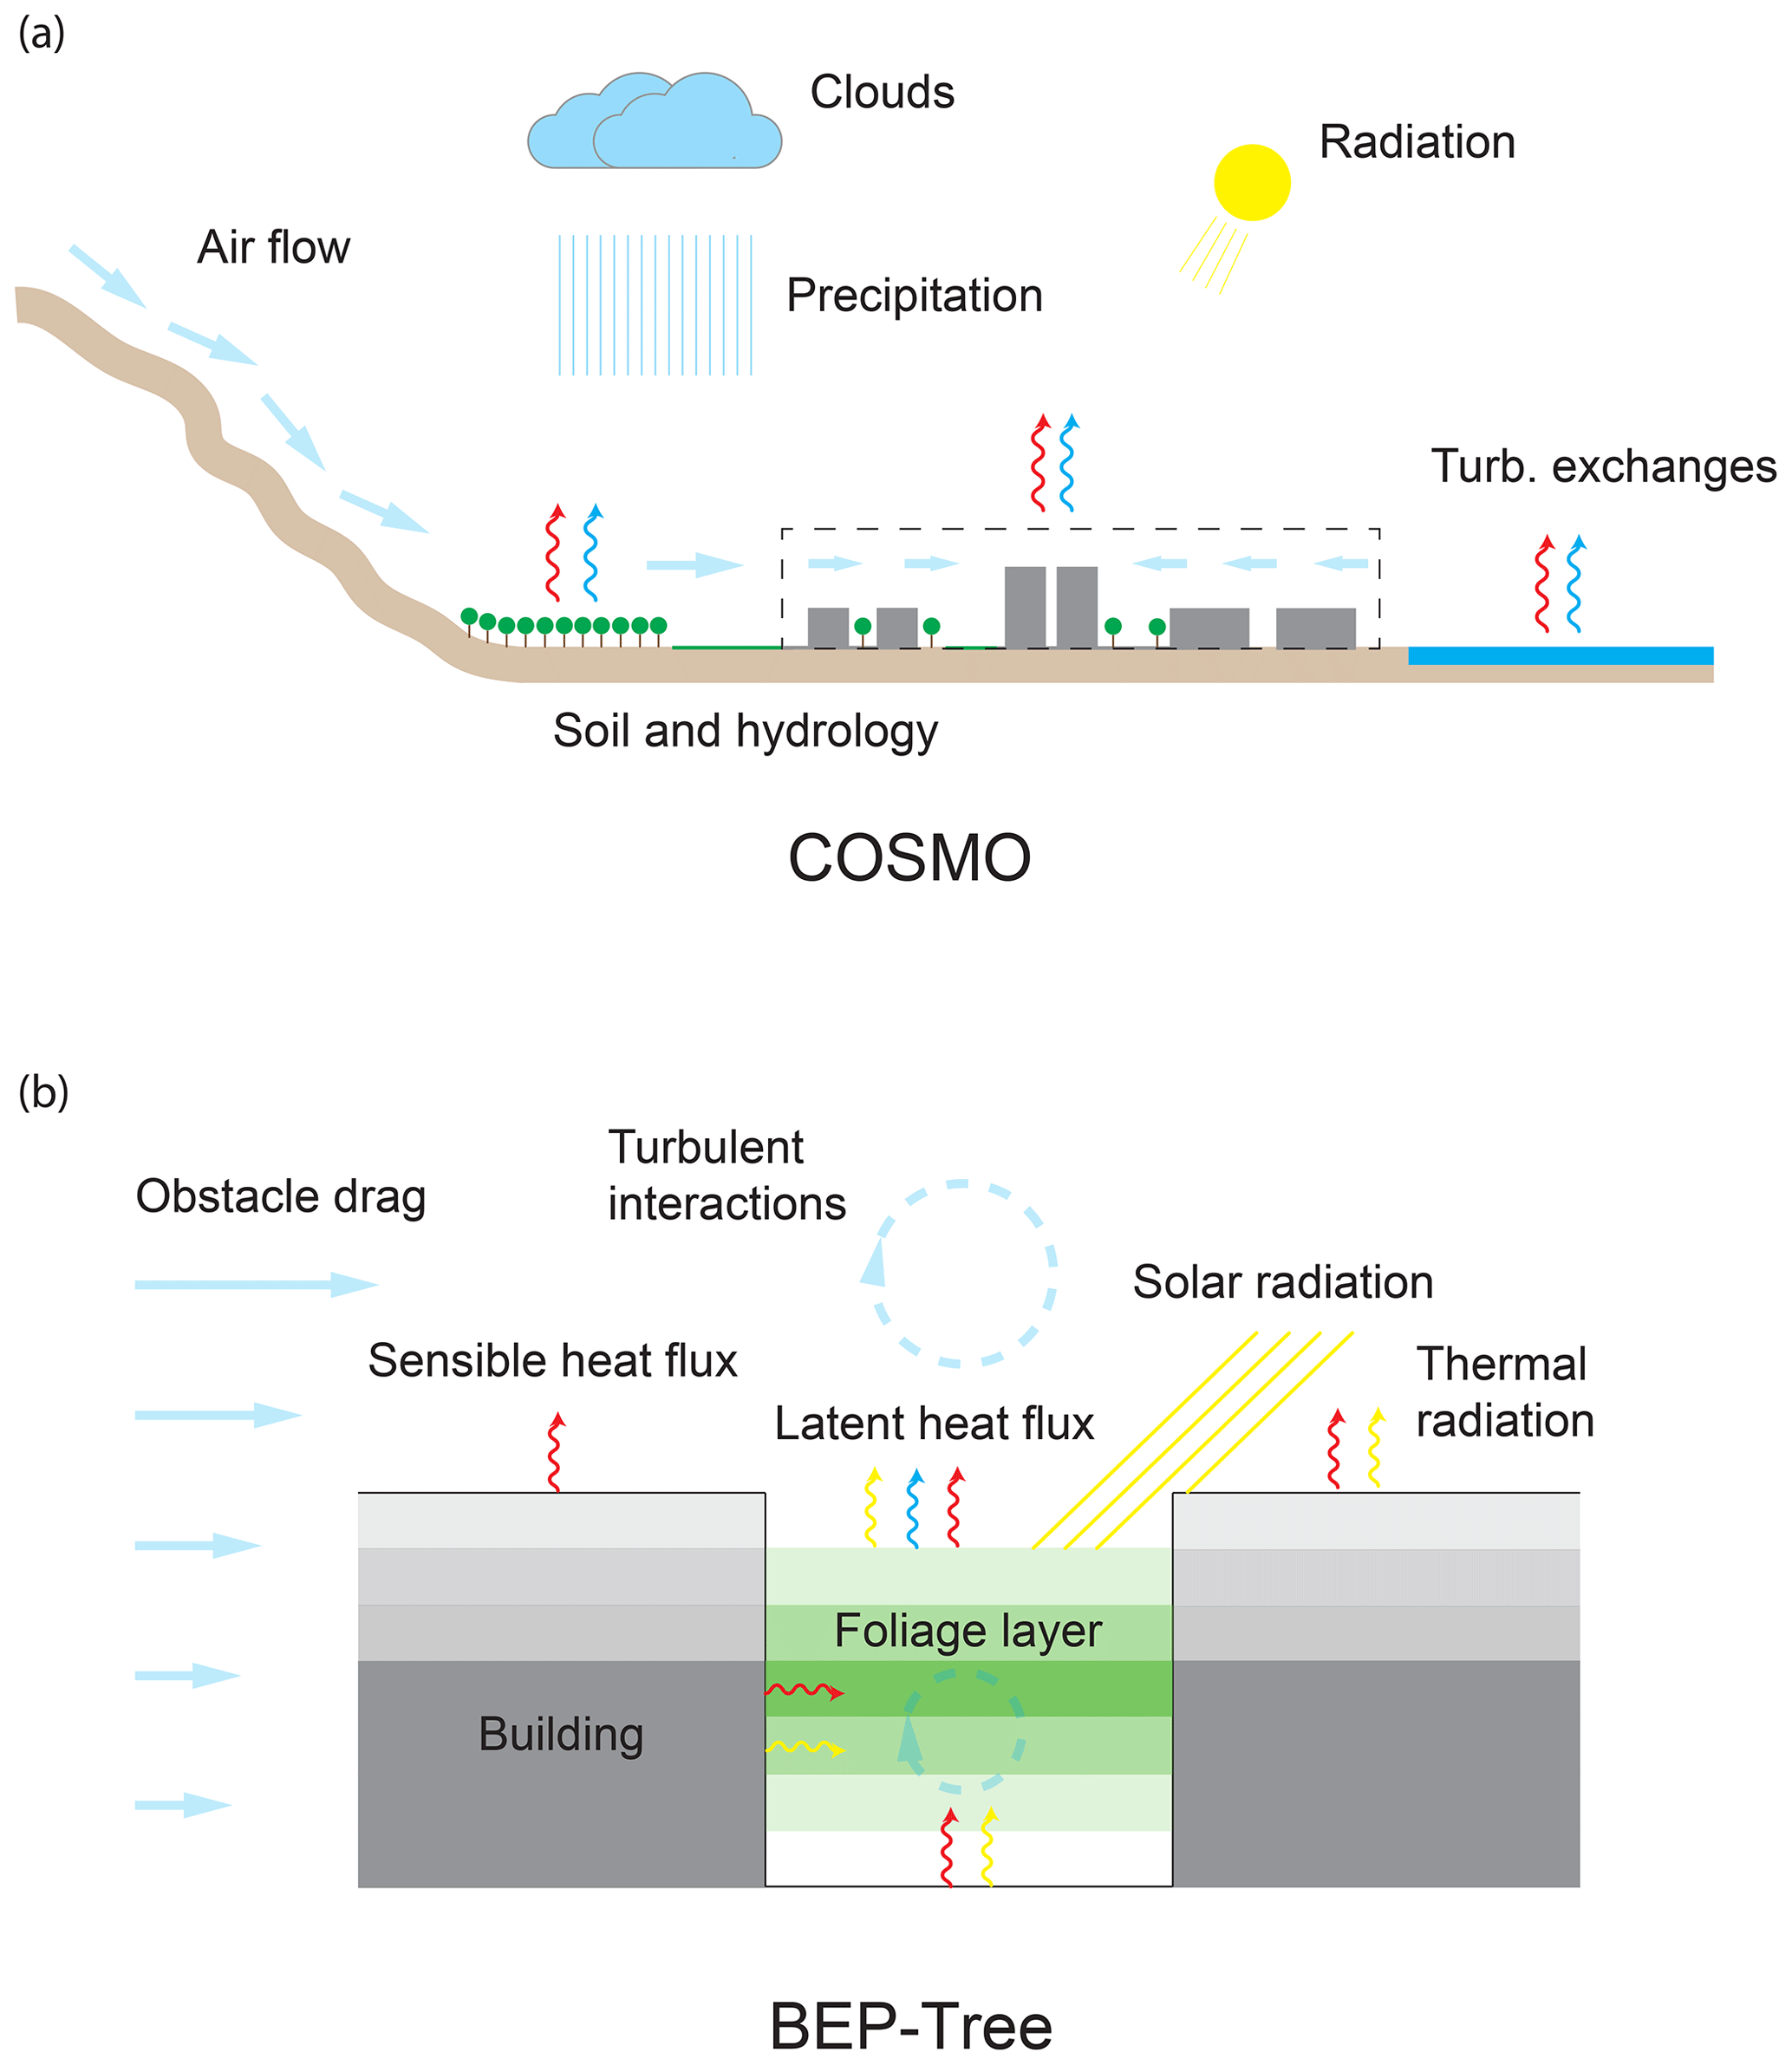
Figure 1Schematic of the key processes represented by (a) COSMO and (b) BEP-Tree for urban climate simulations. Details about the interactions between radiation and the foliage layers (e.g. radiation absorption and scattering) are not represented here. Please refer to Sect. 2.1 and 2.2 for a comprehensive description of the models.
Recently, urban parameterisations of different degrees of complexity have been developed for and coupled with the COSMO model (Trusilova et al., 2016). The TERRA-URB urban parameterisation (Wouters et al., 2015, 2016) employs a simple but efficient approach by representing the urban canopy using a limited number of parameters (so-called bulk approach). The Town Energy Balance (TEB) implementation of Trusilova et al. (2013) represents an intermediate level of complexity with a single-layer urban canopy model. Finally, the multi-layer urban canopy model DCEP (double-canyon effect parameterisation) employs the most physically based but input-demanding representation of the urban canopy by solving the radiation exchange in a realistic multi-layer canyon configuration (Schubert et al., 2012).
Applications of these models included studies of the impact of climate change on cities (Grossman-Clarke et al., 2017; Wouters et al., 2017), the influence of green areas and low-albedo materials (Schubert and Grossman-Clarke, 2013) and the intra-urban climate variability (Mussetti et al., 2020).
2.2 Building Effect Parameterisation with Trees (BEP-Tree)
BEP-Tree is a multi-layer urban canopy model with explicit representation of trees and their interaction with the street canyon (Krayenhoff, 2014; Krayenhoff et al., 2020). Building on the geometry of the existing multi-layer urban canopy model BEP (Martilli et al., 2002), Krayenhoff et al. (2014) included the effects of tree foliage on the radiative exchange within the street canyon.
The basic geometry is a two-dimensional canyon with vertical leaf area density profiles and probabilistic variation of building height (see Fig. 1b). Tree foliage is permitted both between and above buildings, allowing the representation of street trees as well as trees overhanging buildings.
Ray tracing is used to determine the receipt of direct short-wave irradiance by building and foliage elements. View factors for long-wave and short-wave diffuse radiation exchange are computed once at the start of the simulation using a Monte Carlo ray-tracing approach and used thereafter to calculate multiple reflections between all urban fabrics. Interception of radiation by tree foliage is modelled with the Beer–Lambert–Bouguer law:
where ΔVi is the reduction in intensity of the ray due to the tree foliage (W m−2), ri is the initial intensity of the ray (W m−2), K is the foliage extinction coefficient (–), LD is the leaf area density (m2 m−3), Ω is the foliage clumping index (–), Δs is the 2-D ray step size (m), and fi is the ratio of 3-D (actual) to 2-D (model) distance travelled by the ray (actual 3-D paths of all rays are mapped to the 2-D domain, depending on the canyon orientation; Krayenhoff et al., 2014).
BEP-Tree includes a parameterisation of building and tree foliage effects on the airflow (Martilli et al., 2002; Santiago and Martilli, 2010; Krayenhoff et al., 2015). The parameterisation introduces (a) a sink term for momentum to account for obstacle drag, (b) modifications of turbulence length scales by building interactions and (c) enhanced dissipation of turbulent kinetic energy due to the small scale of the tree foliage elements. The obstacle drag from tree foliage is determined as
where Sm,i is the sink term for momentum along the coordinate axis i (m s−2), Cdv is the sectional drag coefficient for tree foliage (set to 0.2) (–), U is the horizontal wind speed (m s−1), and is the wind speed component along axis i (m s−1).
Surface energy balance equations for roof, wall and road elements are identical to those in Martilli et al. (2002). For leaf layers, the Penman equation is rearranged to solve for the leaf temperature as in Campbell and Norman (2012). The sensible heat flux, latent heat flux and source of moisture from street trees are determined as
where QH is the sensible heat flux from foliage per unit height (W m−3), cp is the specific heat capacity of air (J mol−1 K−1), gHa is the heat conductance (mol m−2 s−1), Tveg is the temperature of the foliage layer (K), Tair is the air temperature at the height of the foliage layer (K), QE is the latent heat flux from foliage per unit height (W m−3), λ is the latent heat of vaporisation (J mol−1), gs is the vapour stomatal conductance of the leaf (mol m−2 s−1), ga is the vapour boundary-layer conductance of the leaf (mol m−2 s−1), is the change is saturation pressure with temperature given by the Clausius–Clapeyron equation (Stull, 2012) (K−1), es is the saturation vapour pressure (Pa), eair is the vapour pressure in the air (Pa), p is the atmospheric pressure (Pa), Sq is the source term for moisture due to transpiration from foliage (s−1), μw is the molar mass of water (kg mol−1), and ρair is the density of air (kg m−3). Here, we report only those equations that are relevant for the coupling of BEP-Tree with COSMO and for understanding the response to the sensitivity experiments described later. The complete set of equations as well as further details about the model components can be found in Krayenhoff et al. (2014, 2015, 2020), including a recently developed parameterisation for climate impacts of street tree foliage distribution.
The main model inputs to BEP-Tree are (a) atmospheric state variables above the canyon and (b) canyon geometry including vegetation. The former includes the traditional atmospheric variables and radiation fluxes, which can be either provided by a tall tower (offline application) or by a weather model (online application). The canyon geometry inputs include height distribution of buildings, canyon width, thermophysical material properties of active surfaces (wall elements, roof and street) and parameters representing in-canyon vegetation.
Regarding in-canyon vegetation, a vertical profile of leaf area density (LD) needs to be provided for both the canyon and the building columns. LD,can and LD,bld represent the surface area of leaves per unit volume of air (m2 m−3) in the canyon space and in the building space (e.g. in the case of trees overhanging buildings), respectively. Additionally, information on the spatial distribution of the leaves from street trees in the available canyon space needs to be provided. This information is represented by the clumping index Ω as defined by Nilson (1971). The index takes values between 0 and 1, with Ω=1 being the case where the leaves are randomly distributed. Ω encompasses clumping at several scales, from the within-branch to the between-crown scale. Ω is used, together with LD, to account for the fraction of leaves that actively contribute to the radiation exchange. Moreover, Ω is used to represent the aerodynamic sheltering following the approach proposed by Marcolla et al. (2003) and to modulate wake production and TKE dissipation (Krayenhoff, 2014). Ω is always used in combination with LD to compute an “effective leaf area density” defined as LDe=LD Ω.
BEP-Tree has been evaluated in offline mode against measurements in Vancouver, Canada (Krayenhoff, 2014). The evaluation made use of measured fluxes of radiation and turbulent exchange in the inertial sublayer, as well as measurements of air temperature and humidity in the urban canopy layer. The evaluation has been recently extended using measurements of street surface temperature and street-level radiation fluxes from two sites in North America (Krayenhoff et al., 2020).
2.3 COSMO-BEP-Tree
We coupled BEP-Tree to COSMO-CLM model v5.0_clm2.1. The coupling is done through model integration (also called joint coupling by Brandmeyer and Karimi, 2000) and makes use of the interface created by Schubert et al. (2012) for the urban DCEP. The coupling makes use of the tile approach, where mixed proportions of urban and natural surfaces within a grid cell can be considered. Natural surfaces within a urban grid cell represent, for instance, urban parks and peri-urban forests. The surface–atmosphere interactions are calculated independently for the urban and rural tiles and then averaged with respect to the fractional coverage of each tile. BEP-Tree is used to calculate the surface–atmosphere interactions for the urban tile, while the land surface model of COSMO does it for the natural tile (see Sect. 2.1 for further details).
A schematic representation of the coupling is presented in Fig. 2. Before executing COSMO-BEP-Tree, the parameters that characterise the street canyon are estimated for all urban grid cells in the model domain from external input datasets of trees, building geometries and imperviousness. This task is performed by a dedicated pre-processor described in Sect. 2.4. Once all required inputs are generated, the coupled model can be executed. At the first model time step, the urban canopy parameters are used to estimate the view factors for long-wave and diffuse short-wave radiation between each street canyon element (wall, roof, street and foliage layer) including the sky. The view factors are stored in the form of a matrix and applied during the model simulation at each time step. In the case of direct short-wave radiation, the receipt of radiation by each street canyon element is computed online during the simulation using a direct ray-tracing algorithm. Subsequently, the diffuse short-wave radiation, short-wave reflections, and received and emitted long-wave radiation at each street canyon element are estimated using a radiosity approach (making use of the view factor matrices). At this point, the radiation balance at each active surface is available and is used to determine the radiation balance of the entire grid cell in the COSMO model.
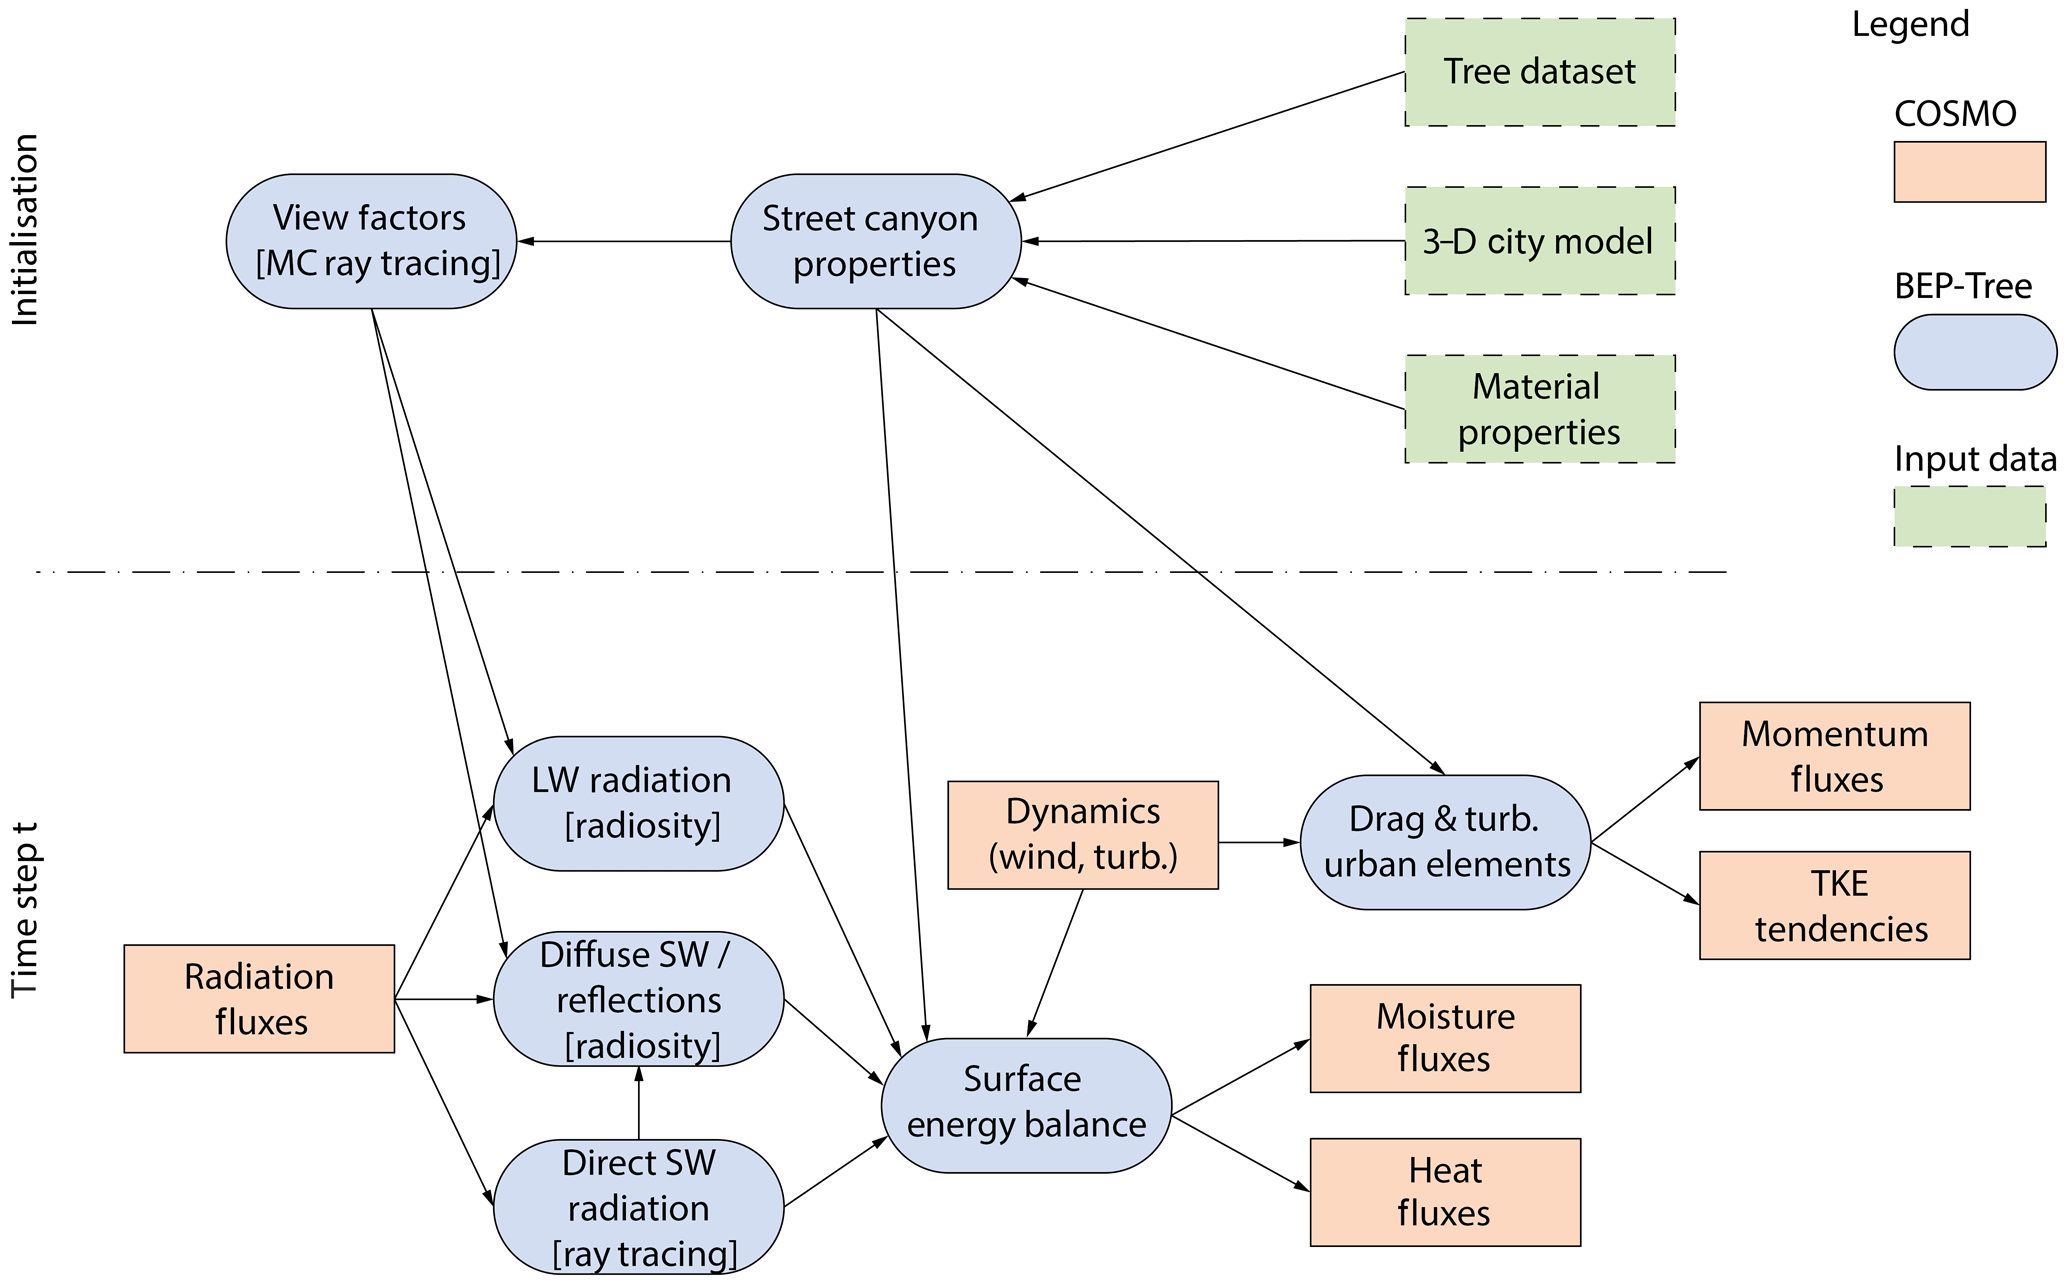
Figure 2Flowchart of the coupling of BEP-Tree with COSMO. Rose-coloured boxes denote quantities of COSMO and blue-coloured boxes of BEP-Tree. Additional input datasets required to run COSMO-BEP-Tree are shown as green-coloured boxes.
The user can specify the frequency at which the radiation exchanges in BEP-Tree are updated. By default, this is set to 0.05 h (3 min), as a compromise between accuracy and computational cost.
The air temperature tendencies (increments) due to sensible heat flux, the momentum tendencies due to obstacle drag and the TKE tendencies are determined for each street canyon element. For the foliage layers, latent heat and moisture fluxes are calculated by solving the leaf energy balance. Although moisture exchange between street trees and the atmosphere is implemented, street trees do not interact with soil moisture content as represented by COSMO's land surface scheme. In other words, a mechanistic interaction between soil moisture and the transpiration of street trees is not included, assuming that the transpiration is never limited by soil water availability. A careful representation of soil moisture in the urban tiles would have required a new urban hydrology scheme, which was beyond the scope of the study. The missing interaction with soil moisture may reduce the model ability to represent variations in transpiration during periods with large changes in soil moisture (Konarska et al., 2016; Asawa et al., 2017). Nevertheless, street trees are less sensitive to variations in soil moisture than short vegetation, thanks to their deeper root system (L. Chen et al., 2011; Asawa et al., 2017).
The radiative coupling between COSMO and BEP-Tree is realised through four bulk radiation parameters: (a) albedo for diffuse short-wave radiation , (b) albedo for direct short-wave radiation , (c) mean emissivity ϵurb and (d) radiative surface temperature Turb. does not change with time, being only dependent on the canyon geometry and on the albedo of individual surface elements, given the assumption of isotropic diffuse radiation exchange. Therefore, it is calculated only once at the beginning of the simulation as
with being the short-wave radiation reflected from all street canyon elements into the sky for the case where the incoming direct short-wave radiation K⇓ is zero and K↓ is the incoming diffuse short-wave radiation.
, instead, depends on the position of the Sun and is therefore estimated at each time step as
with being the short-wave radiation reflected from all street canyon elements into the sky.
The radiative surface temperature is calculated as
where is the sum of the emitted and reflected long-wave radiation from all street canyon elements into the sky, ϵurb is the bulk emissivity of the urban surface, L↓ is the incoming long-wave radiation, and σ is the Stefan–Boltzmann constant. ϵurb is calculated as the mean emissivity of the street canyon elements.
The bulk radiation parameters from the urban tile (urb) computed by BEP-Tree are combined with the ones computed by COSMO for the natural (nat) tile as
with furb and fnat ) being the planar fractions of urban and natural surfaces, respectively. The resulting bulk radiation parameters are used as lower (surface) boundary conditions for the short-wave and long-wave radiation routines in COSMO.
In the same way, the tendencies of momentum, sensible heat, moisture and TKE production from the urban tile are combined with the corresponding tendencies from the natural tile.
BEP-Tree operates on a grid (called the urban grid) that is vertically independent of and generally finer than the grid of COSMO (called the mesoscale grid). As a default, the vertical resolution of the urban grid is 5 m. At each model time step, the input fields from COSMO have to be interpolated to the urban grid, whereas the output fields (tendencies) of BEP-Tree have to be aggregated back to the mesoscale grid. The interpolation and aggregation of fields in COSMO-BEP-Tree follows the implementation of Schubert (2013).
Following Schubert (2013), the 2 m air temperature is diagnosed from the air temperature at the lowest mesoscale model layer and the surface temperature from both urban and natural surfaces as
where Tg is the surface temperature of the natural tile, Tstr is the street surface temperature, r is a coefficient that represents the stability-dependent resistance for scalar transport as estimated by the TKE-based surface-layer transfer scheme of COSMO (Baldauf et al., 2011), and T1 is the air temperature at the lowest model level.
2.4 COSMO-BEP-Tree pre-processor
Additional input variables need to be calculated before running COSMO-BEP-Tree. These variables, referred to as urban canopy parameters (UCPs) in the following, describe the spatial representation of the street canyon (including street trees) required by the urban canopy model. A dedicated Python programme, UCPgenerator v1.0, has been developed to generate the UCPs based on external datasets. The workflow of UCPgenerator is shown in Fig. 2 (green boxes). A technical description of UCPgenerator v1.0 is given in Appendix A.
The UCPgenerator requires the following three input datasets: (1) street trees, (2) buildings and (3) imperviousness. The dataset of street trees consists of a spatial map of the street tree distribution. This may include information on tree height, leaf area index (L) or leaf area density (LD) and tree species. In the case of missing information, representative profiles or knowledge-based assumptions can be used instead. Information on street trees is typically provided by inventories maintained by urban environmental agencies (e.g. Stadtgaertnerei Kantons Basel-Stadt, 2020), remotely sensed data such as lidar data (e.g. Alonzo et al., 2014) and combined data derived using data fusion techniques (e.g. Branson et al., 2018).
The building dataset consists of a collection of building geometries in the urban area, including building height as an attribute of each individual building. The 3-D building datasets are typically provided by national mapping agencies and collaborative projects (e.g. OpenStreetMap).
The imperviousness dataset is a spatial representation of the horizontal fraction of impervious surfaces in the model domain. Such data are available at the European scale (e.g. EEA, 2015) as well as at the global scale (e.g. Brown de Colstoun et al., 2017).
3.1 Study area and model setup
COSMO-BEP-Tree was applied over the Basel metropolitan area (Basel hereinafter), located mainly in Switzerland but extending over the borders of France and Germany (Fig. 3). Situated along the Rhine river, the larger Basel area has a population of approximately 830 000 inhabitants and is surrounded by hilly to mountainous terrain especially towards the south (Jura Mountains) and north-east (Black Forest). According to the Köppen climate classification, Basel features a temperate oceanic climate (Köppen: Cfb). The inner city (Basel-Stadt) includes more than 24 000 urban trees and 275 ha of public vegetated surfaces distributed over a total area of the city centre of approximately 2385 ha (Stadtgaertnerei Kantons Basel-Stadt, 2020). The average canopy cover from street trees is about 20 % when considering the entire urban area, but it varies from 6 % to 31 % in the different neighbourhoods (Fig. S1 in the Supplement). The city of Basel is an interesting target for the availability of extensive observational datasets for model evaluation, which had been used in numerous previous urban climate studies (e.g. Rotach et al., 2005; Parlow et al., 2014). Observations and input data used here are described in Sect. 3.3 and 3.2.
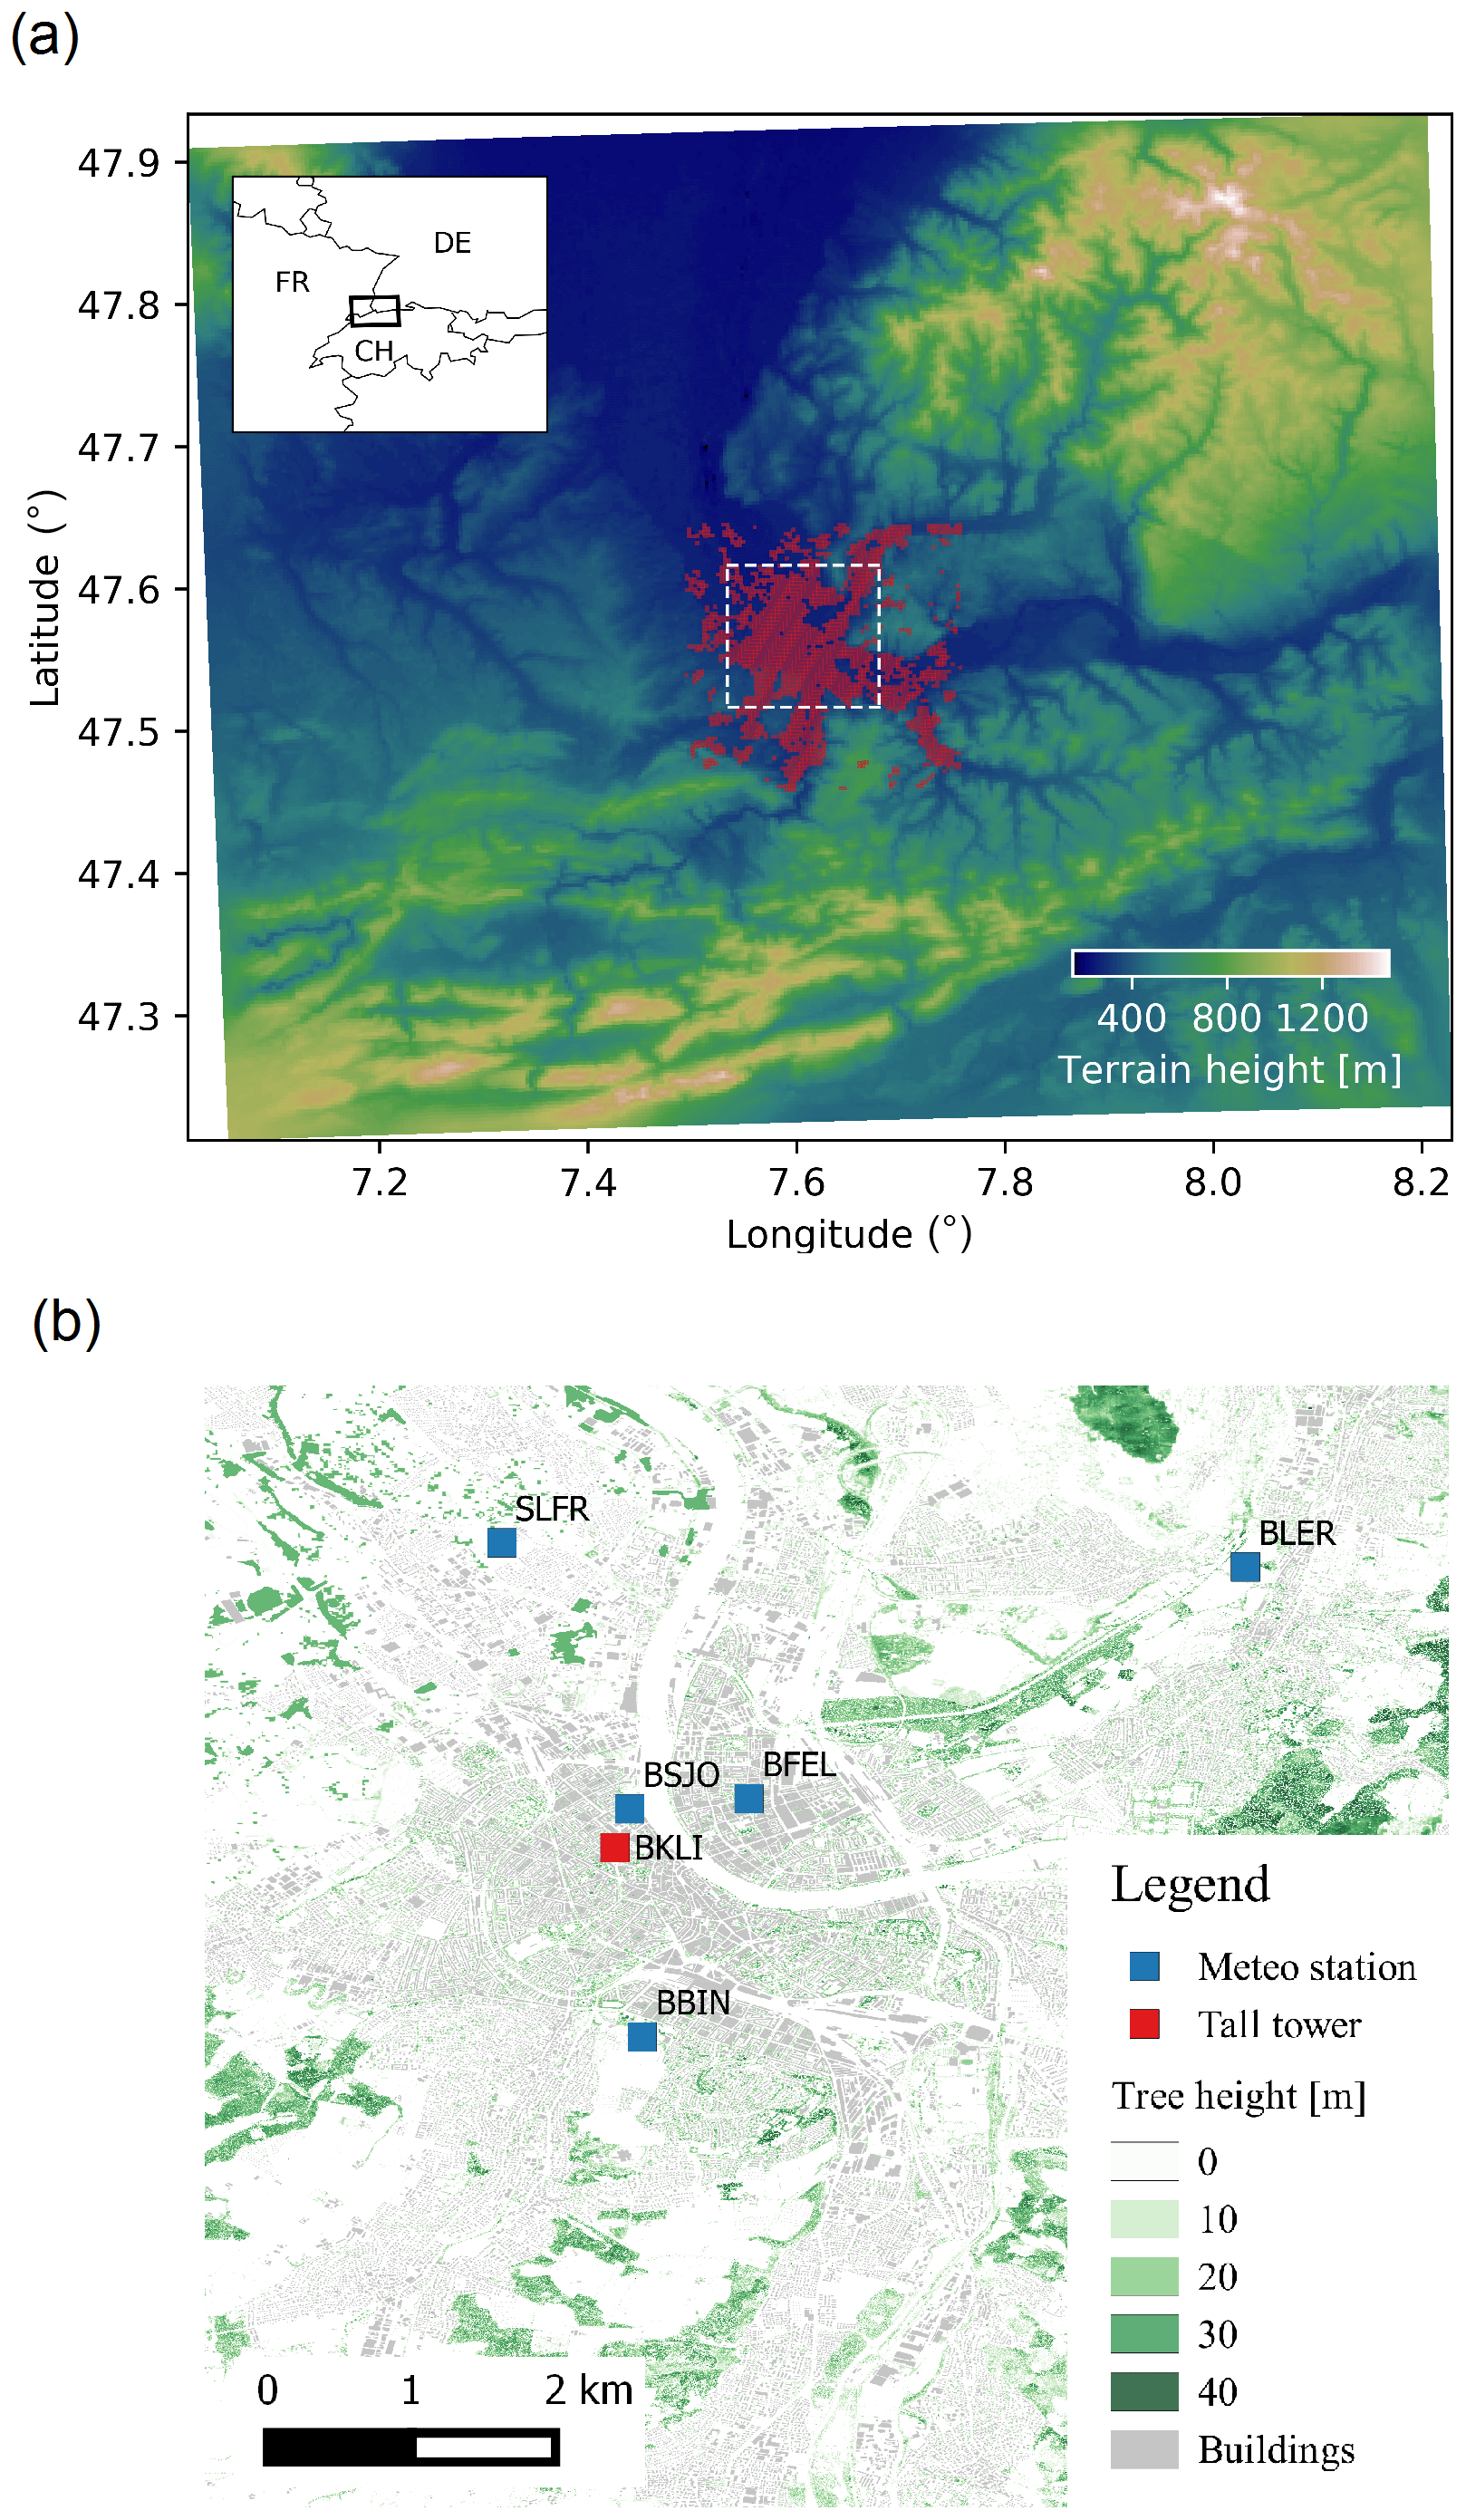
Figure 3(a) The model domain centred over the metropolitan area of Basel. The terrain height (in m a.s.l.) is shown in the background. The urban area is highlighted in red. (b) Details of the urban area (corresponding to the dashed rectangle in panel a) with the location of the measurement sites used for the evaluation (Sect. 3). In the background are the tree height distribution (green) (Geoportal Kanton Basel-Stadt, 2019) and building geometries (grey).
In this study, COSMO-BEP-Tree was run for the period of 22 June–9 July 2015, with the first 5 d discarded as a spin-up period. The analyses were performed on the period of 27 June–9 July 2015, called the study period hereinafter. The period corresponds to an intense heatwave that persisted across Europe producing a seasonal mean surface air temperature 2.4 K above the 1964–1993 mean (Dong et al., 2016; Ionita et al., 2017). The event featured a stable anticyclonic weather regime with a prevalence of cloud-free conditions, low wind speeds and absence of precipitation. The conditions were ideal for evaluating the model performance, particularly with respect to the impact of street trees on the urban atmosphere and the development of the UHI.
We applied COSMO-BEP-Tree over a domain of approximately 90 km×80 km with a horizontal grid spacing of 0.0025∘ (approximately 270 m). A total of 60 levels were used in the vertical direction, with 5 and 23 levels in the first 100 and 1000 m, respectively. The model setup closely follows the configuration described in Mussetti et al. (2020). Initial and boundary conditions were taken from the operational COSMO-2 analyses operated by the Swiss Federal Office of Meteorology and Climatology (MeteoSwiss), which are centred over Switzerland and cover the whole Alpine domain. The analyses have a horizontal resolution of about 2 km and are produced using a nudging technique (Schraff, 1997) applied to near-surface observations and vertical soundings of pressure, humidity and wind. Soil moisture, a key variable for accurate representation of heatwaves (Wang et al., 2019), is also initialised with the COSMO-2 analyses, which trace back to the soil moisture analyses of ECMWF's operational Integrated Forecasting System (IFS) model (De Rosnay et al., 2013). As additional input parameters for COSMO, the 1 arcsec global digital elevation map ASTER (Tachikawa et al., 2011) for topography, the 10 arcsec GlobCover 2009 land use dataset (Loveland et al., 2000) for land cover, and the 30 arcsec Harmonized World Soil Database (FAO et al., 2009) for soil properties were used.
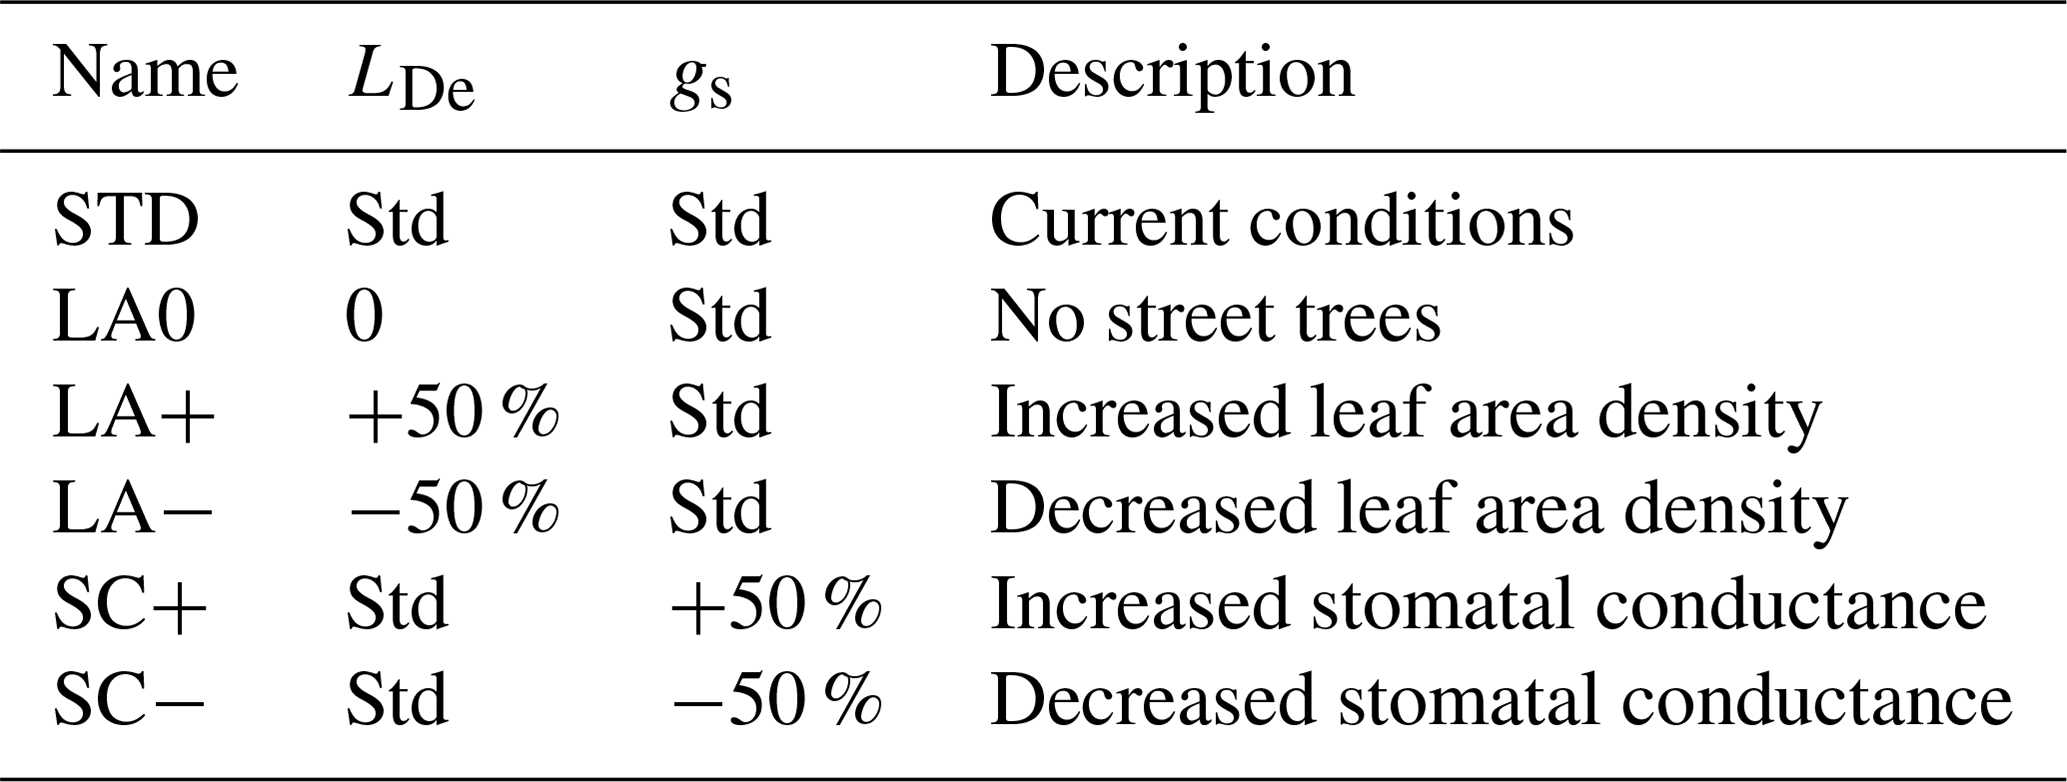
To assess the physical consistency of the implementation of the different interactions with street trees, we performed additional sensitivity simulations, changing the values of the parameters describing the street trees (Table 1). In addition to the standard run (STD), simulations without street trees (LA0), with increased and decreased values of leaf area density (LA+ and LA−, respectively) and with increased and decreased values of stomatal conductance (SC+ and SC−, respectively) were performed.
3.2 Urban canopy input data
Figure 4 shows the distribution of the main urban canopy parameters as derived by the UCPgenerator pre-processor. The model represents the spatial variability of the urban texture in terms of fraction of urban surfaces, street canyon orientation and width, building width and urban vegetation (Fig. 4e–f). Lcan and Lnat are obtained by vertical integration of the respective leaf area densities LD,can and LD,nat. Figure 4 also gives a flavour of the heterogeneity of the city: industrial areas in the northern and south-east parts of the city, for instance, are associated with wide street canyons and very low vegetation density. Residential areas in the south and west of the centre, in contrast, are characterised by narrow street canyons and relatively high vegetation density.
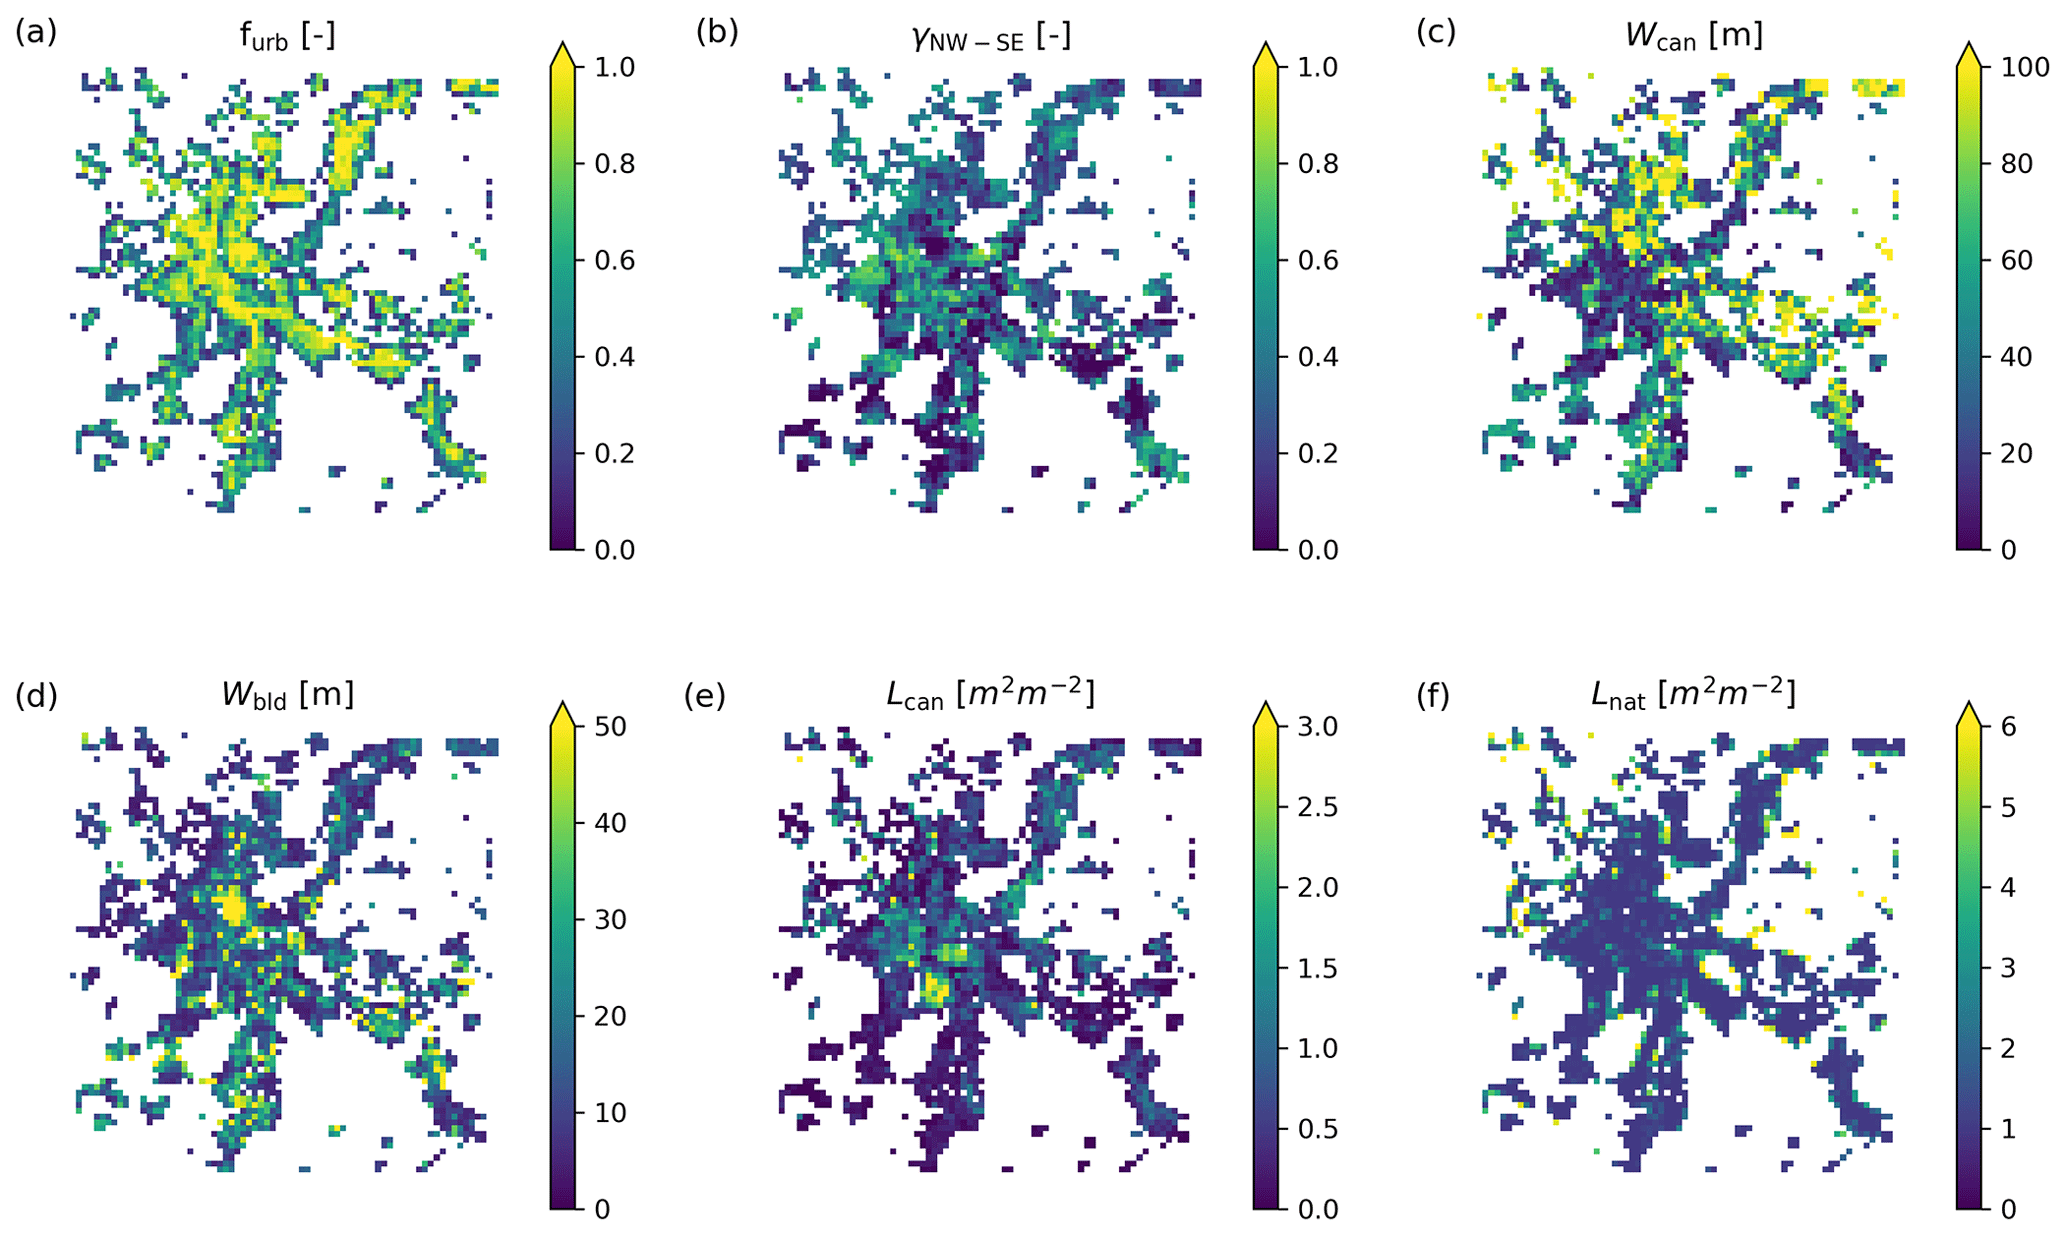
Figure 4Urban canopy parameters derived for the model domain: (a) urban fraction, (b) canyon fraction along the NW–SE direction, (c) average canyon width, (d) average building width, (e) leaf area index due to street trees and (f) leaf area index due to vegetation outside the urban canopy. Further details about the variables are given in Table A1. Only urban grid cells (furb>0.1) are shown.
The urban canopy parameters were derived with UCPgenerator from the following input datasets: (a) imperviousness from EEA (2015), (b) 3-D buildings from Federal Office of Topography (2007) and (c) lidar-based tree canopy height (see data availability section). The imperviousness dataset represents the percentage of soil sealing (including building area) and has a resolution of 20 m. The building dataset is a vector dataset representing the building geometries (accuracy 3–8 m), including heights but without information on the building materials or use. The tree canopy height dataset has a 2 m spatial resolution and includes all trees in the Basel area. The imperviousness dataset was used to differentiate between street trees (contributing to LD,can) and trees over natural surfaces (contributing to LD,nat). Specifically, trees located over mostly impervious surface (≥50 %) are classified as street trees. A local leaf area density (inside individual trees) LD,loc of 1 m3 m−2 was used according to measurements over urban trees during summertime in Gothenburg, Sweden (Klingberg et al., 2017). The tree species measured by Klingberg et al. (2017) are assumed to be rather representative as they correspond to 6 of the 12 most common species present in Basel (Geoportal Kanton Basel-Stadt, 2019). The density of street trees above the building column (LD,bld, representing trees overhanging roofs) was assumed to be 0. This assumption was made given that no reliable information was available about the overlapping between tree crowns and roofs. Further details regarding the methodology used to derive the urban canopy parameters are given in the Appendix A. The resulting Lcan (Fig. 4e) have values ranging from 0 up to 3 m2 m−2, which is within the same range as reported in previous urban studies (Liss et al., 2010; Alonzo et al., 2015; Klingberg et al., 2017).
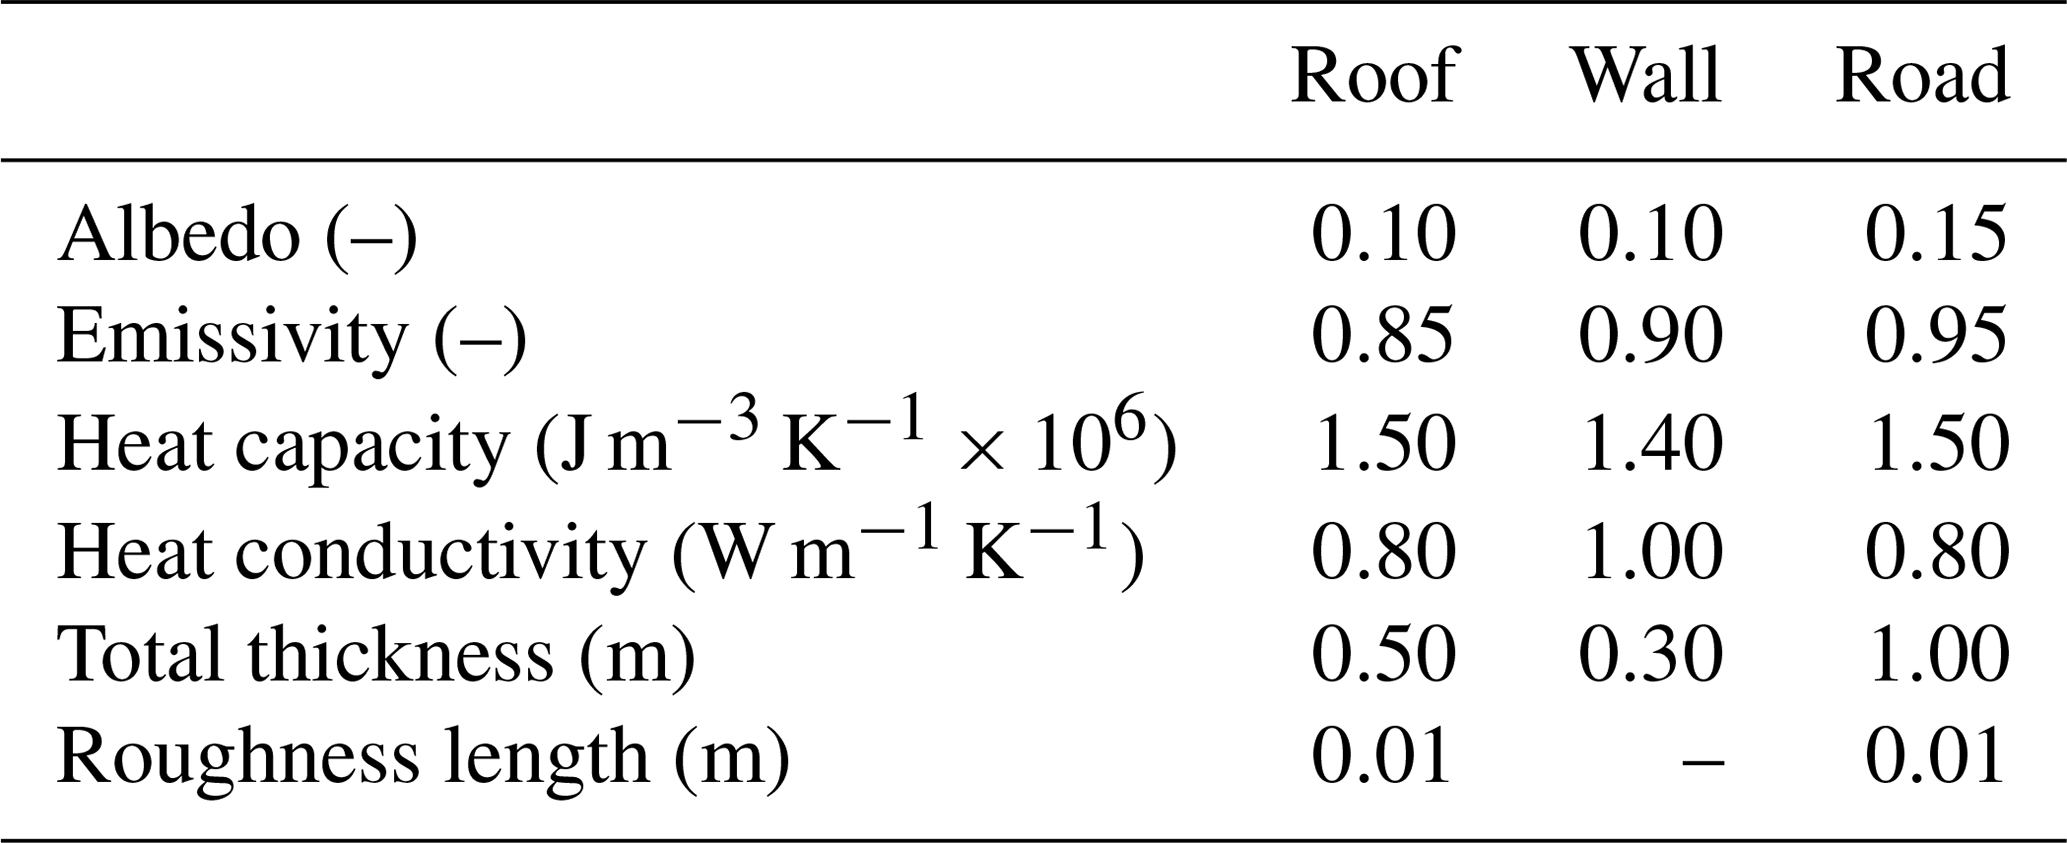
The thermal and physical properties of urban elements are listed in Table 2. The values are based on the recommendations of Loridan and Grimmond (2012) and are used as default values in COSMO-BEP-Tree. The values have already been evaluated over Basel by Loridan and Grimmond (2012). A foliage scattering coefficient of 0.5 and a foliage emissivity of 0.95 are used according to Krayenhoff (2014).
A step function is used to model the stomatal conductance (gs) with values of 140 and 20 mmol m−2 s−1 for daytime and nighttime, respectively. The values are calculated combining the dataset of urban tree species in the public area of Basel (Geoportal Kanton Basel-Stadt, 2019) with observed values of stomatal conductance (Konarska et al., 2016; Keel et al., 2007; Campbell and Norman, 2012; Xiong et al., 2018). Additional details are provided in the Table S1 in the Supplement.
A uniform constant value of clumping index (Ω) of 0.5 was used for the reference simulation (STD). In the absence of easily applicable methods to determine Ω in street canyon environments, we made our choice in analogy to measurements over an open savannah (Ryu et al., 2010). Savannah is a natural environment that resembles the urban environment in terms of heterogeneity and openness of the tree canopy.
Anthropogenic heat flux (QA) was estimated offline with the Large scale Urban Consumption of energY model (LUCY; Allen et al., 2011; Lindberg et al., 2013) version 2014a. LUCY simulates the hourly heat emissions from buildings, vehicles and human metabolism using gridded inventories of population density, primary energy consumption, air temperature, number of vehicles and seasonal, weekly and diurnal cycles of traffic density. Gridded population density from Center for International Earth Science Information Network – CIESIN – Columbia University, International Food Policy Research Institute – IFPRI, The World Bank, and Centro Internacional de Agricultura Tropical – CIAT. 2011 (2011) with a resolution of 30 arcsec were used. Values of energy consumption in the region of Basel for the months of June and July 2015 have been obtained Basel-Stadt (2020), replacing the default yearly average value, as recommended by Lindberg et al. (2013). The model estimated period-averaged values of QA of 4 and 14.4 W m−2 over the entire urban area and the city centre, respectively. A maximum value of 22.9 W m−2 was found around midday in the city centre. The values are consistent with previous estimates of 20 W m−2 as an annual average from Christen (2005).
3.3 In situ measurements
Measurements from one 38 m tall flux tower and five surface stations were used to evaluate the model results. Table 3 shows a summary of the corresponding observations. The site of Basel Klingelbergstrasse (BKLI) is an urban flux tower operated by the MCR Lab (Meteorology, Climatology and Remote Sensing) of the University of Basel. BKLI is located in an area with a dense mix of mid-rise buildings, corresponding to local climate zone (LCZ) 2 (Stewart and Oke, 2012) and relatively high density of street trees. The site consists of an 18 m high tower mounted on the flat roof of a 20 m high building. According to Lietzke and Vogt (2013) and Feigenwinter et al. (2012), the measurements can be considered to take place above the roughness sublayer and inside the inertial sublayer. The footprint area for energy fluxes was estimated to be 0.60 km2 for 90 % of the source area in summer (Schmutz et al., 2016). The site comprises an eddy covariance system consisting of an ultrasonic anemometer (HS-50, Gill Instruments Ltd.) and an open-path CO2∕H2O infrared gas analyser (LI-7500, LI-COR Inc.). Air temperature is measured with a fine-wire thermocouple mounted in a fan-aspirated radiation shield (ASPTC, Campbell Scientific); relative humidity is measured with a mirror-type dew point hygrometer (THYGAN VTP6, Meteolabor AG); radiation fluxes are measured with a four-component radiometer (CNR4, Kipp & Zonen). It is worth to mention that the flux measurement is generally characterised by a considerable uncertainty (Richardson et al., 2012; Järvi et al., 2018). The uncertainty due to random errors is approximately 20 % and 30 % of the measured flux of sensible and latent heat, respectively (Hollinger and Richardson, 2005). Further details on the site and data processing are available in Schmutz et al. (2016), Lietzke and Vogt (2013) and Feigenwinter et al. (2018).
Table 3Overview of observation sites used for model evaluation. Figure 3b shows the location of the sites. T is air temperature, q specific humidity, u wind speed, QH sensible heat flux, and QE latent heat flux.

a Only variables used in this study are reported (the station may measure additional variables). b With scattered trees (LCZ B). c Surrounded by open mid-rise residential areas (LCZ 2).
Six surface stations are used to evaluate the model performance inside the urban canopy layer. The sites of Basel Feldbergstrasse (BFEL) and Basel St. Johannplatz (BSJO) are operated by the local environmental agency (Lufthygieneamt beider Basel). The site of BFEL is located in an area corresponding to compact mid-rise (LCZ 2) and has moderate density of street trees. It is positioned directly inside the street canyon at the intersection between two roads oriented along the 80∕260 and axes. Due to its proximity to a south-facing wall, BFEL may experience temperatures larger than those expected in the middle of the street canyon. The site of BSJO is located in a small park at the border of the old city centre. The park is vegetated and extends to the north-east, while the surrounding area is characterised by a dense mix of mid-rise buildings. Both sites (BFEL and BSJO) measure temperature with a thermometer with radiation shield (HC-S3, Campbell Scientific). The site of Saint-Louis Trois-Frontières (SLFR) is operated by the environmental agency of Alsace (ASPA), France. The station is located in the outskirts of the city in an area characterised by large low-rise buildings (LCZ 8). Few or no trees are present, and the land cover is mostly paved or hard-packed. Air temperature is measured with a platinum resistance thermometer (HMP35D, Vaisala) with a radiation shield. The site of Basel Binningen (BBIN) is operated by MeteoSwiss. The station is located in a rural/agricultural patch (LCZ D) at the south-western outskirts of the city. Low-rise residential areas surround the patches to the west, north and east. The surface underneath the sensor is natural (grass), and scattered low-rise buildings are present at 15–20 m distance. The site measures temperature with a thermometer with a radiation shield and active ventilation (Rotronic HC2A-S3, Meteolabor). The site of Basel Lange Erlen (BLER) is operated by the MCR Lab. The station is located in a rural/agricultural patch (LCZ D) at 6 km distance from the city centre. The surface underneath the sensor is natural (grass). Given the vegetated environment and distance from the city centre, the site of BLER is used as a rural reference in this study. The station used the same instruments as the BKLI site for air temperature, relative humidity and radiation fluxes.
3.4 Satellite observations
Thermal infrared (TIR) data from the Landsat 7 are used to evaluate the modelled land surface temperatures (LSTmod). Landsat acquires TIR data with a spatial resolution of 60 m. In contrast to other TIR satellite data (e.g. MODIS or SEVIRI), this resolution is fine enough to support high-resolution applications. Due to its small field of view, Landsat TIR retrievals are not affected by thermal angular anisotropy (Hu et al., 2016). During the investigation period, the Landsat 7 scene from 5 July 2015 was selected for the evaluation. No other cloud-free scenes from Landsat 7 or 8 were available during this period. Specifically, the Landsat 8 overpass of 4 July 2015 had to be discarded due to the presence of cirrus clouds (Fig. S2).
The satellite surface temperature (LSTsat) was derived from satellite data by correcting and converting the TIR signal received by the satellite sensor. The LSTsat calculation follows the approach described in Mussetti et al. (2020). We used the radiative transfer model MODTRAN (MODerate resolution atmospheric TRANsmission) to estimate the atmospheric transmission, the long-wave upwelling or atmospheric path radiance and the long-wave downwelling or sky radiance (Abreu and Anderson, 1996; Berk et al., 2014; Tardy et al., 2016). Atmospheric profiles from COSMO-BEP-Tree (STD simulation) were used in MODTRAN, replacing its standard profiles. MODTRAN was used to transform the top-of-atmosphere radiance to surface-leaving radiance, which was further converted to LST by inverting the Planck function (Coll et al., 2010). A modified vegetation-threshold approach by Sobrino et al. (2008) was used to estimate the surface emissivity. As the original approach does not account for built-up areas, a lookup table for dark and bright urban surfaces with a range of 0.95 to 0.97, based on emissivity values for typical urban fabrics (Baldridge et al., 2009), was applied (Mitraka et al., 2012). Note that these values differ from those used in the model (Table 2). The uncertainty in the values of emissivity produces average changes in the LST of about 1.25 K (Fig. S3). On top of this, the LST is affected by uncertainties due to atmospheric correction, sensor and off-nadir view (Voogt and Oke, 2003; Chen et al., 2017).
The LSTsat has been remapped to the model grid of COSMO-BEP-Tree using an average resampling method; i.e. the average of all contributing pixels was computed (McInerney and Kempeneers, 2015). This resampling method ensures the conservation of the mean values.
LSTmod was calculated combining the temperatures of roofs, streets and natural surfaces according to their respective fractions as
where Tstr is the temperature of the streets (function of canyon direction d), fdir is the fraction of canyons with direction d, CC is the effective canopy cover from street trees, is the vertically averaged temperature of the leaves of the street trees, Troof is the temperature of the roofs (function of canyon direction d and height h) and Tnat is the temperature of the natural tile. CC is estimated from the leaf area density L using the relationship provided by Klingberg et al. (2017).
3.5 Performance metrics
The model performance was evaluated against the observations using the following metrics: root-mean-square error (RMSE), systematic root-mean-square error (RMSEs), unsystematic root-mean-square error (RMSEu), mean bias error (MBE) and coefficient of determination (r2). This choice of metrics follows the recommendations of Willmott et al. (1985) and ensures comparability with previous urban climate model evaluations (e.g. Schubert and Grossman-Clarke, 2014; Oleson et al., 2008; Grimmond et al., 2011). The definition of the indices is available in Willmott et al. (1985), Willmott (1981).
4.1 Evaluation against measurements from an urban flux tower
The comparison between model simulations and observations above the urban canopy layer at the BKLI flux tower site is shown in Fig. 5. Only the results corresponding to the reference simulation (STD) and to the simulation without street trees (LA0) are shown (see Table 1 for further details on the simulation setups). The statistical scores are given in Table 4. If not specified, we refer to the STD simulation in the text below.
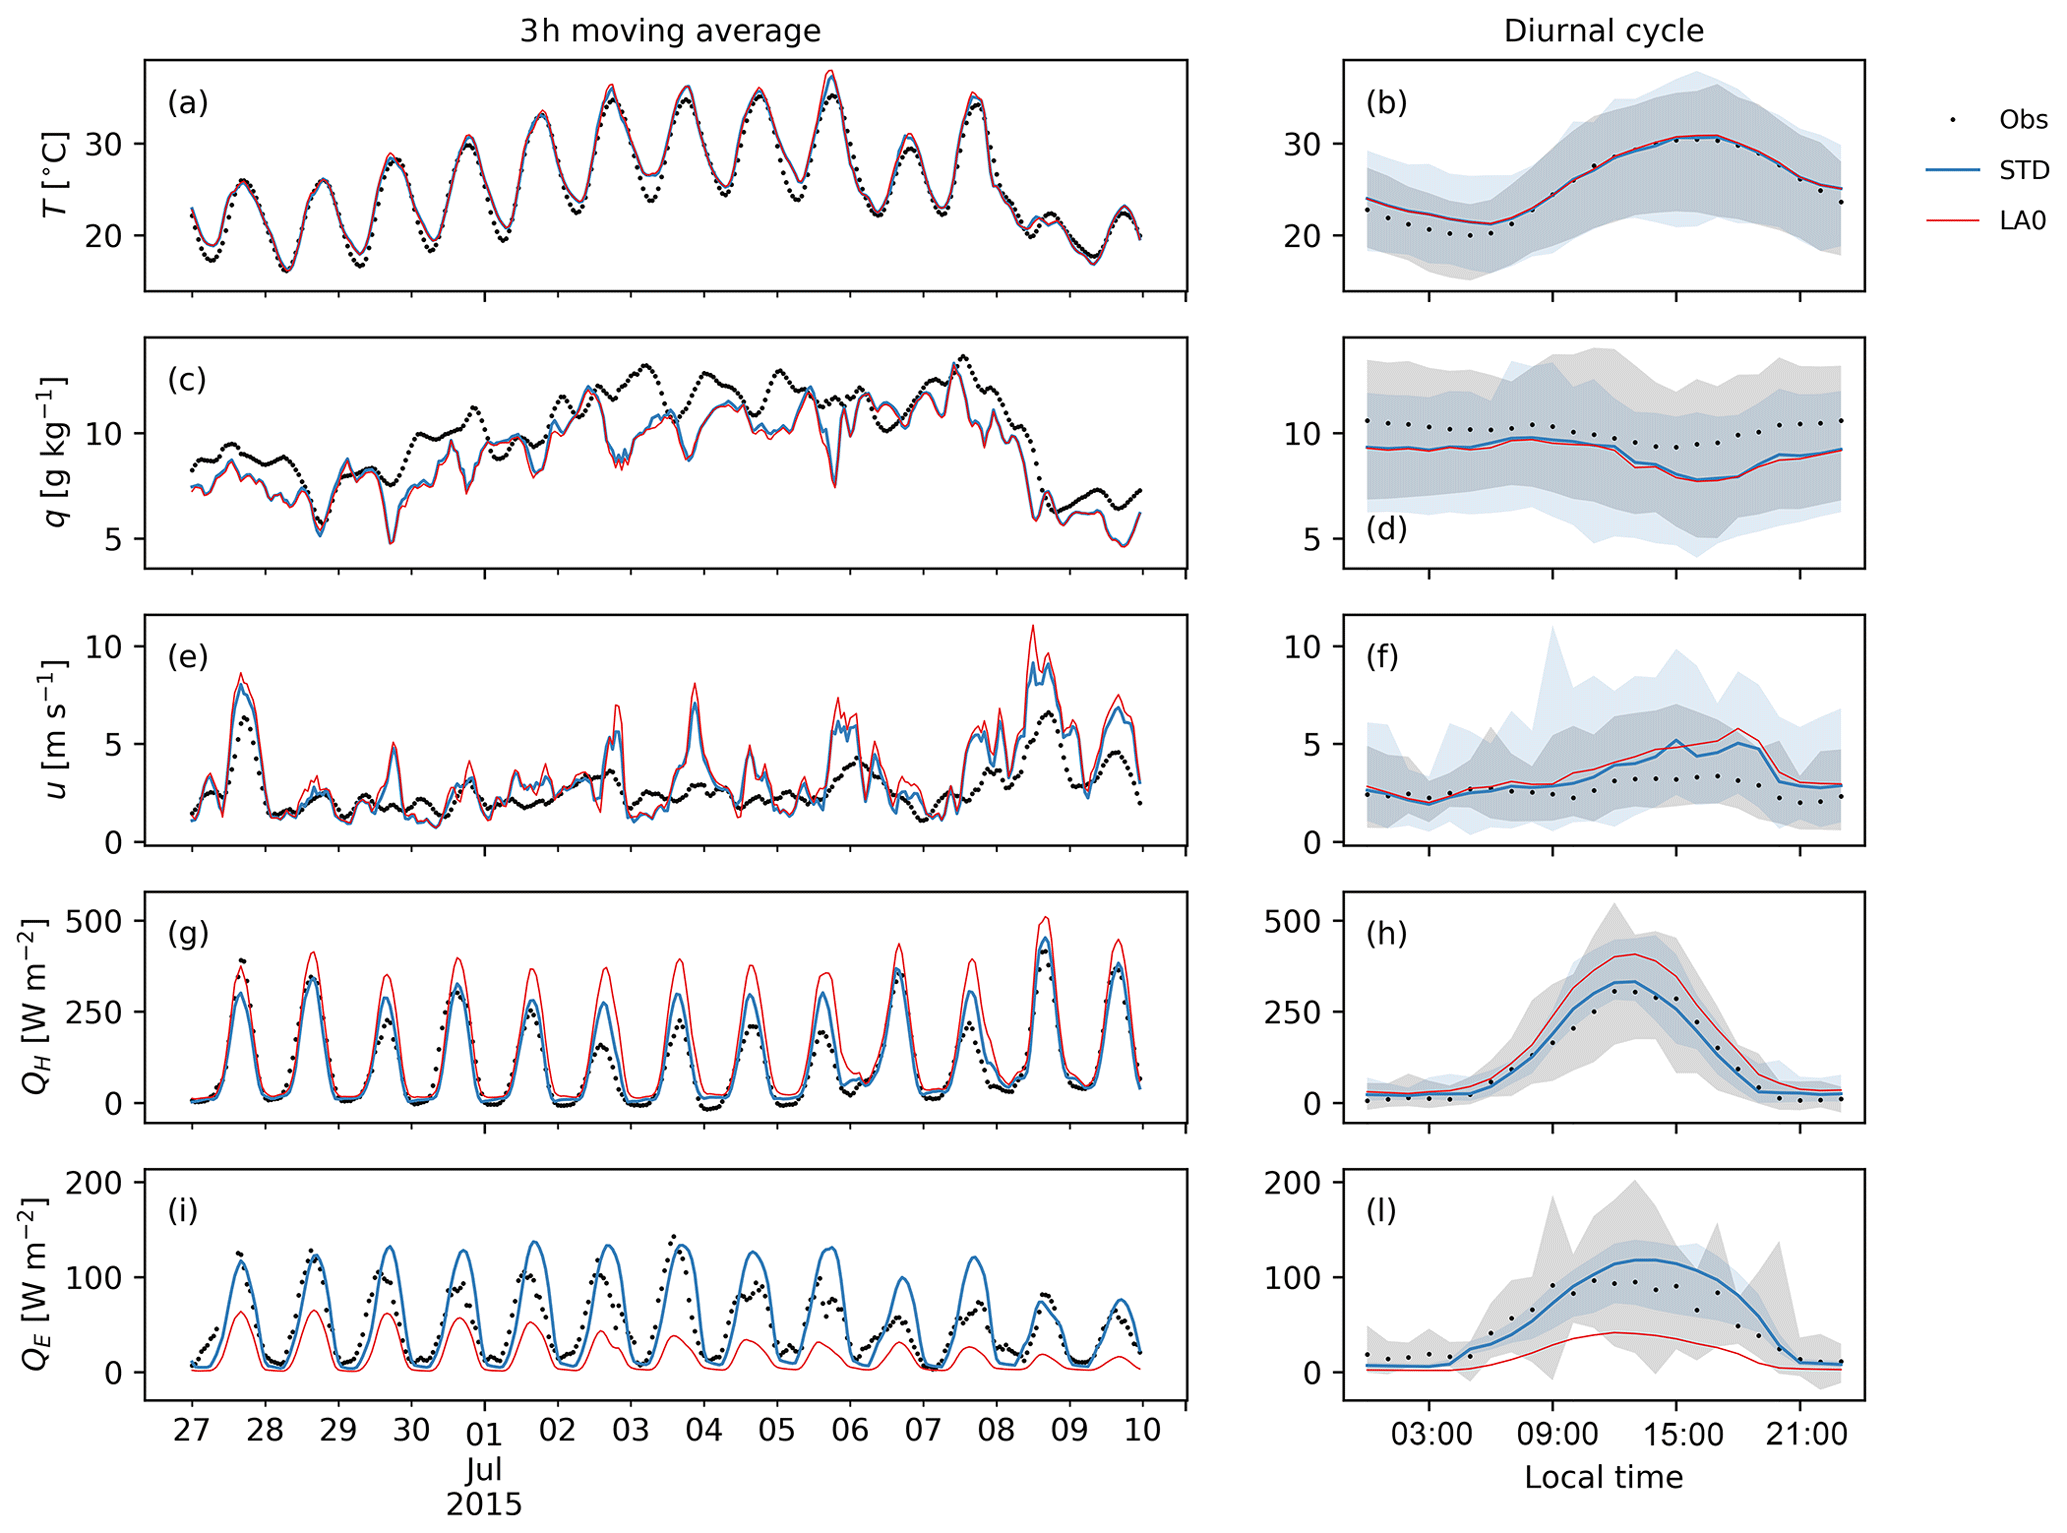
Figure 5Comparison between observations (Obs) and model simulations (STD, LA0) of air temperature (a, b), specific humidity (c, d), wind speed (e, f), sensible heat flux (g, h) and latent heat flux (i, l) at the BKLI site (38 m tall flux tower) during the study period. The left (a, c, e, g, i) and right (b, d, f, h, l) columns show the 3 h moving average and the diurnal cycle, respectively. Black dots indicate the observations. Blue lines and red lines indicate the results from the STD and LA0 model runs, respectively. The shaded areas represent the range of variability within the period for the observations and STD simulation only. Specifications of the model setups can be found in Sect. 3.1.
Table 4RMSEs, MBEs and coefficient of determination (r2) of the simulated air temperatures (T), specific humidity (q), wind speed (u), sensible heat flux (QH) and latent heat flux (QE) at the BKLI site (38 m above ground) during the study period. In addition to the total RMSEs (T), the systematic (S) and the unsystematic (U) RMSEs are listed. The statistics are provided for the standard simulation (STD) and the simulation without street trees (LA0). The units only apply to RMSE and MBE.
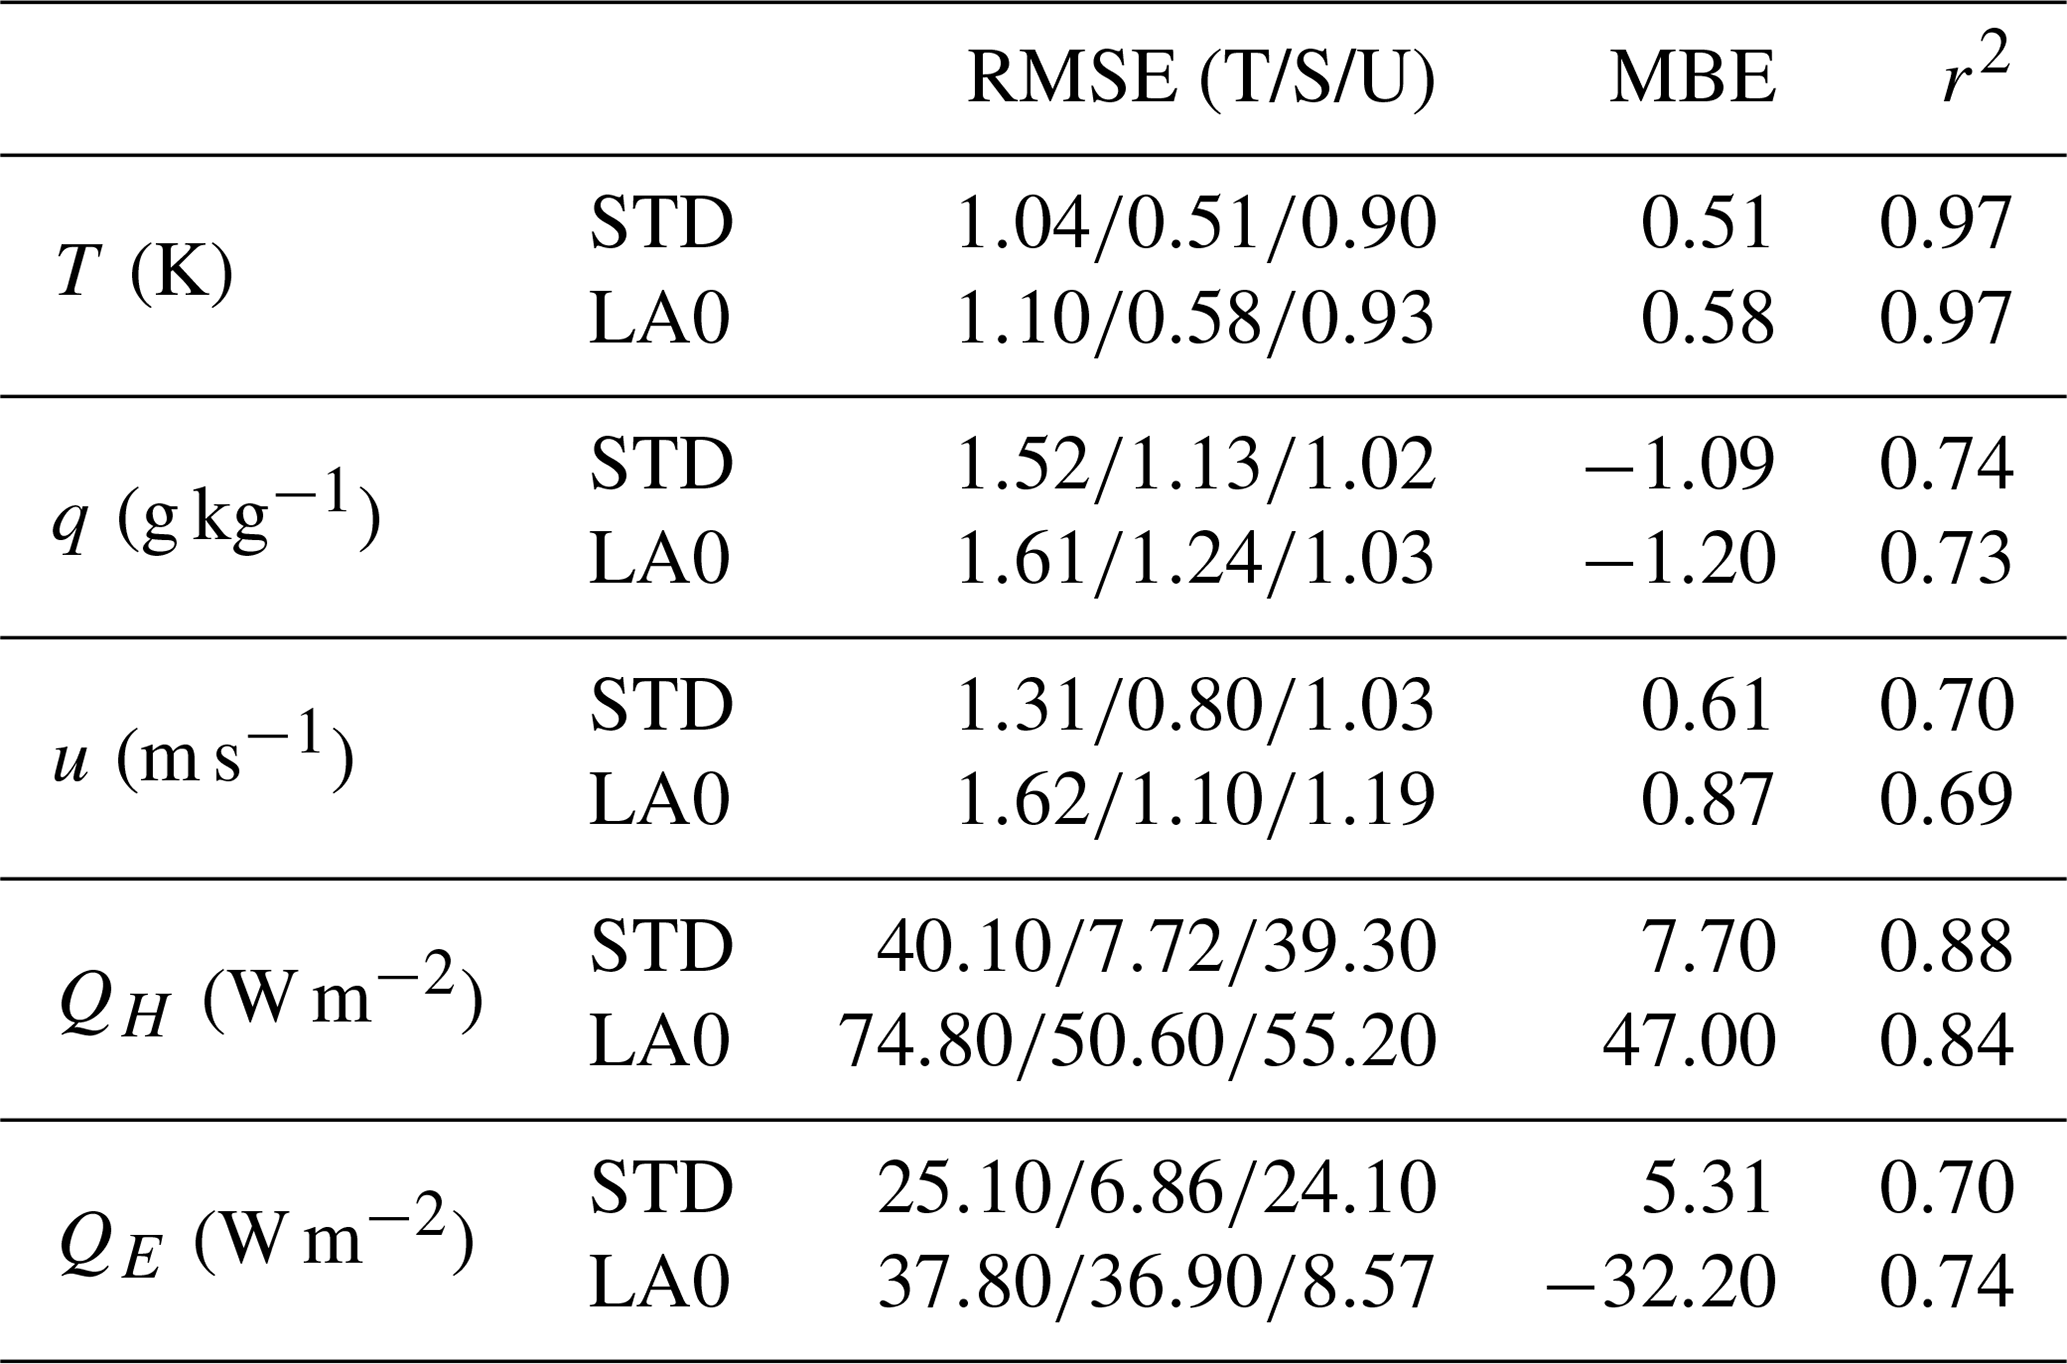
The model simulates the evolution of air temperature very well during the evaluation period (Fig. 5a–b), although a slight overestimation with a MBE of 0.51 K and a systematic RMSE of 0.51 K was found. The overestimation occurs mostly during nighttime and it seems to be related to an underestimation of the bulk albedo (Fig. S4), which can be traced back to the choice of material properties (Table 2). A too-low albedo may have produced an excess in heat storage with consequently larger sensible heat release at night. Nevertheless, a nighttime overestimation of temperature was not found at the near-surface sites, indicating that more analyses are needed to better understand eventual issues with the choice of material properties. The impact of street trees on the air temperature above the canopy layer is found to be negligible, giving the very small differences between STD and LA0.
The evolution of specific humidity q throughout the simulation is generally well reproduced (Fig. 5c–d). The mean value of q is underestimated (MBE g kg−1), which explains a large fraction of the systematic RMSE (RMSEs = 1.13 g kg−1). A similar pattern is found at the rural site of BLER (Fig. S5), indicating that the bias is not related to the urban scheme. The bias would be consistent with a general underestimation of soil moisture in COSMO as reported by Davin et al. (2011). Another possible source of the bias may be related to the boundary conditions, with insufficient humidity advected from the boundaries of the domain. Street trees produce a very small increase in specific humidity, bringing the model in slightly closer agreement with the observations. This is quantified by a reduction in the systematic component of RMSE and MBE compared to LA0 of about 0.1 g kg−1 (about 6 % and 8 % of the entire RMSE and MBE, respectively).
The model simulates well the evolution of wind speed (u) during the evaluation period (Fig. 5e–f) but overestimates u during several days and especially in the afternoon. The overestimation was not limited to the urban area but was also found at the rural site (Fig. S5). Although its origin is unclear, possible causes may include a misrepresentation of the regional-scale wind from the driving boundary conditions and an overestimation of the thermally driven flow induced by the surface temperature gradient between the city and the surroundings. Nevertheless, the comparison with observations shows a small bias (MBE =0.61 m s−1), lower than previous urban studies with COSMO (e.g. Schubert and Grossman-Clarke, 2014), and the unsystematic error dominates. Street trees reduce the simulated u and slightly improve the agreement with the observations. RMSE and MBE are reduced compared to LA0 by 0.31 and 0.26 m s−1, respectively.
The sensible heat flux (QH) follows the observations very well during the evaluation period (Fig. 5g–h), showing almost no bias (MBE = 7.7 W m−2) but a RMSE of 40.1 W m−2 with a large unsystematic component. These errors are comparable to or smaller than those obtained in a recent intercomparison of UCMs (Grimmond et al., 2011). The representation of street trees substantially improves the agreement with the observations. Street trees reduce simulated QH by as much as 100 W m−2 during midday. The improvements in RMSE and MBE compared to LA0 were as large as 34.7 and 39.3 W m−2, respectively. Additionally, an improvement of 0.06 in r2 was also found.
The evolution of latent heat flux (QE) is generally well reproduced by the model (Fig. 5i–l), but the agreement is better during the initial and final phases of the heatwave when the synoptic forcing was stronger and wind speeds correspondingly higher. During the central part of the evaluation period, an overestimation is found. Overall, the model showed a very small MBE of about 5 W m−2 and a RMSE of 25.1 W m−2. Again, the scores are comparable to or better than those obtained in a recent intercomparison of UCMs (Grimmond et al., 2011). The slight overestimation during the central part of the simulation period could be caused by a limitation in soil water availability that may have been present in reality but was not considered in the simulations. Street trees had a very large impact on QE and improved the agreement with the observations substantially. RMSE and MBE improved compared to LA0 by 12.7 and 26.9 W m−2, respectively.
For completeness, the comparison between modelled and observed radiation fluxes is shown in Fig. S6. The model simulations agree reasonably well with the observed radiation fluxes, although the upward short-wave radiation is underestimated. This indicates that the albedo is underestimated, which can be related to the choice of material properties (Table 2). The upward long-wave radiation is slightly overestimated, which can therefore be related to the underestimation of the albedo and, consequently, to an overestimation of surface temperatures. Overall, the representation of street trees had a very minor impact on the radiation fluxes.
4.2 Evaluation against surface stations
Within the urban canopy layer, the model was evaluated in terms of the 2 m air temperature (T2 m) and canopy layer UHI intensity. The UHI intensity is defined as where Ti is the 2 m air temperature at the urban site i, and Trur is the 2 m temperature at the rural reference site (BLER). The comparison between model simulations and observations in term of T2 m is shown in Fig. 6. Only the results corresponding to the reference simulation (STD) and to the simulation without street trees (LA0) are shown. If not specified, we refer to the STD simulation in the text below.
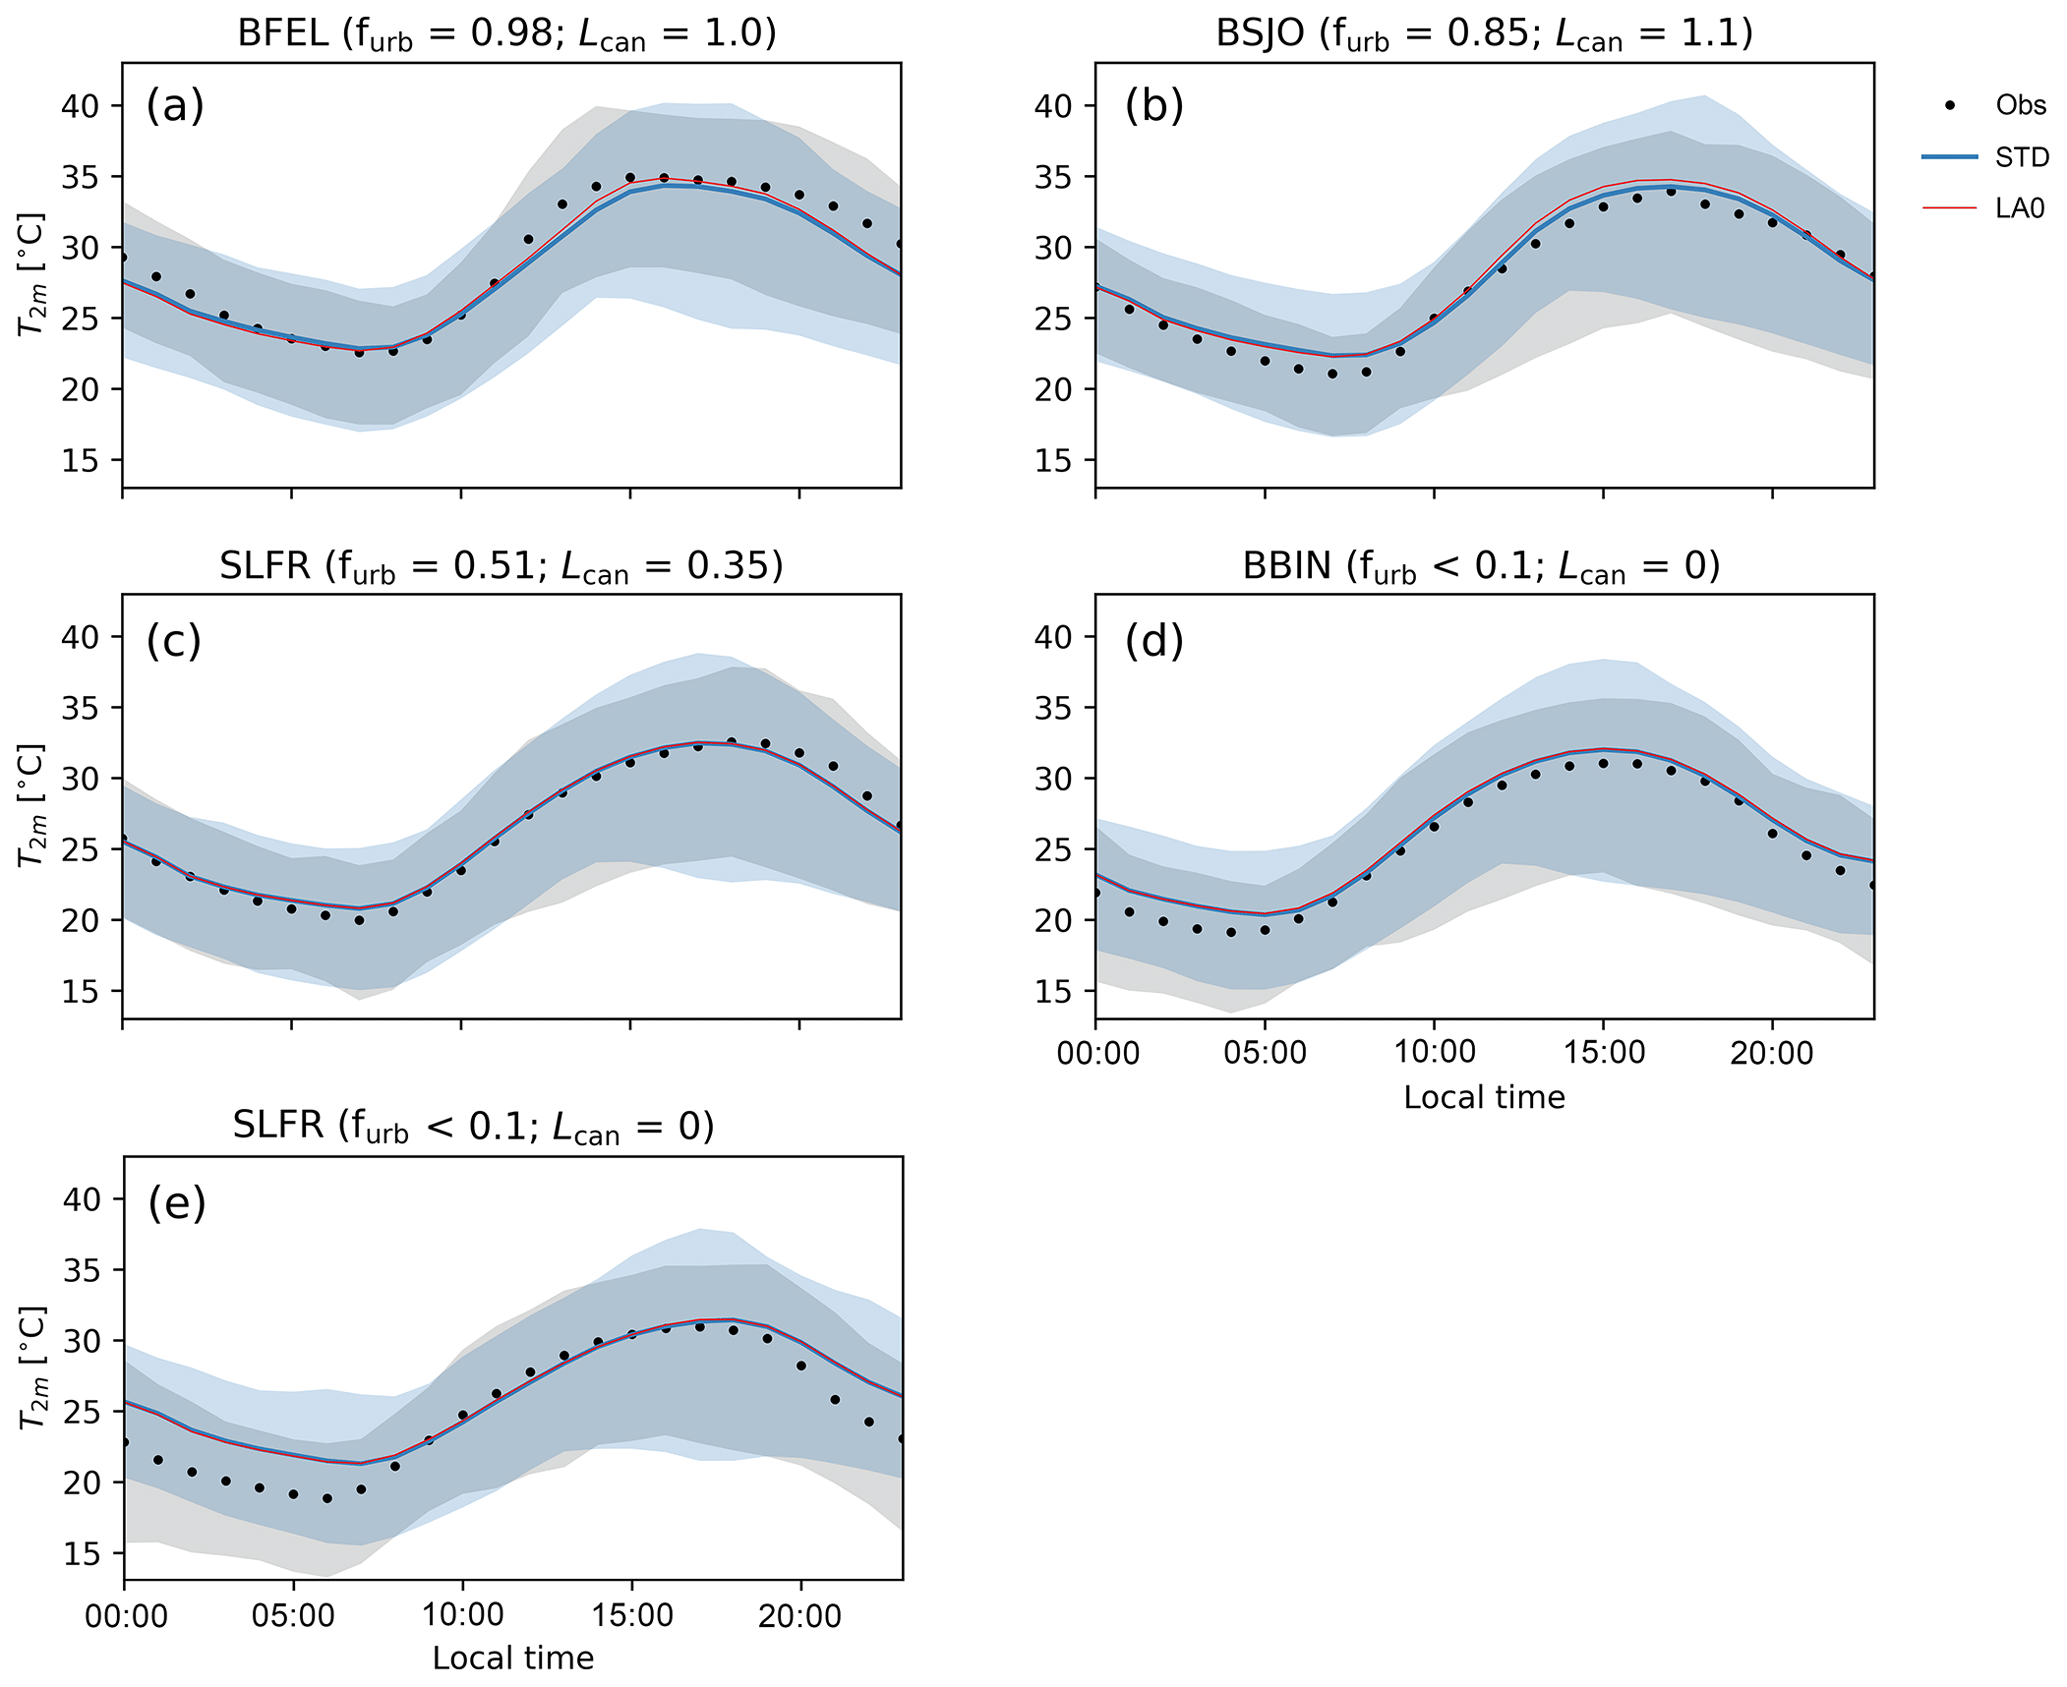
Figure 6Comparison between period-averaged daily profiles of observed (Obs) and model-simulated 2 m air temperature at the BFEL, BSJO, SLFR, BBIN and BLER sites during the study period. Black dots indicate the observations. Blue lines and red lines indicate the results from the STD and LA0 model runs, respectively. The range of variability within the selected period is shown as a shaded area for Obs (grey) and STD (light blue).
The model simulation compares generally well with the observed T2 m, especially in the urban area. The model errors are in the range of other urban climate studies (e.g. Schubert and Grossman-Clarke, 2014; Wouters et al., 2016). The difference between model and observations is more pronounced at the BFEL site where the systematic part of the RMSE is substantially higher (RMSEs=0.93 K) than at other sites. This difference may be related to the local exposure of the BFEL sensor, located in the vicinity of a (warm) south-facing wall. The overestimation of temperatures at the rural sites (BLER and BBIN) (MBE =1.36 and 0.88 K, respectively), which is most pronounced at nighttime, is also notable. This is probably determined by the combined effect of underestimation in surface albedo and misrepresentation of atmospheric stability (Figs. S4 and S7). A similar underestimation of albedo at rural sites has been already found by Schubert and Grossman-Clarke (2014). The underestimation is attributed to the default albedo scheme of COSMO-CLM, which fails to represent different vegetation types. It is unclear, however, whether this bias is due to specific conditions at the BLER site (grassland) or due to a general misrepresentation in the land surface model of COSMO-CLM. The misrepresentation of stable boundary layer conditions is a well-known issue of COSMO (Buzzi et al., 2011; Cerenzia, 2017) and has already been reported in previous studies (Schubert and Grossman-Clarke, 2014; Mussetti et al., 2020).
The representation of street trees produces a slight decrease in daytime air temperature, particularly around noon (Fig. 6a–b). This effect is more evident at sites with higher urban fraction (furb) and leaf area index from street trees (Lcan). The representation of street trees slightly reduced the RMSE and MBE at all the sites (but BFEL) compared to LA0. When averaged over all sites, the reductions in RMSE and MBE were 0.03 and 0.11 K, respectively.
The comparison between model simulation and observations in terms of UHI intensity for the simulations STD and LA0 is shown in Fig. 7. The statistical scores are presented in Table 6 for the STD simulation only.
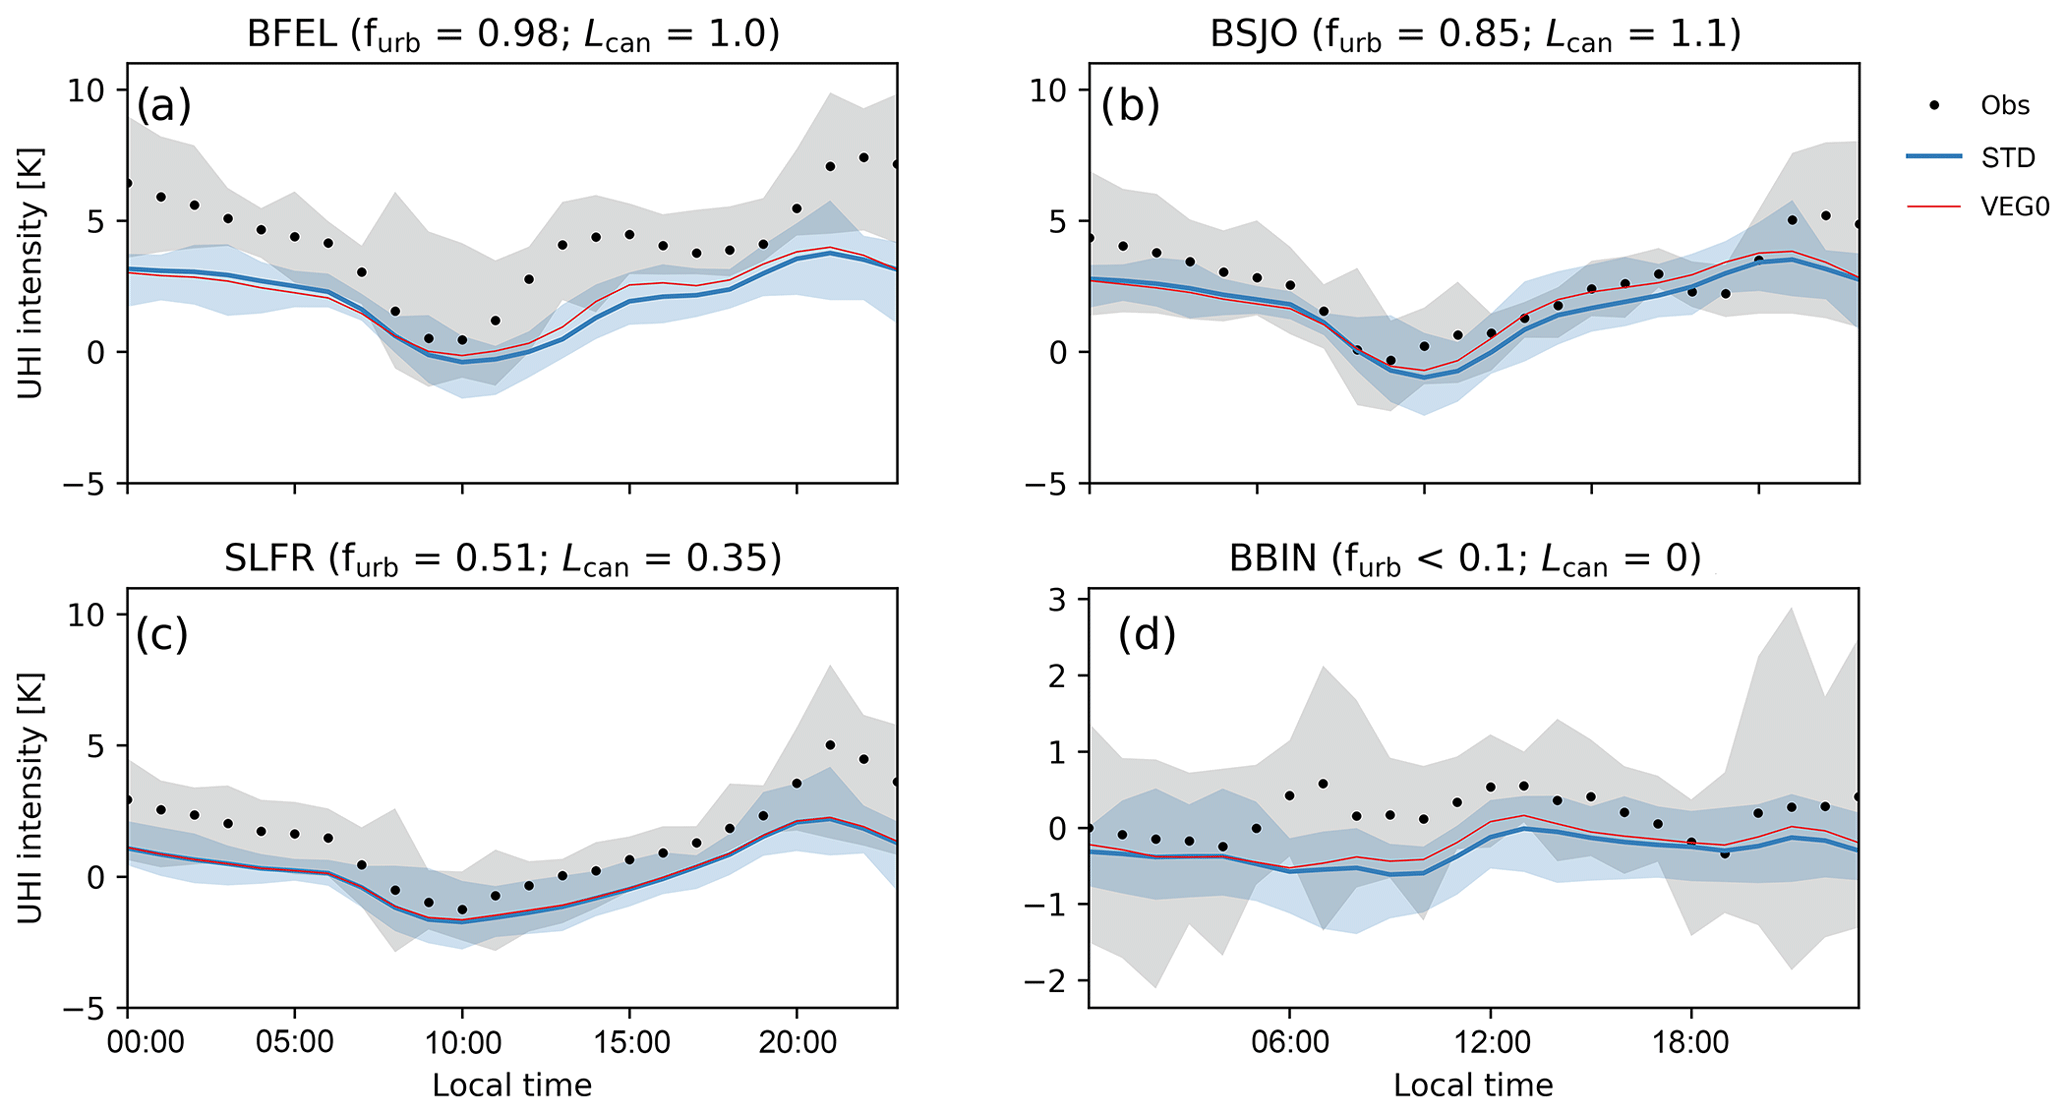
Figure 7Comparison between period-averaged daily profiles of observed (Obs) and model-simulated 2 m UHI intensity at the BFEL, BSJO, SLFR and BBIN sites during the evaluation period. The BLER site is used as a rural reference. Black dots indicate the observations. Blue lines and red lines indicate the results from the STD and LA0 model runs, respectively. The range of variability within the selected period is shown as a shaded area (only for Obs and STD).
Table 5RMSEs, MBEs and r2 of the simulated 2 m air temperature T2 m at the BFEL, BSJO, SLFR, BBIN and BLER sites during the study period. In addition to the total RMSEs (T), the systematic (S) and the unsystematic (U) RMSEs are listed. The statistics are provided for the standard simulation (STD) and the simulation without street trees (LA0).
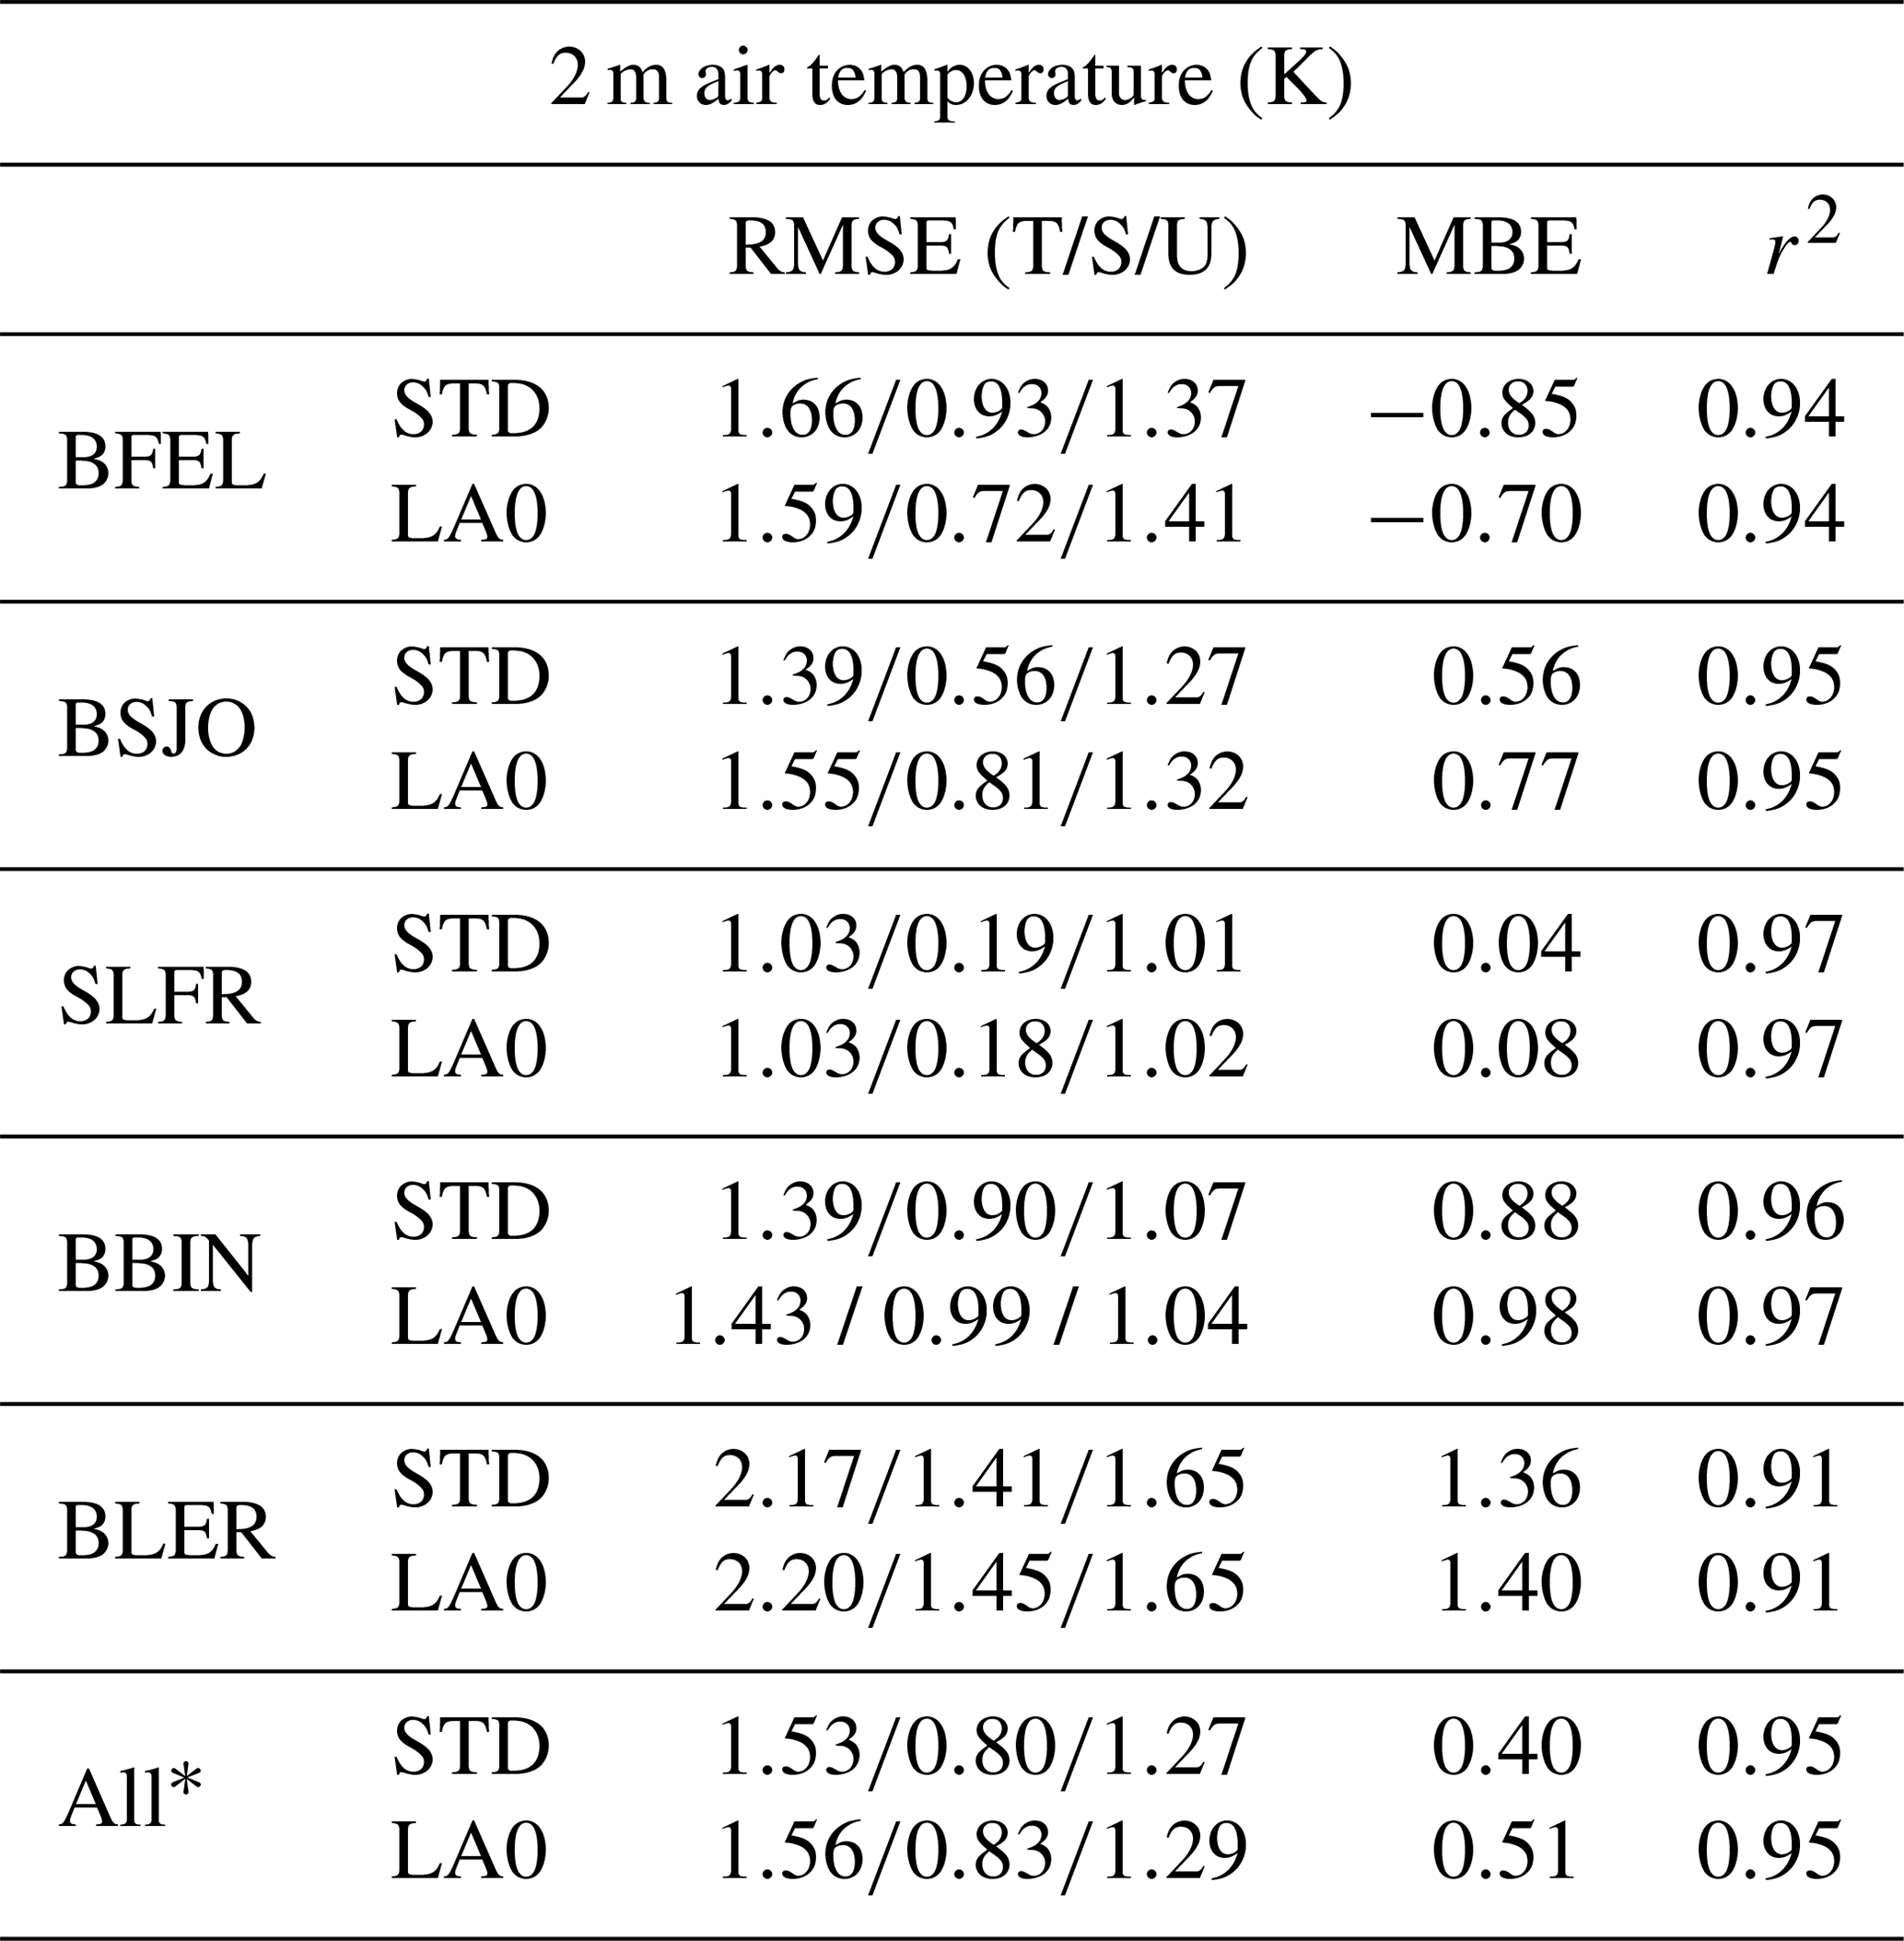
* Average over all sites.
Table 6RMSEs, MBEs and r2 of the simulated 2 m UHI intensity (K) at the sites of BFEL, BSJO, SLFR and BBIN during the study period. The BLER site is used as a rural reference. In addition to the total RMSEs (T), the systematic (S) and the unsystematic (U) RMSEs are listed.
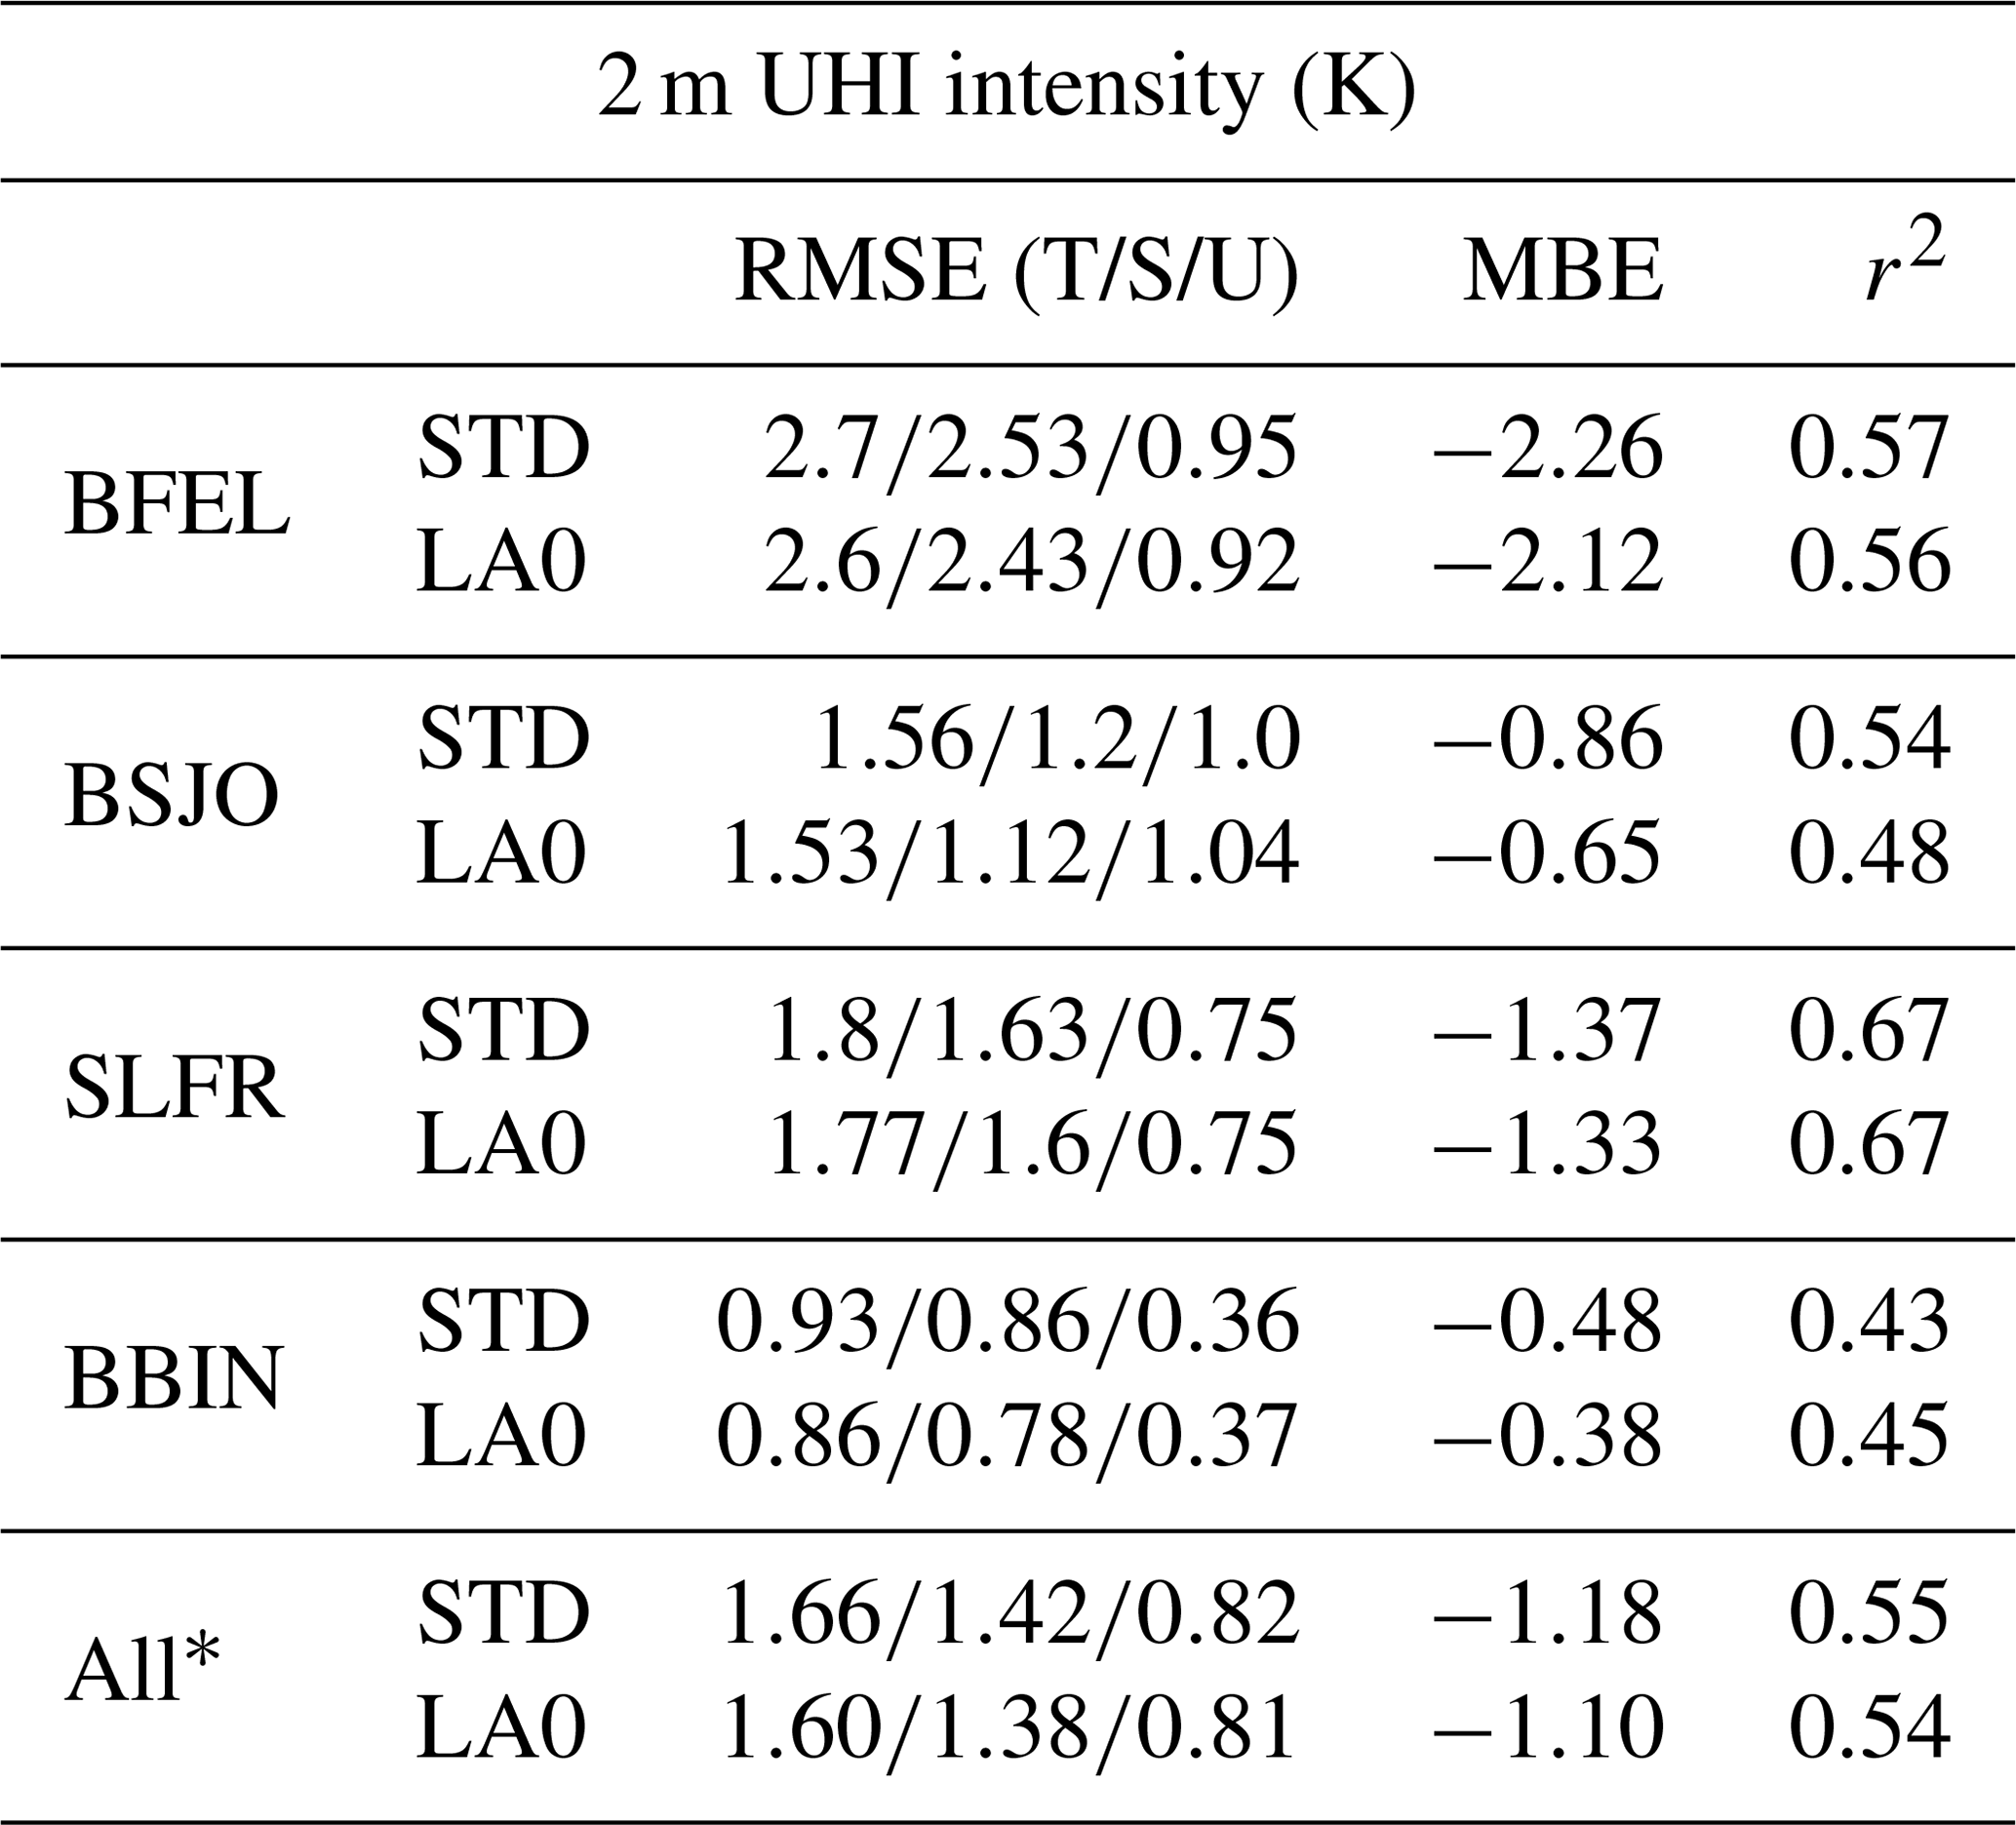
* Average over all sites.
The model is able to capture the general features of the UHI, such as the daily evolution and the different magnitude of the UHI at the different sites, whereas the temporal variability throughout the period is not always represented. Generally, the UHI intensity is underestimated, especially during nighttime. This is related to the overestimation of nighttime air temperatures at the rural site (BLER) (MBE =1.36 K for STD) and, to a minor extent, to the underestimation at the most urban sites (Table 5 and Fig. 6). The performance with respect to UHI intensity is better than or comparable to similar studies (Wouters et al., 2016; Schubert and Grossman-Clarke, 2014).
The representation of street trees affects the simulated UHI intensity by producing a slight reduction in UHI intensity from late morning to early evening. The impact of street trees is more evident at sites with higher urban fraction and density of street trees. An improvement in model performance with street trees was, however, not evident in terms of UHI representation. Considering that street trees produce changes in the expected direction, this suggests that probably other model biases are masking the benefit of including street trees.
4.3 Evaluation against satellite observations of land surface temperature
Figure 8 compares the spatial distribution of simulated and remotely sensed LST on 5 July 2015 at approximately 11:10 local time (LT) (10:10 UTC). Statistical scores are shown in Table 7.
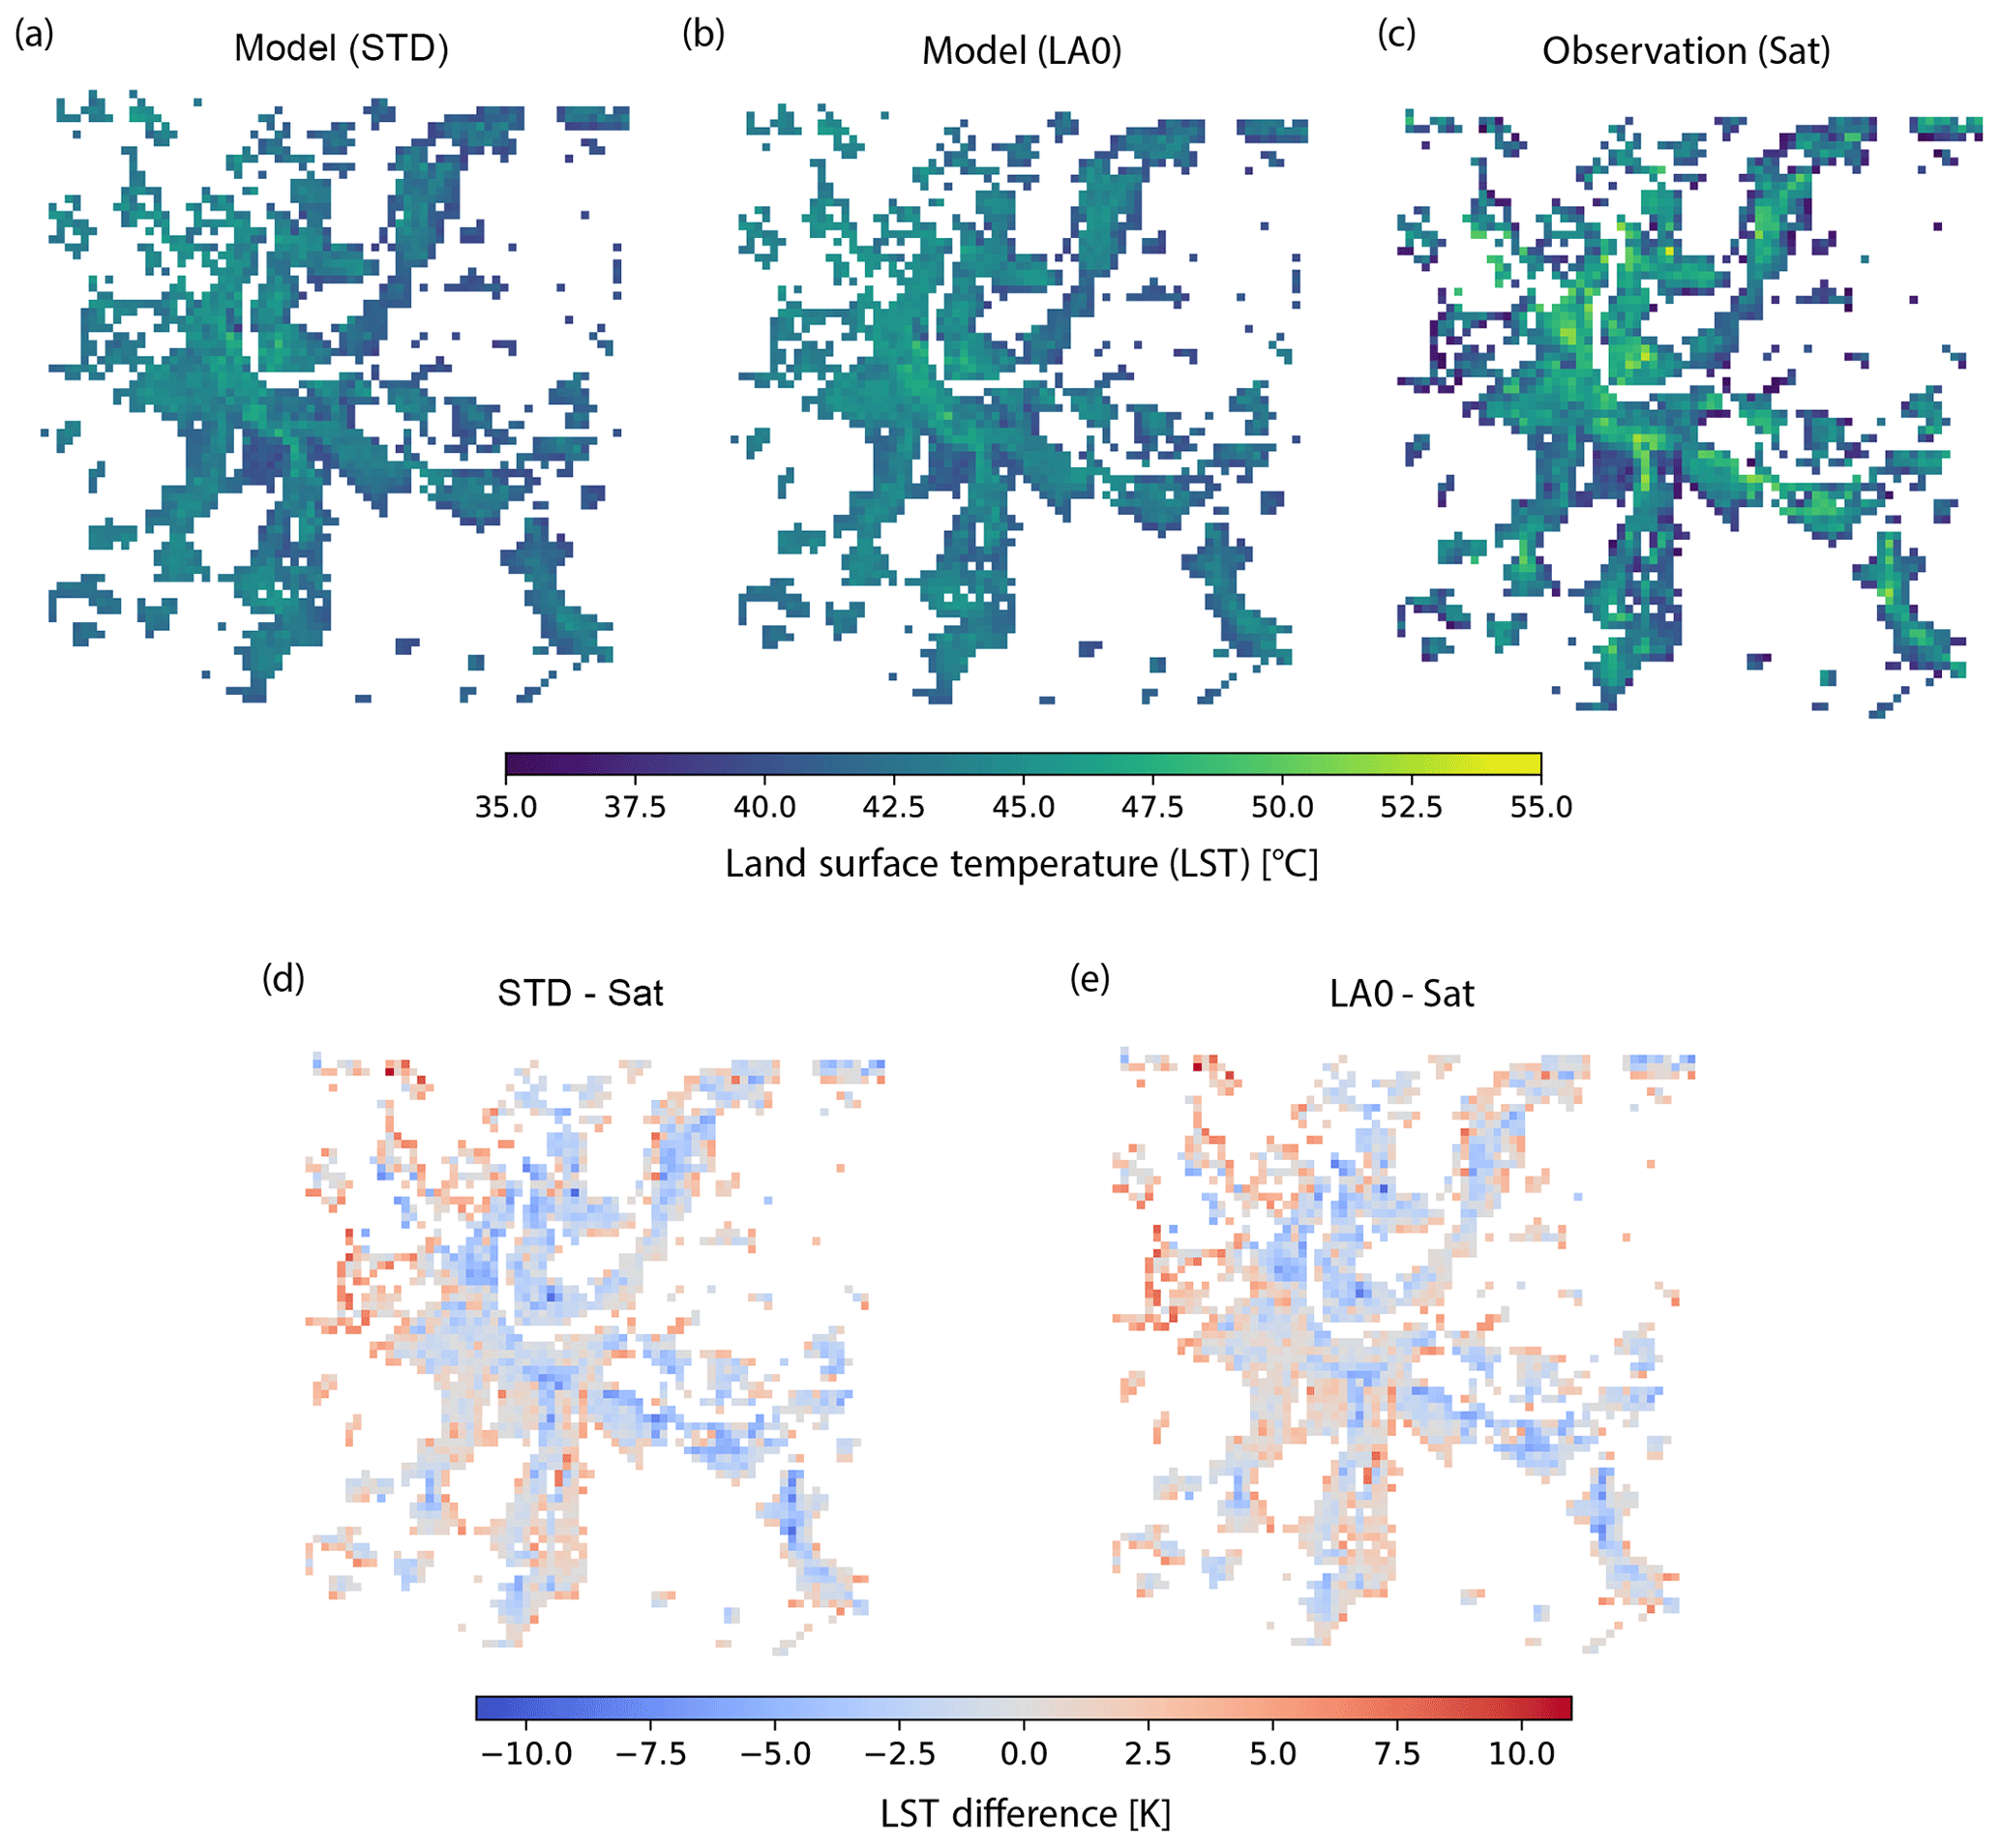
Figure 8Spatial distribution of LST (∘C) on 5 July 2015 at approximately 11:10 local time (LT) (10:10 UTC). Panels (a, b) show the simulated LST with the STD and LA0 configurations, respectively; panel (c) shows the observed LST from the Landsat 7 satellite; panels (d, e) show the LST differences between simulated and observed LST for the STD and LA0 configurations, respectively. Grid cells contaminated by the presence of the river or clouds have been removed.
Table 7RMSEs, MBEs and r2 of the simulated (STD) LST (K) against the Landsat 7 satellite observations on the 5 July 2015 at approximately 11:10 LT (10:10 UTC). In addition to the total RMSEs (T), the systematic (S) and the unsystematic (U) RMSEs are listed. “Urb” represents the comparison only at the urban grid cells (furb>0.1). Grid cells contaminated by water or clouds have been removed.
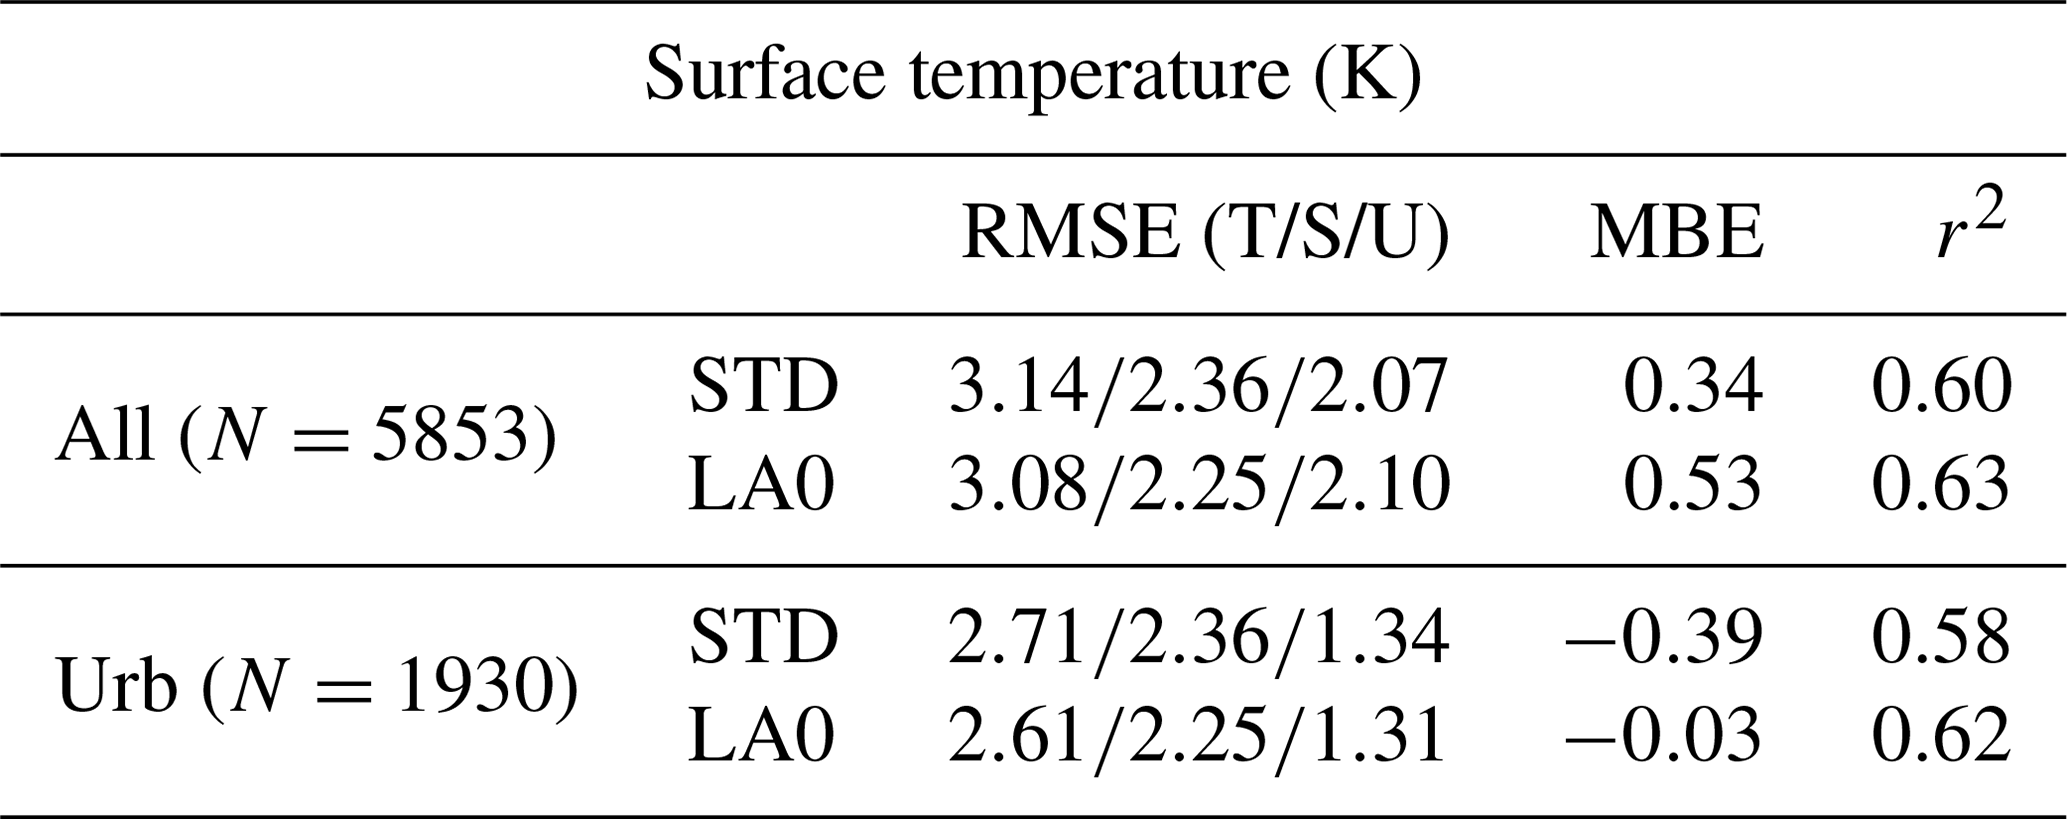
Overall, good agreement between simulations and observations was obtained in terms of the domain averaged model bias and errors. As shown in Fig. 8, the spatial pattern of LST is generally well captured by the model, indicating that the urban and rural land use variations are well represented. However, the model is found to underestimate the maximum LSTs and to overestimate the minimum LSTs at the outskirts of the urban area (Fig. 8d–e). Quantitatively, the model was found to have a small negative bias over the urban area (MBE K for STD) and a small positive bias when considering the entire domain (MBE =0.34 K for STD). The RMSE was found to be lower in the urban area (RMSE =2.71 K for STD) than in the entire domain. However, a relatively large component of RMSE was found to be systematic. The coefficient of determination was found to be quite low (r2=0.58 for STD). Only minor differences between STD and LA0 are seen, with STD being slightly colder over the urban area.
The moderate r2 and the relatively high component of systematic RMSE over urban areas may be explained by the fact that the same material properties (albedo, emissivity, heat capacity and heat conductivity) were used for the whole city. Therefore, spatial variations in material properties, e.g. between industrial and residential buildings, were not represented. This likely limits the model's ability to represent intra-urban gradients of surface temperature and, consequently, the related components such as sensible heat fluxes.
The explicit representation of street trees did not improve the agreement with satellite observations of land surface temperature. However, this observation should be taken with care given that satellite-derived LSTs in urban areas are known to have a large degree of uncertainly due to potential errors in the surface emissivity, sensor and satellite view bias (Voogt and Oke, 2003; Chen et al., 2017). Slight off-nadir view angles can introduce a bias over areas with tall buildings, while LST variations at scales below 500 m may be unresolved (Crawford et al., 2018).
Studies comparing simulated and remotely sensed surface temperatures over cities are rather scarce. We were only able to quantitatively compare our results with the studies of Wouters et al. (2016) and Hu et al. (2014). Other studies only performed a qualitative comparison (Miao et al., 2009; Giannaros et al., 2013; Li and Bou-Zeid, 2013; Ramamurthy et al., 2017). The MBE found in the present study is lower than what was found by Wouters et al. (2016) and Hu et al. (2014) for most of the conditions (different urban fractions and rural). Like the present study, Hu et al. (2014) found a general overestimation of daytime surface temperature in their model, while Wouters et al. (2016) reported an opposite behaviour. Wouters et al. (2016) and Hu et al. (2014) did not use other quantitative statistical metrics. Therefore, a comparison for RMSE and r2 was not possible.
4.4 Model sensitivity to tree parameters
Figure 9 shows the model sensitivity of 2 m air temperature (here Tair), street surface temperature Tstr, specific humidity q and wind speed u to varying values of tree parameters (LA+, LA−, SC+, SC−). The sensitivity Sϕ,i is defined here in relative terms normalised by the amplitude of the difference between a simulation with and without street trees:
where ϕ is a generic scalar field (Tair, Tstr, q, u), represents the spatial and temporal average of the scalar field, and i represents the experiment as in Table 1. Generally, the model was more sensitive to changes in leaf area density (LA+, LA−) than to changes in stomatal conductance (SC+, SC−). During the daytime (10:00–18:00 LT), Tair and Tstr were the variables that were most sensitive to the choices of street tree parameters, whereas u was the least sensitive. At night (21:00–05:00 LT), conversely, the variable with the largest sensitivity was q.
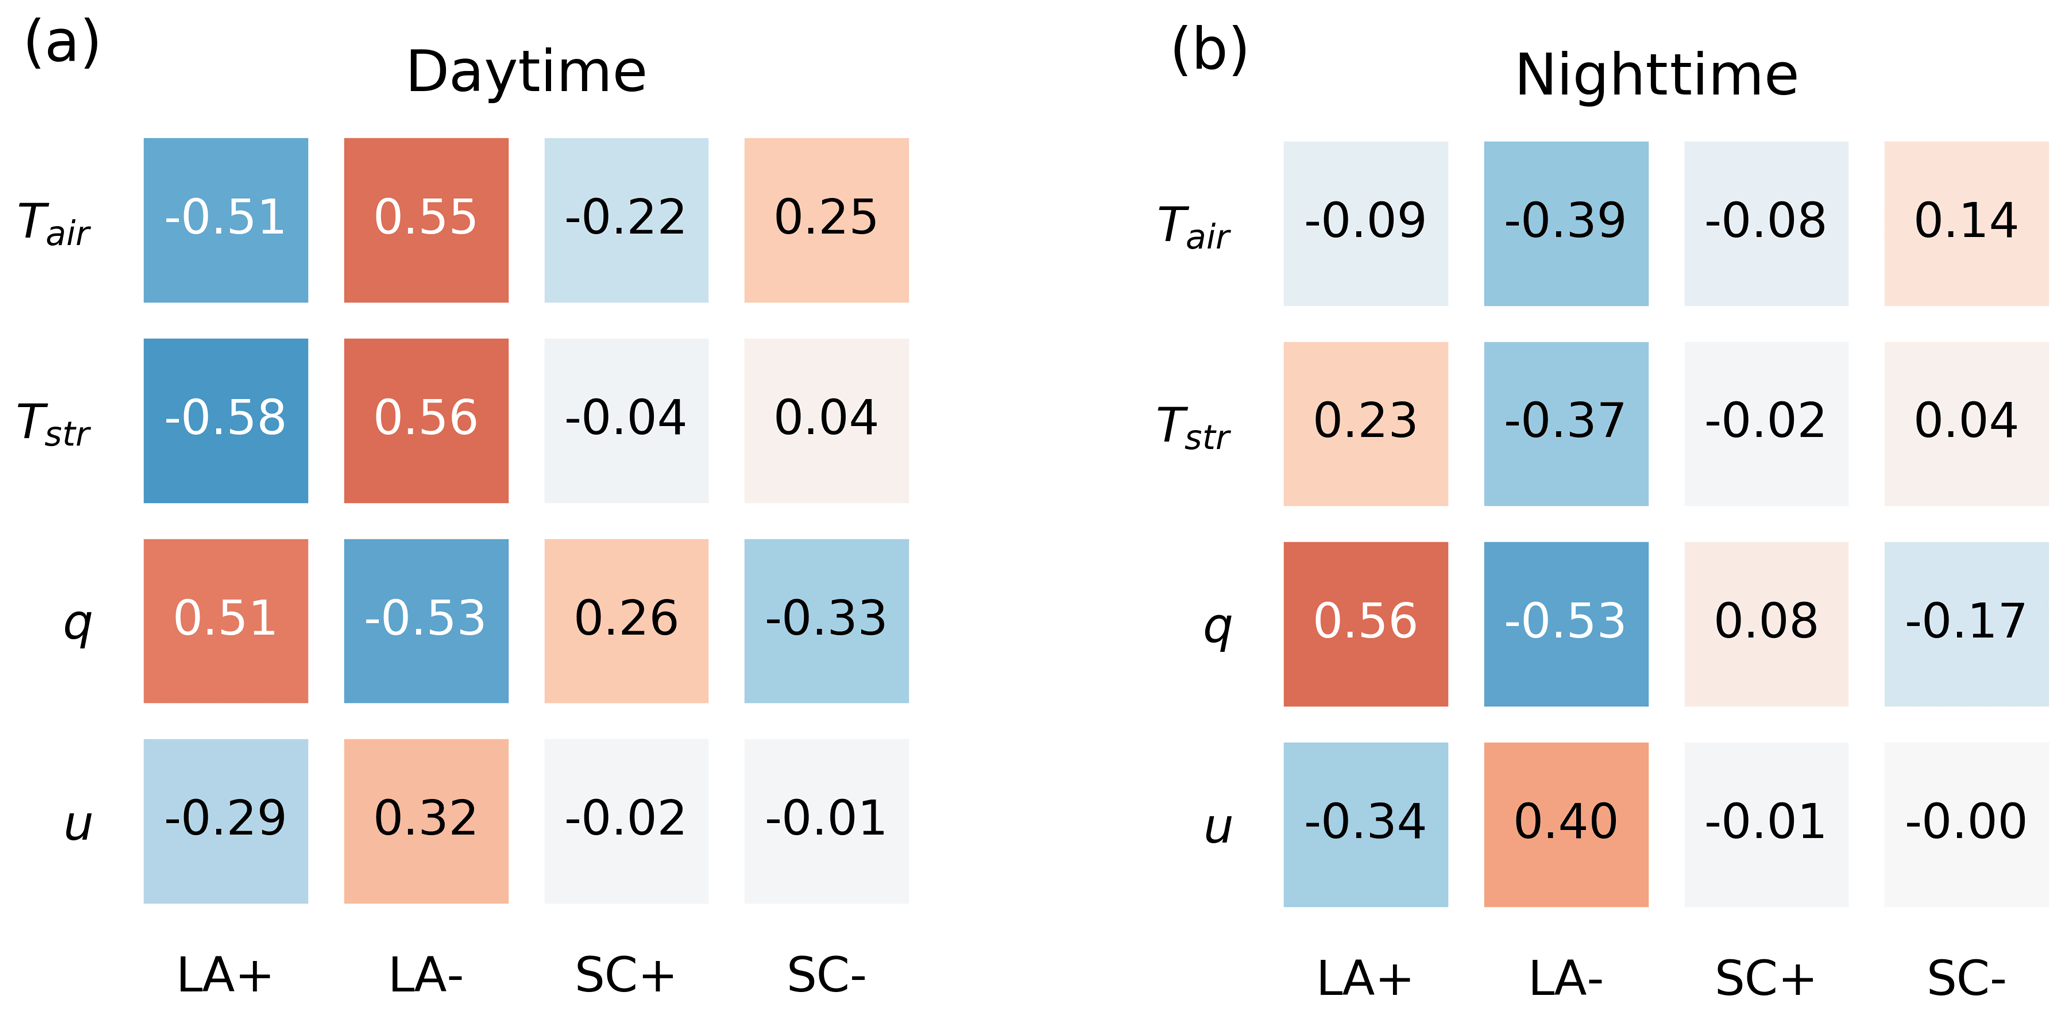
Figure 9Model sensitivity Sϕ of 2 m air temperature Tair, street surface temperature Tstr, specific humidity q and wind speed u to varying values of tree parameters (LA+, LA−, SC+, SC−). Values of S represent a spatial (over all urban grid cells) and temporal (over the whole simulation period) average. Daytime corresponds to 10:00–18:00 LT and nighttime to 21:00–05:00 LT.
An increase in the leaf area density from street trees (LA+) produced a reduction in daytime Tair, Tstr and u, and an increase in q. The reduction in Tair and Tstr can be explained by the increase in interception of short-wave radiation from the denser foliage layer (see Eq. 1) and, consequently, by the reduced amount of short-wave radiation reaching the wall and street surfaces within the canyon. The reduction in u can be explained by the augmented drag force exerted by the denser foliage layer (see Eq. 2). The increase of q can be explained by the larger amount of leaf area available for transpiration (see Eq. 5).
During nighttime, the sensitivity experiment LA+ produced a marked increase in q and Tstr. Tair remained approximately constant, while u decreased. The responses of q and u follow the same mechanisms of the daytime response. The response of Tstr, in contrast, is opposite to its daytime response. At night, enhanced interception of long-wave radiation emitted from the internal surfaces of the canyon (walls and street) with increased leaf area density reduces the cooling of the street surface. Although enhanced tree foliage cools the street surfaces during the day due to shading, the heat capacity and corresponding thermal inertia of the street surfaces seem to be not sufficient to carry over this effect into the nighttime to compensate for the reduced long-wave radiative cooling. Such an increase in nighttime surface temperatures due to street trees, although somewhat counterintuitive, has in fact been reported previously in observation-based studies (e.g. Shashua-Bar et al., 2009; Coutts et al., 2016).
A reduction in the leaf area density (LA−) generally produced an opposite response to that of an increase in leaf area density (LA+). An interesting exception is the reduction of Tair at night, suggesting that different processes with opposing sensitivities to values of LAD are at work. The largest nighttime reduction in Tair was achieved with LA−, which was associated with a similar reduction in Tstr. A slight reduction in Tair, however, was also found for LA+, which contrasts with an increase in Tstr for this scenario. This points towards complex, non-linear interactions between the different effects of LAD on radiation and winds. However, further studies are needed to corroborate this finding.
An increase in the stomatal conductance (SC+) produced an increase in daytime q and a decrease in Tair. A decrease (SC−) produced an opposite response. These effects are due to an increase in the source of moisture (see Eq. 5) and latent heat flux QE (see Eq. 4) as a response to the larger value of stomatal conductance gs. The increase in QE causes a reduction in QH that consequently impacts Tair. Tstr and u were found to be insensitive to changes in the stomatal conductance. This is expected since, in contrast to leaf area density, stomatal conductance has no influence on short-wave radiation or drag. During nighttime, the model was found to be rather insensitive to changes in stomatal conductance. This is not surprising given the low value of nighttime stomatal conductance in the standard run (STD).
We acknowledge that there are a number of potential limitations in the current model system that need to be addressed in future studies.
BEP-Tree, and therefore COSMO-BEP-Tree, employs a rather simplistic stomata model for representing the transpiration from street trees. In particular, constant and spatially homogeneous values of daytime and nighttime stomatal conductance were employed ignoring the potentially important impact of water scarcity and the dependence on environmental conditions (e.g. air temperature and solar irradiation). In order to improve the representation of the transpiration from street trees and therefore the modelling of the associated latent heat fluxes, a mechanistic stomata model (e.g. Damour et al., 2010) will have to be implemented. Furthermore, to properly represent soil water scarcity during extended drought periods, an urban hydrology module should be developed and coupled to COSMO-BEP-Tree (e.g. Järvi et al., 2011; Yang et al., 2015; Stavropulos-Laffaille et al., 2018).
In this study, a homogeneous and constant value of the clumping index (Ω) was used. The value was chosen from a measurement over a natural environment that resembles the urban environment in terms of openness and heterogeneity of the tree canopy. In order to improve urban climate simulations with street trees, a methodology to estimate the spatial distribution of Ω over urban environments needs to be established. A future implementation of the clumping effects should also consider the temporal changes of Ω with the solar zenith angle (Ryu et al., 2016).
The coupling approach employed in this work to link COSMO-CLM and BEP-Tree is based on model integration (also called joint coupling by Brandmeyer and Karimi, 2000) rather than on an independent coupler. The model integration approach has the advantage of maximising the computational performance by reducing the information exchanged. As a drawback, it does not support independent model updates. In other words, every update in the stand-alone version of each individual model (COSMO-CLM and BEP-Tree) potentially requires additional effort in rebuilding the coupled version. In order to allow flexible coupling between future versions of COSMO-CLM and BEP-Tree, the use of a coupler would be interesting. As an example, COSMO-CLM has been already used with the OASIS coupler (Craig et al., 2017) to couple with different land surface models (Will et al., 2017).
Even if it is generally comparable with other models, the performance of COSMO-BEP-Tree still has room for improvements. The model evaluation against urban flux tower measurements revealed a systematic underestimation of specific humidity (q). The source of this bias needs to be better investigated by, for instance, (a) analysing the soil moisture content and (b) evaluating q at the model boundaries provided by another model. The model evaluation reveals an overestimation of nighttime air temperature above the urban canopy layer, which can be due to the use of default values of material properties. Additionally, the 2 m air temperature is overestimated at the rural sites, especially at night. Besides previous studies where this bias was attributed only to the misrepresentation of stable boundary layer conditions (Mussetti et al., 2020), the present study provides new evidence that points out an underestimation of albedo over rural areas. Future studies need to address this issue, which partially limits the model's ability to represent the urban heat island effect. Potential solutions include the use of more advanced representations of albedo, already available as options in COSMO-CLM, with explicit consideration of vegetation type or satellite-based albedo values (Tölle et al., 2018). With respect to the representation of stable boundary layer conditions, more recent versions of the COSMO model (from version 5.4a onward) promise better performance thanks to a revised turbulence scheme.
In the current study, spatially homogeneous values of material properties of roof, wall and street elements were used. Therefore, the impact of the spatial variation of material properties between areas with different building types (e.g. old town vs. industrial areas) could not be reproduced. Further versions of UCPgenerator need to consider different urban classes with distinct material properties. This could be achieved, for example, by making use of the data from the World Urban Database and Access Portal Tools (WUDAPT; Ching et al., 2018). It has to be noted that the model resolution in this study falls within the so-called “grey zone” or “terra incognita” (Wyngaard, 2004), a condition where the horizontal grid spacing and hence the spatial filter used on the equations of motion are of the same order of the energy- and flux-containing turbulence. This may produce a misrepresentation in the turbulence and wind speed patterns (Efstathiou and Beare, 2015). High-resolution urban climate studies reported the formation of horizontal convective rolls which have an unclear counterpart in the real atmosphere (Salamanca et al., 2012; Gutiérrez et al., 2015). Although such issues were not visible in this application, these aspects need to be considered in future studies, for example, by exploring the performance of new scale-aware turbulence models (Ito et al., 2015; Shin and Hong, 2015, e.g.) or large-eddy-simulation schemes as recently developed for the COSMO model (Panosetti et al., 2016).
An urban climate model with explicit representation of street trees was developed featuring a two-way coupling between the vegetated urban canopy model BEP-Tree (Krayenhoff et al., 2020) and the mesoscale weather and climate model COSMO-CLM (COSMO, 2019). The coupled model, named COSMO-BEP-Tree, mechanistically represents the heat, momentum, turbulence and moisture interactions between street trees, urban elements and the atmosphere during realistic weather and climate simulations. COSMO-BEP-Tree comes with a tool to pre-process all data required by BEP-Tree in addition to the standard inputs for COSMO.
The model's performance and applicability were demonstrated for the urban area of Basel during a 3-week heatwave event in June–July 2015. The model evaluation made use of measurements from an urban flux tower, a network of surface stations and land surface temperature observations from the Landsat 7 satellite. The application demonstrated that the model successfully captures essential features of the urban heat island during such a heatwave event and that city-wide interactions between street trees, urban elements and the atmosphere are represented in a realistic way.
In particular, the model captured the day-to-day evolution as well as the mean diurnal evolution of air temperature, relative humidity, wind speed, sensible and latent heat fluxes relatively well at all observation sites. The comparison with measurements above the urban canopy layer revealed very small model biases and errors for air temperature, wind speed, sensible and latent heat fluxes. The model underestimated the specific humidity and slightly overestimated wind speed in the afternoon.
The comparison with measurements of air temperature within the urban canopy layer (T2 m) revealed generally good model performance. At rural sites, the model showed an overestimation of T2 m as already reported in previous urban climate studies using the COSMO model. The model was able to reproduce the diurnal cycle of the canopy layer UHI effect generally well, although its magnitude was underestimated during nighttime. This issue was largely due to the warm nighttime bias at the rural reference site. At the most urban site, this difference is additionally explained by an overestimation of the nighttime temperature.
In terms of the spatial pattern of the LST, the model was found to have a relatively small RMSE and very small MBE compared to the satellite observations. However, the spatial variability over the urban area and especially some local peaks in LST were not fully captured by the model, which could be related to the use of spatially homogeneous material properties. Nevertheless, it should be noted that satellite LSTs in urban areas are associated with a large degree of uncertainty.
The inclusion of street trees in the model generally improved the performance against observations of QH, u, q and QE. In the case of T2 m, this was found only at some evaluation sites. The representation of street trees had a large effect on sensible and latent heat fluxes and wind speed but only a minor influence on specific humidity and air temperature above the urban canopy layer. Street trees were found to reduce QH and u, and to increase q and QE. Within the canopy layer, a slight decrease in T2 m during the daytime was found when including street trees and a very small increase in T2 m during nighttime. This behaviour is in agreement with measurement studies over street canyons with trees (Shashua-Bar et al., 2009; Coutts et al., 2016). In terms of UHI intensity, this results in a slight reduction during the daytime and a very small increase during nighttime.
The model responded realistically to changes in the street tree parameters: leaf area density and stomatal conductance. During the daytime, a 50 % increase in leaf area density produced a reduction in air temperature, street temperature and wind, and an increase in humidity. At night, the same 50 % increase in street tree density produced mainly an increase in humidity. A 50 % increase in stomatal conductance produced an increase in humidity and a decrease in air temperature.
This study demonstrates the ability of COSMO-BEP-Tree to simulate the impact of street trees for whole cities in a realistic way, by considering the multiple interactions between trees, urban elements and the atmosphere from the scale of individual street canyons to the scale of regional weather patterns. By including the effect of street trees, COSMO-BEP-Tree significantly enhances the modelling capabilities with respect to its predecessor COSMO-DCEP, adding an important dimension to the study of UHI mitigation and climate change adaptation strategies. Furthermore, the improved agreement with observations clearly underlines the importance of considering street trees in such simulations.
UCPgenerator v1.0 is a Python programme that generates the additional input fields required by COSMO-BEP-Tree (Mussetti, 2019b). The list of the additional input field required by COSMO-BEP-Tree is provided in Table A1.
First of all, the urban fraction furb, defined as the planar fraction of urban surfaces in a model grid cell, is estimated from the given imperviousness dataset (see Sect. 2.4 for further details). A threshold method is used estimate the average urban fraction in the COSMO-BEP-Tree grid cell (function urbfrac). urbfrac also performs the reference system transformation.
Table A1Urban canopy parameters required as input to COSMO-BEP-Tree.
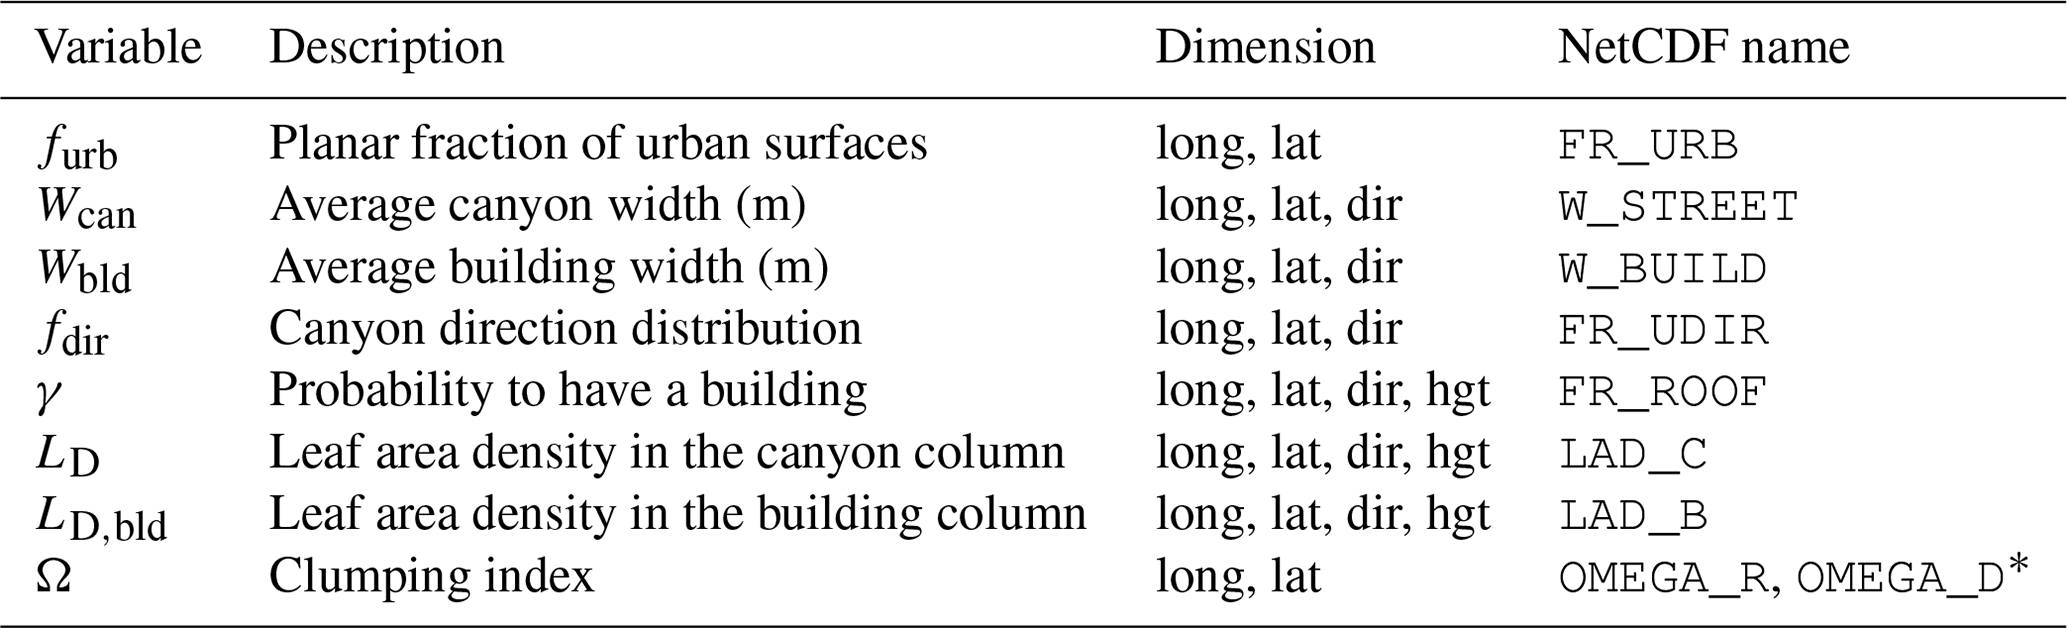
* BEP-Tree gives the option to define a separate clumping coefficient for the drag and turbulence parameterisations.
The parameters that characterise the canyon geometry are then estimated in the function cangeom from the building dataset. Planar and frontal area density are calculated according to Grimmond and Oke (1999) as
and
where λp is the planar area density, λf is the frontal area density, is the plan area of building elements, is the total horizontal surface area, and is the frontal area of building elements. Canyon and building widths are calculated according to Martilli (2009) as
and
where Wcan is the canyon width (m), Wbld is the building width (m), and h is the average building height (m).
Each building in the building dataset is clustered according to height and direction classes that can be set by the user through the namelist of COSMO-BEP-Tree. The vertical distribution of buildings γ and the distribution of canyon directions fdir are determined from the above-mentioned clustering.
The subroutine veget finally computes the grid-cell-averaged values of LD,can and LD,nat. It is designed to read as input a lidar-based dataset containing the height distribution of street trees. Making assumptions on the specific leaf area density inside an average tree (LD,loc), the routine calculates the total LD in each model grid cell. If a dataset of all trees (e.g. including trees in parks) is available, the subroutine identifies the street trees by using furb. Specifically, trees located over mostly impervious surfaces (furb>0.5) are classified as street trees (contributing to LD,can). The rest of the trees are classified as natural trees and contribute to LD,nat. The routine also supports user-defined modifications to the LD to simulated greening or clearing scenarios. UCPgenerator v1.0 requires the 3-D building dataset to be in the format of Esri shapefiles (.shp) with a level of detail (LoD) of 1. In LoD 1 datasets, buildings are represented as prismatic blocks without information on the roof structure (Kolbe et al., 2005).
COSMO-CLM is freely available for scientific use to the members of the CLM community. The code of COSMO-BEP-Tree is made freely available to any user with a valid CLM community membership. All research data and scripts to produce figures and analysis are archived on Zenodo (https://doi.org/10.5281/zenodo.3377392, Mussetti, 2019a). UCPgenerator v1.0 can be downloaded from the GitHub repository (https://doi.org/10.5281/zenodo.3352214, Mussetti, 2019b). The LUCY model, used to calculate the anthropogenic heat flux, can be downloaded from https://doi.org/10.17864/1947.149 (Grimmond et al., 2018). BEP-Tree as a stand-alone model is available in Krayenhoff et al. (2020). MODTRAN is a commercial software (Berk et al., 2014).
The supplement related to this article is available online at: https://doi.org/10.5194/gmd-13-1685-2020-supplement.
GM conceived the work, performed the simulations and analysed the results. SH and GM implemented the coupling between COSMO and BEP-Tree. GM, DB, SH and ESK interpreted the results. ESK and SS provided the source codes of BEP-Tree and COSMO-DCEP, respectively. CF, RV and AW provided some of the input data and observations. DB, SH, JA and JC supervised the work. GM wrote the manuscript with contributions from all the co-authors.
The authors declare that they have no conflict of interest.
The Center for Climate Systems Modeling (C2SM) at ETH Zurich is acknowledged for providing technical and scientific support. We thank the MCR Lab of the University of Basel, the environmental agency of Basel, the environmental agency of Alsace and MeteoSwiss for providing meteorological observations. MeteoSwiss is also acknowledged for providing the meteorological analysis. The Landsat 7 image is courtesy of the US Geological Survey. The use of Empa's computational resources is greatly acknowledged. We thank Dominik Strebel for his work on the building dataset. We thank Arthur Gessler and Harald Bugmann for discussions about the values of stomatal conductance. We thank the two anonymous reviewers for their valuable comments.
This research has been supported by the Swiss Federal Laboratories for Materials Science and Technology (Empa).
This paper was edited by Leena Järvi and reviewed by two anonymous referees.
Abreu, L. and Anderson, G.: The MODTRAN 2/3 report and LOWTRAN 7 model, Contract, 19628, 0132, Phillips Laboratory, 1996. a
Allen, L., Lindberg, F., and Grimmond, C.: Global to city scale urban anthropogenic heat flux: model and variability, Int. J. Climatol., 31, 1990–2005, https://doi.org/10.1002/joc.2210, 2011. a
Alonzo, M., Bookhagen, B., and Roberts, D. A.: Urban tree species mapping using hyperspectral and lidar data fusion, Remote Sens. Environ., 148, 70–83, https://doi.org/10.1016/j.rse.2014.03.018, 2014. a, b
Alonzo, M., Bookhagen, B., McFadden, J. P., Sun, A., and Roberts, D. A.: Mapping urban forest leaf area index with airborne lidar using penetration metrics and allometry, Remote Sens. Environ., 162, 141–153, https://doi.org/10.1016/j.rse.2015.02.025, 2015. a
Armson, D., Stringer, P., and Ennos, A.: The effect of tree shade and grass on surface and globe temperatures in an urban area, Urban For. Urban Gree., 11, 245–255, https://doi.org/10.1016/j.ufug.2012.05.002, 2012. a, b
Asawa, T., Kiyono, T., and Hoyano, A.: Continuous measurement of whole-tree water balance for studying urban tree transpiration, Hydrol. Process., 31, 3056–3068, https://doi.org/10.1002/hyp.11244, 2017. a, b
Baldauf, M., Seifert, A., Förstner, J., Majewski, D., Raschendorfer, M., and Reinhardt, T.: Operational convective-scale numerical weather prediction with the COSMO model: description and sensitivities, Mon. Weather Rev., 139, 3887–3905, https://doi.org/10.1175/MWR-D-10-05013.1, 2011. a
Baldridge, A., Hook, S., Grove, C., and Rivera, G.: The ASTER spectral library version 2.0, Remote Sens. Environ., 113, 711–715, https://doi.org/10.1016/j.rse.2008.11.007, 2009. a
Basel-Stadt, S. A. K.: Monatlicher Energieverbrauch, available at: http://www.statistik.bs.ch/zahlen/tabellen/8-energie.html, last access: 31 March 2020. a
Berk, A., Conforti, P., Kennett, R., Perkins, T., Hawes, F., and Van Den Bosch, J.: MODTRAN® 6: A major upgrade of the MODTRAN® radiative transfer code, in: 2014 6th Workshop on Hyperspectral Image and Signal Processing: Evolution in Remote Sensing (WHISPERS), IEEE, 1–4, https://doi.org/10.1109/WHISPERS.2014.8077573, 2014. a, b
Bowler, D. E., Buyung-Ali, L., Knight, T. M., and Pullin, A. S.: Urban greening to cool towns and cities: A systematic review of the empirical evidence, Landscape Urban Plan., 97, 147–155, https://doi.org/10.1016/j.landurbplan.2010.05.006, 2010. a
Brandmeyer, J. E. and Karimi, H. A.: Coupling methodologies for environmental models, Environ. Modell. Softw., 15, 479–488, https://doi.org/10.1016/S1364-8152(00)00027-X, 2000. a, b
Branson, S., Wegner, J. D., Hall, D., Lang, N., Schindler, K., and Perona, P.: From Google Maps to a fine-grained catalog of street trees, ISPRS J. Photogramm., 135, 13–30, https://doi.org/10.1016/j.isprsjprs.2017.11.008, 2018. a
Brown de Colstoun, E. C., Huang, C., Wang, P., Tilton, J. C., Tan, B., Phillips, J., Niemczura, S., Ling, P.-Y., and Wolfe, R. E.: Global Man-made Impervious Surface (GMIS) Dataset From Landsat, Palisades, NY, NASA Socioeconomic Data and Applications Center (SEDAC), https://doi.org/10.7927/H4P55KKF, 2017. a
Buzzi, M., Rotach, M. W., Holtslag, M., and Holtslag, A. A.: Evaluation of the COSMO-SC turbulence scheme in a shear-driven stable boundary layer, Meteorol. Z., 20, 335–350, https://doi.org/10.1127/0941-2948/2011/0050, 2011. a
Campbell, G. S. and Norman, J. M.: An introduction to environmental biophysics, Springer Science & Business Media, 2012. a, b
CCLM-Community: Climate Limited-area Modelling Community, available at: https://www.clm-community.eu/, last access: 31 March 2020. a
Center for International Earth Science Information Network – CIESIN – Columbia University, International Food Policy Research Institute – IFPRI, The World Bank, and Centro Internacional de Agricultura Tropical – CIAT. 2011: Global rural-urban mapping project, version 1 (GRUMPv1): urban extents grid, https://doi.org/10.7927/H4GH9FVG, 2011. a
Cerenzia, I.: Challenges and Critical Aspects in Stable Boundary Layer Representation in Numerical Weather Prediction Modeling: Diagnostic Analyses and Proposals for Improvement, PhD thesis, Alma Mater Studiorum Università di Bologna, https://doi.org/10.6092/unibo/amsdottorato/8067, 2017. a
Chen, F., Kusaka, H., Bornstein, R., Ching, J., Grimmond, C., Grossman-Clarke, S., Loridan, T., Manning, K. W., Martilli, A., Miao, S., Sailor, D., Salamanca, F. P., Taha, H., Tewari, M., Wang, X., Wyszogrodzki, A. A., and Zhang, C.: The integrated WRF/urban modelling system: development, evaluation, and applications to urban environmental problems, Int. J. Climatol., 31, 273–288, https://doi.org/10.1002/joc.2158, 2011a. a
Chen, F., Yang, S., Yin, K., and Chan, P.: Challenges to quantitative applications of Landsat observations for the urban thermal environment, J. Environ. Sci., 59, 80–88, https://doi.org/10.1016/j.jes.2017.02.009, 2017. a, b
Chen, L., Zhang, Z., Li, Z., Tang, J., Caldwell, P., and Zhang, W.: Biophysical control of whole tree transpiration under an urban environment in Northern China, J. Hydrol., 402, 388–400, https://doi.org/10.1016/j.jhydrol.2011.03.034, 2011b. a
Ching, J., Mills, G., Bechtel, B., See, L., Feddema, J., Wang, X., Ren, C., Brousse, O., Martilli, A., Neophytou, M., Mouzourides, P., Stewart, I., Hanna, A., Ng, E., Foley, M., Alexander, P., Aliaga, D., Niyogi, D., Shreevastava, A., Bhalachandran, P., Masson, V., Hidalgo, J., Fung, J., Andrade, M., Baklanov, A., Dai, W., Milcinski, G., Demuzere, M., Brunsell, N., Pesaresi, M., Miao, S., Mu, Q., Chen, F., and Theeuwes, N.: WUDAPT: An urban weather, climate, and environmental modeling infrastructure for the anthropocene, B. Am, Meteorol, Soc,, 99, 1907–1924, https://doi.org/10.1175/BAMS-D-16-0236.1, 2018. a
Christen, A.: Atmospheric turbulence and surface energy exchange in urban environments: results from the Basel Urban Boundary Layer Experiment (BUBBLE), PhD thesis, University of Basel, https://doi.org/10.5451/unibas-003631734, 2005. a
Coll, C., Galve, J. M., Sanchez, J. M., and Caselles, V.: Validation of Landsat-7/ETM+ thermal-band calibration and atmospheric correction with ground-based measurements, IEEE T. Geosci. Remote, 48, 547–555, https://doi.org/10.1109/TGRS.2009.2024934, 2010. a
COSMO: Consortium for Small-scale Modeling, available at: http://www.cosmo-model.org/ (last access: 31 March 2020), 2019. a, b, c
Coutts, A. M., White, E. C., Tapper, N. J., Beringer, J., and Livesley, S. J.: Temperature and human thermal comfort effects of street trees across three contrasting street canyon environments, Theor. Appl. Climatol., 124, 55–68, https://doi.org/10.1007/s00704-015-1409-y, 2016. a, b, c
Craig, A., Valcke, S., and Coquart, L.: Development and performance of a new version of the OASIS coupler, OASIS3-MCT_3.0, Geosci. Model Dev., 10, 3297–3308, https://doi.org/10.5194/gmd-10-3297-2017, 2017. a
Crawford, B., Grimmond, S. B., Gabey, A., Marconcini, M., Ward, H. C., and Kent, C. W.: Variability of urban surface temperatures and implications for aerodynamic energy exchange in unstable conditions, Q. J. Roy. Meteor. Soc., 144, 1719–1741, https://doi.org/10.1002/qj.3325, 2018. a
Damour, G., Simonneau, T., Cochard, H., and Urban, L.: An overview of models of stomatal conductance at the leaf level, Plant Cell Environ., 33, 1419–1438, https://doi.org/10.1111/j.1365-3040.2010.02181.x, 2010. a
Davin, E. L., Stöckli, R., Jaeger, E. B., Levis, S., and Seneviratne, S. I.: COSMO-CLM 2: a new version of the COSMO-CLM model coupled to the Community Land Model, Clim. Dynam., 37, 1889–1907, https://doi.org/10.1007/s00382-011-1019-z, 2011. a
De Munck, C., Lemonsu, A., Masson, V., Le Bras, J., and Bonhomme, M.: Evaluating the impacts of greening scenarios on thermal comfort and energy and water consumptions for adapting Paris city to climate change, Urban Climate, 23, 260–286, https://doi.org/10.1016/j.uclim.2017.01.003, 2018. a, b
De Rosnay, P., Drusch, M., Vasiljevic, D., Balsamo, G., Albergel, C., and Isaksen, L.: A simplified Extended Kalman Filter for the global operational soil moisture analysis at ECMWF, Q. J. Roy. Meteor. Soc., 139, 1199–1213, https://doi.org/10.1002/qj.2023, 2013. a
Dong, B., Sutton, R., Shaffrey, L., and Wilcox, L.: The 2015 European heat wave, B. Am. Meteorol. Soc., 97, S57–S62, https://doi.org/10.1175/BAMS-D-16-0140.1, 2016. a
Dupont, S., Otte, T. L., and Ching, J. K.: Simulation of meteorological fields within and above urban and rural canopies with a mesoscale model, Bound.-Lay. Meteorol., 113, 111–158, https://doi.org/10.1023/B:BOUN.0000037327.19159.ac, 2004. a, b, c
EEA: Copernicus Land Monitoring Service – High Resolution Layers – Imperviousness, available at: https://www.eea.europa.eu/ds_resolveuid/DAT-14-en (last access: 31 March 2020), 2015. a, b
Efstathiou, G. and Beare, R. J.: Quantifying and improving sub-grid diffusion in the boundary-layer grey zone, Q. J. Roy. Meteor. Soc., 141, 3006–3017, https://doi.org/10.1002/qj.2585, 2015. a
FAO, IIASA, ISRIC, ISS-CAS, and JRC: Harmonized World Soil Database (version 1.1), available at: http://www.fao.org/soils-portal/soil-survey/soil-maps-and-databases/harmonized-world-soil-database-v12/en/ (last access: 31 March 2020), 2009. a
Federal Office of Topography, S. C.: swissBUILDINGS3D 1.0, available at: https://shop.swisstopo.admin.ch/en/products/landscape/build3D (last access: 31 March 2020), 2007. a
Feigenwinter, C., Vogt, R., and Christen, A.: Eddy covariance measurements over urban areas, in: Eddy Covariance, Springer, 377–397, https://doi.org/10.1007/978-94-007-2351-1_16, 2012. a
Feigenwinter, C., Vogt, R., Parlow, E., Lindberg, F., Marconcini, M., Del Frate, F., and Chrysoulakis, N.: Spatial Distribution of Sensible and Latent Heat Flux in the City of Basel (Switzerland), IEEE J. Sel. Top. Appl., 11, 2717–2723, https://doi.org/10.1109/JSTARS.2018.2807815, 2018. a, b
Geoportal Kanton Basel-Stadt: available at: https://www.geo.bs.ch/ (last access: 31 March 2020), 2019. a, b, c
Giannaros, T. M., Melas, D., Daglis, I. A., Keramitsoglou, I., and Kourtidis, K.: Numerical study of the urban heat island over Athens (Greece) with the WRF model, Atmos. Environ., 73, 103–111, https://doi.org/10.1016/j.atmosenv.2013.02.055, 2013. a
Green, S.: Radiation balance, transpiration and photosynthesis of an isolated tree, Agr. Forest Meteorol., 64, 201–221, https://doi.org/10.1016/0168-1923(93)90029-H, 1993. a
Grell, G. A., Dudhia, J., and Stauffer, D. R.: A description of the fifth-generation Penn State/NCAR Mesoscale Model (MM5), NCAR/TN-398, NCAR Techincal Note, 1994. a
Grimmond, C. and Oke, T. R.: Aerodynamic properties of urban areas derived from analysis of surface form, J. Appl. Meteorol., 38, 1262–1292, https://doi.org/10.1175/1520-0450(1999)038<1262:APOUAD>2.0.CO;2, 1999. a
Grimmond, C., Blackett, M., Best, M., Baik, J.-J., Belcher, S., Beringer, J., Bohnenstengel, S., Calmet, I., Chen, F., Coutts, A., Dandou, A., Fortuniak, K., Gouvea, M. L.. Hamdi, R., Hendry, M., Kanda, M., Kawai, T., Kawamoto, Y., Kondo, H., Krayenhoff, E. S., Lee, S.‐H., Loridan, T., Martilli, A., Masson, V., Miao, S., Oleson, K., Ooka, R., Pigeon, G., Porson, A., Ryu, Y.‐H., Salamanca, F., Steeneveld, G.J., Tombrou, M., Voogt, J. A., Young, D. T., and Zhang, N.: Initial results from Phase 2 of the international urban energy balance model comparison, Int. J. Climatol., 31, 244–272, https://doi.org/10.1002/joc.2227, 2011. a, b, c
Grimmond, S., Lindberg, F., Allen, L., Yogeswaran, N., and Kotthaus, S.: LUCY: Large scale Urban Consumption of Energy, University of Reading, Software, https://doi.org/10.17864/1947.149, 2018. a
Gromke, C., Blocken, B., Janssen, W., Merema, B., van Hooff, T., and Timmermans, H.: CFD analysis of transpirational cooling by vegetation: Case study for specific meteorological conditions during a heat wave in Arnhem, Netherlands, Build. Environ., 83, 11–26, https://doi.org/10.1016/j.buildenv.2014.04.022, 2015. a
Grossman-Clarke, S., Schubert, S., and Fenner, D.: Urban effects on summertime air temperature in Germany under climate change, Int. J. Climatol., 37, 905–917, https://doi.org/10.1002/joc.4748, 2017. a
Gunawardena, K., Wells, M., and Kershaw, T.: Utilising green and bluespace to mitigate urban heat island intensity, Sci. Total Environ., 584, 1040–1055, https://doi.org/10.1016/j.scitotenv.2017.01.158, 2017. a
Gutiérrez, E., González, J. E., Martilli, A., Bornstein, R., and Arend, M.: Simulations of a heat-wave event in New York City using a multilayer urban parameterization, J. Appl. Meteorol. Clim., 54, 283–301, https://doi.org/10.1175/JAMC-D-14-0028.1, 2015. a
Hollinger, D. and Richardson, A.: Uncertainty in eddy covariance measurements and its application to physiological models, Tree Physiol., 25, 873–885, https://doi.org/10.1093/treephys/25.7.873, 2005. a
Hu, L., Brunsell, N. A., Monaghan, A. J., Barlage, M., and Wilhelmi, O. V.: How can we use MODIS land surface temperature to validate long-term urban model simulations?, J. Geophys. Res.-Atmos., 119, 3185–3201, https://doi.org/10.1002/2013JD021101, 2014. a, b, c, d
Hu, L., Monaghan, A., Voogt, J. A., and Barlage, M.: A first satellite-based observational assessment of urban thermal anisotropy, Remote Sens. Environ., 181, 111–121, https://doi.org/10.1016/j.rse.2016.03.043, 2016. a
Ionita, M., Tallaksen, L. M., Kingston, D. G., Stagge, J. H., Laaha, G., Van Lanen, H. A. J., Scholz, P., Chelcea, S. M., and Haslinger, K.: The European 2015 drought from a climatological perspective, Hydrol. Earth Syst. Sci., 21, 1397–1419, https://doi.org/10.5194/hess-21-1397-2017, 2017. a
Ito, J., Niino, H., Nakanishi, M., and Moeng, C.-H.: An extension of the Mellor–Yamada model to the terra incognita zone for dry convective mixed layers in the free convection regime, Bound.-Lay. Meteorol., 157, 23–43, https://doi.org/10.1007/s10546-015-0045-5, 2015. a
Järvi, L., Grimmond, C., and Christen, A.: The surface urban energy and water balance scheme (SUEWS): Evaluation in Los Angeles and Vancouver, J. Hydrol., 411, 219–237, https://doi.org/10.1016/j.jhydrol.2011.10.001, 2011. a
Järvi, L., Rannik, Ü., Kokkonen, T. V., Kurppa, M., Karppinen, A., Kouznetsov, R. D., Rantala, P., Vesala, T., and Wood, C. R.: Uncertainty of eddy covariance flux measurements over an urban area based on two towers, Atmos. Meas. Tech., 11, 5421–5438, https://doi.org/10.5194/amt-11-5421-2018, 2018. a
Keel, S. G., Pepin, S., Leuzinger, S., and Körner, C.: Stomatal conductance in mature deciduous forest trees exposed to elevated CO2, Trees, 21, 151, https://doi.org/10.1007/s00468-006-0106-y, 2007. a
Klingberg, J., Konarska, J., Lindberg, F., Johansson, L., and Thorsson, S.: Mapping leaf area of urban greenery using aerial LiDAR and ground-based measurements in Gothenburg, Sweden, Urban For. Urban Gree., 26, 31–40, https://doi.org/10.1016/j.ufug.2017.05.011, 2017. a, b, c, d
Kolbe, T. H., Gröger, G., and Plümer, L.: CityGML: Interoperable access to 3D city models, in: Geo-information for disaster management, Springer, 883–899, https://doi.org/10.1007/3-540-27468-5_63, 2005. a
Konarska, J., Uddling, J., Holmer, B., Lutz, M., Lindberg, F., Pleijel, H., and Thorsson, S.: Transpiration of urban trees and its cooling effect in a high latitude city, Int. J. Biometeorol., 60, 159–172, https://doi.org/10.1007/s00484-015-1014-x, 2016. a, b, c
Krayenhoff, E., Christen, A., Martilli, A., and Oke, T.: A multi-layer radiation model for urban neighbourhoods with trees, Bound.-Lay. Meteorol., 151, 139–178, https://doi.org/10.1007/s10546-013-9883-1, 2014. a, b, c, d
Krayenhoff, E., Santiago, J.-L., Martilli, A., Christen, A., and Oke, T.: Parametrization of drag and turbulence for urban neighbourhoods with trees, Bound.-Lay. Meteorol., 156, 157–189, https://doi.org/10.1007/s10546-015-0028-6, 2015. a, b, c
Krayenhoff, E. S.: A multi-layer urban canopy model for neighbourhoods with trees, PhD thesis, University of British Columbia, https://doi.org/10.14288/1.0167084, 2014. a, b, c, d, e
Krayenhoff, E. S., Moustaoui, M., Broadbent, A. M., Gupta, V., and Georgescu, M.: Diurnal interaction between urban expansion, climate change and adaptation in US cities, Nat. Clim. Change, 8, 1097, https://doi.org/10.1038/s41558-018-0320-9, 2018. a, b
Krayenhoff, E. S., Jiang, T., Christen, A., Martilli, A., Oke, T. R., Bailey, B. N., Nazarian, N., Voogt, J. A., Giometto, M. G., Stastny, A., and Crawford, B. R.: A multi-layer urban canopy meteorological model with trees (BEP-Tree): Street tree impacts on pedestrian-level climate, Urban Climate, 32, 100590, https://doi.org/10.1016/j.uclim.2020.100590, 2020. a, b, c, d, e, f
Lee, S.-H.: Further development of the vegetated urban canopy model including a grass-covered surface parametrization and photosynthesis effects, Bound.-Lay. Meteorol., 140, 315–342, https://doi.org/10.1007/s10546-011-9603-7, 2011. a
Lee, S.-H. and Park, S.-U.: A vegetated urban canopy model for meteorological and environmental modelling, Bound.-Lay. Meteorol., 126, 73–102, https://doi.org/10.1007/s10546-007-9221-6, 2008. a, b
Lee, S.-H., Lee, H., Park, S.-B., Woo, J.-W., Lee, D.-I., and Baik, J.-J.: Impacts of in-canyon vegetation and canyon aspect ratio on the thermal environment of street canyons: numerical investigation using a coupled WRF-VUCM model, Q. J. Roy. Meteor. Soc., 142, 2562–2578, 2016. a
Li, D. and Bou-Zeid, E.: Synergistic interactions between urban heat islands and heat waves: The impact in cities is larger than the sum of its parts, J. Appl. Meteorol. Clim., 52, 2051–2064, https://doi.org/10.1175/JAMC-D-13-02.1, 2013. a
Li, X.-X. and Norford, L. K.: Evaluation of cool roof and vegetations in mitigating urban heat island in a tropical city, Singapore, Urban Climate, 16, 59–74, https://doi.org/10.1016/j.uclim.2015.12.002, 2016. a
Lietzke, B. and Vogt, R.: Variability of CO2 concentrations and fluxes in and above an urban street canyon, Atmos. Environ., 74, 60–72, https://doi.org/10.1016/j.atmosenv.2013.03.030, 2013. a, b
Lindberg, F., Grimmond, C. S. B., Yogeswaran, N., Kotthaus, S., and Allen, L.: Impact of city changes and weather on anthropogenic heat flux in Europe 1995–2015, Urban Climate, 4, 1–15, https://doi.org/10.1016/j.uclim.2013.03.002, 2013. a, b
Liss, K., Tooke, R., Heyman, E., Coops, N., and Christen, A.: Vegetation Characteristics at the Vancouver EPiCC experimental sites, https://doi.org/10.14288/1.0103589, 2010. a
Loridan, T. and Grimmond, C.: Multi-site evaluation of an urban land-surface model: intra-urban heterogeneity, seasonality and parameter complexity requirements, Q. J. Roy. Meteor. Soc., 138, 1094–1113, https://doi.org/10.1002/qj.963, 2012. a, b
Loughner, C. P., Allen, D. J., Zhang, D.-L., Pickering, K. E., Dickerson, R. R., and Landry, L.: Roles of urban tree canopy and buildings in urban heat island effects: Parameterization and preliminary results, J. Appl. Meteorol. Clim., 51, 1775–1793, https://doi.org/10.1175/JAMC-D-11-0228.1, 2012. a, b
Loveland, T. R., Reed, B. C., Brown, J. F., Ohlen, D. O., Zhu, Z., Yang, L., and Merchant, J. W.: Development of a global land cover characteristics database and IGBP DISCover from 1 km AVHRR data, Int. J. Remote Sens., 21, 1303–1330, https://doi.org/10.1080/014311600210191, 2000. a
Manickathan, L., Defraeye, T., Allegrini, J., Derome, D., and Carmeliet, J.: Parametric study of the influence of environmental factors and tree properties on the transpirative cooling effect of trees, Agr, Forest Meteorol., 248, 259–274, 2018. a
Marcolla, B., Pitacco, A., and Cescatti, A.: Canopy Architecture and Turbulence Structure in a Coniferous Forest, Bound.-Lay. Meteorol., 108, 39–59, https://doi.org/10.1023/A:1023027709805, 2003. a
Martilli, A.: On the derivation of input parameters for urban canopy models from urban morphological datasets, Bound.-Lay. Meteorol., 130, 301–306, https://doi.org/10.1007/s10546-008-9345-3, 2009. a
Martilli, A., Clappier, A., and Rotach, M. W.: An urban surface exchange parameterisation for mesoscale models, Bound.-Lay. Meteorol., 104, 261–304, https://doi.org/10.1023/A:1016099921195, 2002. a, b, c
McInerney, D. and Kempeneers, P.: Image (re-) projections and merging, in: Open source geospatial tools, Springer, 99–127, https://doi.org/10.1007/978-3-319-01824-9_8, 2015. a
Miao, S., Chen, F., LeMone, M. A., Tewari, M., Li, Q., and Wang, Y.: An observational and modeling study of characteristics of urban heat island and boundary layer structures in Beijing, J. Appl. Meteorol. Clim., 48, 484–501, https://doi.org/10.1175/2008JAMC1909.1, 2009. a
Mitraka, Z., Chrysoulakis, N., Kamarianakis, Y., Partsinevelos, P., and Tsouchlaraki, A.: Improving the estimation of urban surface emissivity based on sub-pixel classification of high resolution satellite imagery, Remote Sens. Environ., 117, 125–134, https://doi.org/10.1016/j.rse.2011.06.025, 2012. a
Mussetti, G.: Data for “COSMO-BEP-Tree v1.0: a coupled urban climate model with explicit representation of street trees”, https://doi.org/10.5281/zenodo.3377392, 2019a. a
Mussetti, G.: UCPgenerator v1.1, https://doi.org/10.5281/zenodo.3352214, 2019b. a, b
Mussetti, G., Brunner, D., Allegrini, J., Wicki, A., Schubert, S., and Carmeliet, J.: Simulating urban climate at sub-kilometre scale for representing the intra-urban variability of Zurich, Switzerland, Int. J. Climatol., 40, 458–476, https://doi.org/10.1002/joc.6221, 2020. a, b, c, d, e
Ng, E., Chen, L., Wang, Y., and Yuan, C.: A study on the cooling effects of greening in a high-density city: An experience from Hong Kong, Build. Environ., 47, 256–271, https://doi.org/10.1016/j.buildenv.2011.07.014, 2012. a
Nilson, T.: A theoretical analysis of the frequency of gaps in plant stands, Agr. Meteorol., 8, 25–38, https://doi.org/10.1016/0002-1571(71)90092-6, 1971. a
Oke, T. R.: The micrometeorology of the urban forest, Philos. T. Roy. Soc. London, 324, 335–349, https://doi.org/10.1098/rstb.1989.0051, 1989. a
Oke, T. R., Mills, G., Christen, A., and Voogt, J. A.: Urban Climates, Cambridge University Press, https://doi.org/10.1017/9781139016476, 2017. a
Oleson, K. W., Bonan, G. B., Feddema, J., Vertenstein, M., and Grimmond, C.: An urban parameterization for a global climate model. Part I: Formulation and evaluation for two cities, J. Appl. Meteorol. Clima., 47, 1038–1060, https://doi.org/10.1175/2007JAMC1597.1, 2008. a
Panosetti, D., Böing, S., Schlemmer, L., and Schmidli, J.: Idealized large-eddy and convection-resolving simulations of moist convection over mountainous terrain, J. Atmos. Sci., 73, 4021–4041, https://doi.org/10.1175/JAS-D-15-0341.1, 2016. a
Parlow, E., Vogt, R., and Feigenwinter, C.: The urban heat island of Basel – seen from different perspectives, DIE ERDE – Journal of the Geographical Society of Berlin, 145, 96–110, 2014. a
Ramamurthy, P., Li, D., and Bou-Zeid, E.: High-resolution simulation of heatwave events in New York City, Theor. Appl. Climatol., 128, 89–102, https://doi.org/10.1007/s00704-015-1703-8, 2017. a
Redon, E. C., Lemonsu, A., Masson, V., Morille, B., and Musy, M.: Implementation of street trees within the solar radiative exchange parameterization of TEB in SURFEX v8.0, Geosci. Model Dev., 10, 385–411, https://doi.org/10.5194/gmd-10-385-2017, 2017. a
Richardson, A. D., Aubinet, M., Barr, A. G., Hollinger, D. Y., Ibrom, A., Lasslop, G., and Reichstein, M.: Uncertainty quantification, in: Eddy Covariance, Springer, 173–209, https://doi.org/10.1007/978-94-007-2351-1_7, 2012. a
Rockel, B., Will, A., and Hense, A.: The regional climate model COSMO-CLM (CCLM), Meteorol. Z., 17, 347–348, https://doi.org/10.1127/0941-2948/2008/0309, 2008. a, b
Rosenzweig, C., Solecki, W. D., Romero-Lankao, P., Mehrotra, S., Dhakal, S., and Ibrahim, S. A.: Climate Change and Cities: Second Assessment Report of the Urban Climate Change Research Network, Cambridge University Press, https://doi.org/10.1017/9781316563878.007, 2018. a
Rotach, M., Vogt, R., Bernhofer, C., Batchvarova, E., Christen, A., Clappier, A., Feddersen, B., Gryning, S.-E., Martucci, G., Mayer, H., Mitev, V., Oke, T. R., Parlow, E., Richner, H., Roth, M., Roulet, Y.-A., Ruffieux, D., Salmond, J. A., Schatzmann, M., and Voogt, J. A.: BUBBLE – an urban boundary layer meteorology project, Theor. Appl. Climatol., 81, 231–261, https://doi.org/10.1007/s00704-004-0117-9, 2005. a
Ryu, Y., Sonnentag, O., Nilson, T., Vargas, R., Kobayashi, H., Wenk, R., and Baldocchi, D. D.: How to quantify tree leaf area index in an open savanna ecosystem: a multi-instrument and multi-model approach, Agr. Forest Meteorol., 150, 63–76, https://doi.org/10.1016/j.agrformet.2009.08.007, 2010. a
Ryu, Y.-H., Bou-Zeid, E., Wang, Z.-H., and Smith, J. A.: Realistic representation of trees in an urban canopy model, Bound.-Lay. Meteorol., 159, 193–220, https://doi.org/10.1007/s10546-015-0120-y, 2016. a, b
Salamanca, F., Martilli, A., and Yagüe, C.: A numerical study of the Urban Heat Island over Madrid during the DESIREX (2008) campaign with WRF and an evaluation of simple mitigation strategies, Int. J. Climatol., 32, 2372–2386, https://doi.org/10.1002/joc.3398, 2012. a
Santiago, J. and Martilli, A.: A dynamic urban canopy parameterization for mesoscale models based on computational fluid dynamics Reynolds-averaged Navier–Stokes microscale simulations, Bound.-Lay. Meteorol., 137, 417–439, https://doi.org/10.1007/s10546-010-9538-4, 2010. a
Schmutz, M., Vogt, R., Feigenwinter, C., and Parlow, E.: Ten years of eddy covariance measurements in Basel, Switzerland: Seasonal and interannual variabilities of urban CO2 mole fraction and flux, J. Geophys. Res.-Atmos., 121, 8649–8667, https://doi.org/10.1002/2016JD025063, 2016. a, b
Schraff, C. H.: Mesoscale data assimilation and prediction of low stratus in the Alpine region, Meteorol. Atmos. Phys., 64, 21–50, https://doi.org/10.1007/BF01044128, 1997. a
Schubert, S. and Grossman-Clarke, S.: The influence of green areas and roof albedos on air temperatures during extreme heat events in Berlin, Germany, Meteorol. Z., 22, 131–143, https://doi.org/10.1127/0941-2948/2013/0393, 2013. a, b
Schubert, S. and Grossman-Clarke, S.: Evaluation of the coupled COSMO-CLM/DCEP model with observations from BUBBLE, Q. J. Roy. Meteor. Soc., 140, 2465–2483, https://doi.org/10.1002/qj.2311, 2014. a, b, c, d, e, f
Schubert, S., Grossman-Clarke, S., and Martilli, A.: A double-canyon radiation scheme for multi-layer urban canopy models, Bound.-Lay. Meteorol., 145, 439–468, https://doi.org/10.1007/s10546-012-9728-3, 2012. a, b
Schubert, S. A.: Development and evaluation of a double-canyon urban canopy scheme, and estimation of urban heat island mitigation effects, PhD thesis, Freie Universität Berlin Berlin, available at: https://refubium.fu-berlin.de/handle/fub188/11568 (last access: 31 March 2020), 2013. a, b
Shashua-Bar, L., Pearlmutter, D., and Erell, E.: The cooling efficiency of urban landscape strategies in a hot dry climate, Landscape Urban Plan., 92, 179–186, https://doi.org/10.1016/j.landurbplan.2009.04.005, 2009. a, b, c
Shin, H. H. and Hong, S.-Y.: Representation of the subgrid-scale turbulent transport in convective boundary layers at gray-zone resolutions, Mon. Weather Rev., 143, 250–271, https://doi.org/10.1175/MWR-D-14-00116.1, 2015. a
Skamarock, W. C., Klemp, J. B., Dudhia, J., Gill, D. O., Barker, D. M., Wang, W., and Powers, J. G.: A description of the advanced research WRF version 2, Tech. rep., National Center For Atmospheric Research Boulder Co Mesoscale and Microscale Meteorology Div, 2005. a
Sobrino, J. A., Jiménez-Muñoz, J. C., Sòria, G., Romaguera, M., Guanter, L., Moreno, J., Plaza, A., and Martínez, P.: Land surface emissivity retrieval from different VNIR and TIR sensors, IEEE T. Geosci. Remote, 46, 316–327, https://doi.org/10.1109/TGRS.2007.904834, 2008. a
Stadtgaertnerei Kantons Basel-Stadt: Parks und Baeume, available at: http://www.bs.ch/, last access: 31 March 2020. a, b
Stavropulos-Laffaille, X., Chancibault, K., Brun, J.-M., Lemonsu, A., Masson, V., Boone, A., and Andrieu, H.: Improvements to the hydrological processes of the Town Energy Balance model (TEB-Veg, SURFEX v7.3) for urban modelling and impact assessment, Geosci. Model Dev., 11, 4175–4194, https://doi.org/10.5194/gmd-11-4175-2018, 2018. a
Steppeler, J., Doms, G., Schättler, U., Bitzer, H., Gassmann, A., Damrath, U., and Gregoric, G.: Meso-gamma scale forecasts using the nonhydrostatic model LM, Meteorol. Atmos. Phys., 82, 75–96, https://doi.org/10.1007/s00703-001-0592-9, 2003. a
Stewart, I. D. and Oke, T. R.: Local climate zones for urban temperature studies, B. Am. Meteorol. Soc., 93, 1879–1900, https://doi.org/10.1175/BAMS-D-11-00019.1, 2012. a
Stull, R. B.: An introduction to boundary layer meteorology, vol. 13, Springer Science & Business Media, https://doi.org/10.1007/978-94-009-3027-8, 2012. a
Tachikawa, T., Kaku, M., Iwasaki, A., Gesch, D., Oimoen, M., Zhang, Z., Danielson, J., Krieger, T., Curtis, B., Haase, J., Abrams, M., Crippen, R., and Carabajal, C.: ASTER Global Digital Elevation Model Version 2 – Summary of Validation Results, ASTER GDEM Validation Team, available at: https://ssl.jspacesystems.or.jp/ersdac/GDEM/ver2Validation/Summary_GDEM2_validation_report_final.pdf (last access: 31 March 2020), 31 August 2011. a
Tan, Z., Lau, K. K.-L., and Ng, E.: Urban tree design approaches for mitigating daytime urban heat island effects in a high-density urban environment, Energ. Buildings, 114, 265–274, https://doi.org/10.1016/j.enbuild.2015.06.031, 2016. a
Tardy, B., Rivalland, V., Huc, M., Hagolle, O., Marcq, S., and Boulet, G.: A software tool for atmospheric correction and surface temperature estimation of landsat infrared thermal data, Remote Sensing, 8, 696, https://doi.org/10.3390/rs8090696, 2016. a
Thatcher, M. and Hurley, P.: Simulating Australian urban climate in a mesoscale atmospheric numerical model, Bound.-Lay. Meteorol., 142, 149–175, https://doi.org/10.1007/s10546-011-9663-8, 2012. a
Tölle, M. H., Breil, M., Radtke, K., and Panitz, H.-J.: Sensitivity of European temperature to albedo parameterization in the regional climate model COSMO-CLM linked to extreme land use changes, Front. Environ. Sci., 6, 123, https://doi.org/10.3389/fenvs.2018.00123, 2018. a
Trusilova, K., Früh, B., Brienen, S., Walter, A., Masson, V., Pigeon, G., and Becker, P.: Implementation of an urban parameterization scheme into the regional climate model COSMO-CLM, J. Appl. Meteorol. Clim., 52, 2296–2311, https://doi.org/10.1175/JAMC-D-12-0209.1, 2013. a
Trusilova, K., Schubert, S., Wouters, H., Früh, B., Grossman-Clarke, S., Demuzere, M., and Becker, P.: The urban land use in the COSMO-CLM model: a comparison of three parameterizations for Berlin, Meteorol. Z., 25, 231–244, https://doi.org/10.1127/metz/2015/0587, 2016. a
Voogt, J. A. and Oke, T. R.: Thermal remote sensing of urban climates, Remote Sens. Environ., 86, 370–384, https://doi.org/10.1016/S0034-4257(03)00079-8, 2003. a, b
Wang, C., Wang, Z.-H., and Yang, J.: Cooling effect of urban trees on the built environment of contiguous United States, Earth's Future, 6, 1066–1081, https://doi.org/10.1029/2018EF000891, 2018. a, b
Wang, P., Zhang, Q., Yang, Y., and Tang, J.: The sensitivity to initial soil moisture for three severe cases of heat waves over Eastern China, Front. Environ. Sci., 7, 18, https://doi.org/10.3389/fenvs.2019.00018, 2019. a
Wang, Z.-H.: Monte Carlo simulations of radiative heat exchange in a street canyon with trees, Sol. Energy, 110, 704–713, https://doi.org/10.1016/j.solener.2014.10.012, 2014. a
Wang, Z.-H., Bou-Zeid, E., and Smith, J. A.: A coupled energy transport and hydrological model for urban canopies evaluated using a wireless sensor network, Q. J. Roy. Meteor. Soc., 139, 1643–1657, https://doi.org/10.1002/qj.2032, 2013. a
Wicki, A., Parlow, E., and Feigenwinter, C.: Evaluation and modeling of urban heat island intensity in Basel, Switzerland, Climate, 6, 55, https://doi.org/10.3390/cli6030055, 2018. a
Will, A., Akhtar, N., Brauch, J., Breil, M., Davin, E., Ho-Hagemann, H. T. M., Maisonnave, E., Thürkow, M., and Weiher, S.: The COSMO-CLM 4.8 regional climate model coupled to regional ocean, land surface and global earth system models using OASIS3-MCT: description and performance, Geosci. Model Dev., 10, 1549–1586, https://doi.org/10.5194/gmd-10-1549-2017, 2017. a
Willmott, C. J.: On the validation of models, Phys. Geogr., 2, 184–194, https://doi.org/10.1080/02723646.1981.10642213, 1981. a
Willmott, C. J., Ackleson, S. G., Davis, R. E., Feddema, J. J., Klink, K. M., Legates, D. R., O'donnell, J., and Rowe, C. M.: Statistics for the evaluation and comparison of models, J. Geophys. Res.-Oceans, 90, 8995–9005, https://doi.org/10.1029/JC090iC05p08995, 1985. a, b
Wilson, N. R. and Shaw, R. H.: A higher order closure model for canopy flow, J. Appl. Meteorol., 16, 1197–1205, https://doi.org/10.1175/1520-0450(1977)016<1197:AHOCMF>2.0.CO;2, 1977. a
Wouters, H., Demuzere, M., De Ridder, K., and van Lipzig, N. P.: The impact of impervious water-storage parametrization on urban climate modelling, Urban Climate, 11, 24–50, https://doi.org/10.1016/j.uclim.2014.11.005, 2015. a
Wouters, H., Demuzere, M., Blahak, U., Fortuniak, K., Maiheu, B., Camps, J., Tielemans, D., and van Lipzig, N. P. M.: The efficient urban canopy dependency parametrization (SURY) v1.0 for atmospheric modelling: description and application with the COSMO-CLM model for a Belgian summer, Geosci. Model Dev., 9, 3027–3054, https://doi.org/10.5194/gmd-9-3027-2016, 2016. a, b, c, d, e, f, g
Wouters, H., De Ridder, K., Poelmans, L., Willems, P., Brouwers, J., Hosseinzadehtalaei, P., Tabari, H., Vanden Broucke, S., van Lipzig, N. P., and Demuzere, M.: Heat stress increase under climate change twice as large in cities as in rural areas: A study for a densely populated midlatitude maritime region, Geophys. Res. Lett., 44, 8997–9007, https://doi.org/10.1002/2017GL074889, 2017. a
Wyngaard, J. C.: Toward numerical modeling in the “Terra Incognita”, J. Atmos. Sci., 61, 1816–1826, https://doi.org/10.1175/1520-0469(2004)061<1816:TNMITT>2.0.CO;2, 2004. a
Xiong, D., Douthe, C., and Flexas, J.: Differential coordination of stomatal conductance, mesophyll conductance, and leaf hydraulic conductance in response to changing light across species, Plant Cell Environ., 41, 436–450, https://doi.org/10.1111/pce.13111, 2018. a
Yang, J., Wang, Z.-H., Chen, F., Miao, S., Tewari, M., Voogt, J. A., and Myint, S.: Enhancing hydrologic modelling in the coupled weather research and forecasting–urban modelling system, Bound.-Lay. Meteorol., 155, 87–109, 2015. a