the Creative Commons Attribution 4.0 License.
the Creative Commons Attribution 4.0 License.
 | 04 Mar 2020
Uncertainties in climate change projections covered by the ISIMIP and CORDEX model subsets from CMIP5
Hideo Shiogama
Tosiyuki Nakaegawa
Izuru Takayabu
Two international projects, ISIMIP (Inter-Sectoral Impact Model Intercomparison Project) and CORDEX (Coordinated Regional Climate Downscaling Experiment), have been established to assess the impacts of global climate change and improve our understanding of regional climate respectively. Model selection from the GCMs (general circulation models) within CMIP5 (fifth phase of the Coupled Model Intercomparison Project) was conducted using the different approaches for each project: one is a globally consistent model subset used in ISIMIP and the other is a region-specific model subset for each region of interest used in CORDEX. We evaluated the ability to reproduce the regional climatological state by comparing the subsets with the full set of CMIP5 multimodel ensemble. We also investigated how well the subsets captured the uncertainty in the climate change projected by the full set, to increase credibility for the scientific outcomes from each project. The spreads of the biases and Taylor's skill scores from the ISIMIP and CORDEX subsets are smaller than that from the full set for the regional means of surface air temperature and precipitation. However, the ISIMIP and CORDEX subsets show the larger spread than high-performance models from the full set, despite using a small number of models in ISIMIP and CORDEX. It was shown that better subsets exist that would have smaller biases and/or higher scores than the current subset. The ISIMIP subset captures the uncertainty range of the regional mean of temperature change projections by the full set better than the CORDEX subsets in 10 of 14 terrestrial regions worldwide. Compared with 10 000 randomly selected subset samples, the CORDEX subset shows low coverage of the uncertainty for the temperature change projections in some regions, and the ISIMIP subset shows high coverage in all regions. On the other hand, for the precipitation change projections, the CORDEX subsets show lower coverage in half of the regions than the randomly selected subsets, but tend to cover the uncertainty wider than the ISIMIP subset. In the regions where CORDEX used nine models or more, good coverage (>50 %) is evident for the projections of both temperature and precipitation. The globally consistent model subset used in ISIMIP could have difficulty in capturing uncertainties in the regional precipitation change projections, whereas it widely covers uncertainties in the temperature change projections. The region-specific model subset, like CORDEX, can cover the uncertainties in both temperature and precipitation changes well compared to the global common subset, but a large number of models is needed. By changing the number of models from the current ensemble members to at least nine members, high coverage for both uncertainties can be also obtained in the other regions, and this information would help model selection in the next generations.
- Article
(4574 KB) -
Supplement
(12051 KB) - BibTeX
- EndNote


A global dataset of climate change projections has been generated by the Coupled Model Intercomparison Project (CMIP). Using this dataset, numerous climatological studies have been in progress to advance our understanding of the increasingly severe problems associated with climate change. Regarding regional climate change, dynamical and statistical downscaling experiments have been conducted to create high-resolution climate products derived from the global CMIP dataset via a regional climate model. In addition, impact studies and examinations of adaptation planning have progressed in close parallel with the climate studies, using those climate products at both global and regional scales.
When we conduct an impact assessment of climate change and consider possible adaptation or mitigation measures, the information regarding the largest potential change in the climate is required to consider the most severe states of climate change, in addition to information regarding how the climate changes on average. Although the CMIP multiple general circulation model (GCM) ensemble is the ensemble of opportunity, and does not necessarily represent the full uncertainty in climate projections (Knutti, 2010), it is useful for investigating uncertainty in future projections. By using the climate projections from the CMIP ensemble, it is at least possible to examine the maximum–minimum climate change scenarios within the ensemble.
It is desirable to use GCMs as much as possible to address the most severe problems but, due to limitations in computing resources, relatively small subsets of the models are generally used in regional downscaling studies and impact assessments. The present subset tends to be selected under the conditions that the simulation accuracy is better for the climatological state of interest or that the data required for the study is readily available. Methods for specifying the best subset, based on the accuracy of the historical climate simulations and/or capturing the possible maximum range in the variation of projections among the models (hereafter uncertainty), have been proposed (Reichler and Kim, 2008; Cannon, 2015; Mendlik and Gobiet, 2016). The optimum method, however, remains to be determined because the interest depends on the requirements of the studies, for instance, how the model performance is considered, which climatological or extreme variables are used and which region is interested. When the sample size of a subset is limited, appropriate strategies are necessary to select subsets of GCMs that have smaller biases in the historical climate simulations and cover the widest possible uncertainty range of future projections. Without such a strategy, we might erroneously interpret the information regarding climate change and impact assessment obtained from the subsets.
The Inter-Sectoral Impact Model Intercomparison Project (ISIMIP; https://www.isimip.org, last access: 23 January 2019) was designed as a framework to assess the impacts of climate change in different sectors and at different scales (Schellnhuber et al., 2014). This project used consistent climate and socio-economic input data to multiple impact models. Five GCMs were selected in the fast track of ISIMIP: HadGEM2-ES, GFDL-ESM2, IPSL-CM5A-LR, MIROC-ESM-CHEM and NorESM1-M. The main selection condition was that the climate data generated by the models was available at the relevant stage of the project, with the attempt of broadly capturing the global change in surface air temperature (hereafter referred to as “temperature” for simplicity) and precipitation (Warszawski et al., 2014; ISIMIP protocol, 2018). After that, the five GCMs were changed to four GCMs in the next round simulations (ISIMIP2b; Frieler et al., 2017) because of a lack of wind data for NorESM1-M and a higher horizontal resolution and the better representation of various fields (e.g. El Niño–Southern Oscillation and the monsoon) in MIROC5 than in MIROC-ESM-CHEM. A feature of the uncertainty range identified from the five GCMs in the fast track was investigated in detail by McSweeney and Jones (2016; hereafter MJ2016), who indicated that the subset covers more of the uncertainty in the temperature and precipitation changes projected by 36 CMIP5 GCMs than other randomly sampled five-GCM subsets. They also illuminated that region-specific subsets generally cover more the uncertainty than globally consistent subsets in 26 global regions.
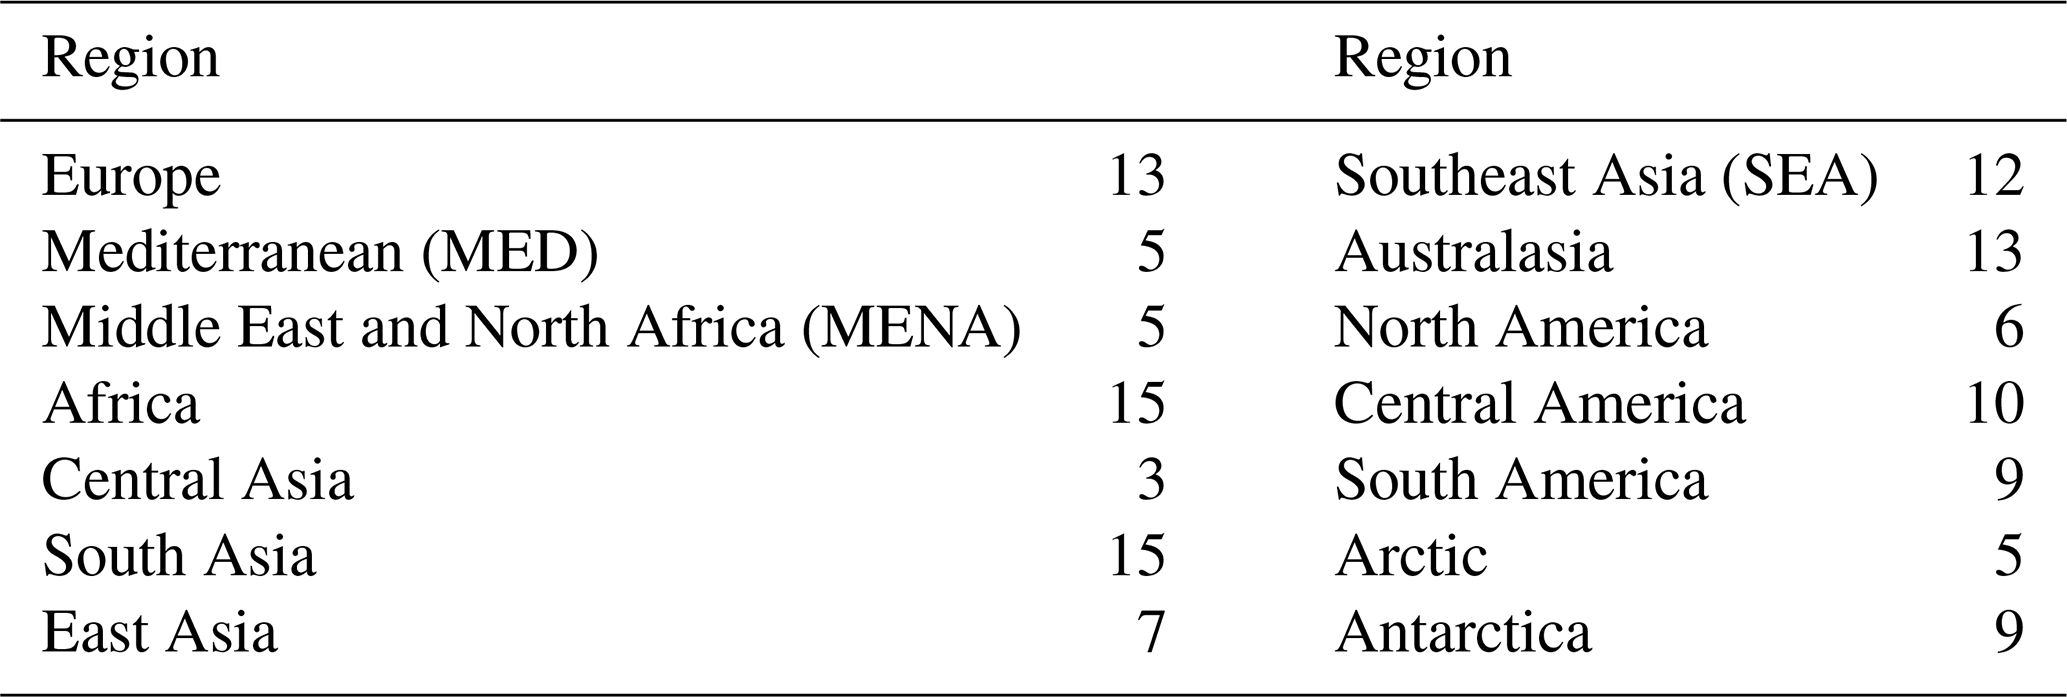
One subset of GCMs was globally used in ISIMIP, but in the coordinated regional climate downscaling experiment (CORDEX; http://www.cordex.org, last access: 20 May 2019) project, a GCM subset was selected for each defined region to generate a regional climate dataset for climate studies and impact assessments (Giorgi et al., 2009; Giorgi and Gutowski, 2015). Fourteen regions of interest were defined and subsets of between 3 and 15 GCMs were used for each region. The conditions required here were that input data to a regional climate model (RCM) were available and easily acquired, and they also tended to select GCMs that were developed at the institute located in the region of interest. The advantage of CORDEX is that it enables a regional climate assessment using a dataset from “optimal” multi-GCMs and multi-RCMs for the region of interest. However, Gutowski et al. (2016) pointed out that one of the problems in the first phase of CORDEX is that the different models, especially the number of models, among the regions make it difficult to provide a consistent climate scenario among their regions. Therefore, in the next generation of CORDEX to be included in the sixth phase of CMIP, there is a the intention to downscale projections from a core set of GCMs as a minimum model set that is common across the regions, similar to the approach in ISIMIP (CORDEX CORE; Gutowski et al., 2016).
A globally consistent GCM subset will facilitate discussion of climate change and its impacts beyond regional divisions. However, it is unclear whether the globally consistent subset adequately represents the phenomena that characterize the climate in the region of interest. In particular, the spatial pattern of a projected change in precipitation is strongly dependent on the GCMs selected (Giorgi and Gutowski, 2015; McSweeney et al., 2015). Therefore, the possibility of insufficiently capturing the regional climate change and its valid uncertainty could be increased, as noted by MJ2016. In contrast, a region-specific GCM subset can include GCMs which more precisely reproduce the target regional climate (McSweeney et al., 2015). However, it does not enable discussions about the difference among regions and the interaction of impacts across the regions. Although there are advantages to both approaches in selecting a subset, it is necessary that we understand the characteristics of the current subsets selected using the approaches of the ongoing projects if we are to improve the process in the next generations of the projects.
In this study, we assessed the current subsets of the CMIP5 multi-GCM ensemble being used in ISIMIP and CORDEX by clarifying the climatological characteristics expressed by each subset from two points of view: how high the ability to reproduce the historical climate is (i.e. model performance) and to what extent the uncertainty in the projections obtained from the subsets covers the uncertainty from the full set. We examined temperature and precipitation climatologies using a simple method, but the clarification of characteristics is important for understanding the basic nature of dataset and increasing the credibility of the scientific outcomes from each project. In addition, with reference to MJ2016, we also explored whether the subset used was able to capture the uncertainty from the full set more widely than the other model subsets when using the same sample size.
Regarding the ISIMIP subset, there are two updated points from MJ2016. One is the investigations of the ability to represent historical climate for the ISIMIP subset, which MJ2016 did not mention; another is that our target GCMs are four GCMs selected in ISIMIP2b (unless specified otherwise, this hereafter refers to as ISIMIP). Regarding the CORDEX subset, previous studies have assessed the GCM simulations in some regions, but are limited (e.g. Haensler et al., 2013 for Africa; Bartók et al., 2017 for Europe; Karmalkar, 2018 for North America). Therefore, even a simple assessment of GCM simulations is needed to understand their downscaled simulations.
Uniform assessment across regions permits discussion of the regional characteristics and the possibility of heterogeneous scenario among regions as mentioned above. Furthermore, by using both subsets from ISIMIP and CORDEX, we can explore the difference between the original subset in CORDEX and the subset assuming CORDEX CORE (global common subset), which could be helpful information for the model selection in CORDEX CORE.
2.1 Dataset
We analysed the historical runs of 50 atmosphere–ocean GCMs (AOGCMs) and the Representative Concentration Pathway (RCP) 8.5 scenario runs of 42 AOGCMs participating in CMIP5 (Taylor et al., 2012). A single ensemble member, r1i1p1, was selected for each model, except for CESM1-WACCM (r2i1p1), CSIRO-Mk3L-1-2 (r1i2p1) and EC-EARTH (r8i1p1). This is because the member, r1i1p1, of CESM1-WACCM and CSIRO-Mk3L-1-2 was not available and the temperature change from r1i1p1 of EC-EARTH was over 2 standard deviations of the averaged changes from the 42 models in more than 60 % of our target regions. In the following, the full set of the multi-GCM ensemble indicates the 50 historical runs when we assessed the ability to reproduce the historical climate (CMIPFull_Hist), while the full set indicates the 42 future projections which are estimated from both historical and rcp85 runs when we discussed the future projections (CMIPFull_Future).
We compared the simulations of the subsets of GCMs used in ISIMIP and CORDEX with the full ensemble. ISIMIP used four GCMs for their various impact assessments: GFDL-ESM2M, HadGEM2-ES, IPSL-CM5A-LR and MIROC5 (Frieler et al., 2017). On the other hand, CORDEX used the subset in which the combination of GCMs were altered for each defined region. The number of GCMs used in each of the defined regions is listed in Table 1, and each GCM is listed in Table S1 in the Supplement. The regional classification used to investigate the regional performance and the projection was based on the classification in CORDEX shown in Fig. S1 in the Supplement. In this study, we focused on global land area, considering the importance for both programs because of the relevance to human activities.
The analysis periods were the years 1986–2005 (but 1985–2004 for HadGEM2-CC and HadGEM2-ES) for the historical runs and the years 2081–2100 (but 2080–2099 for MRI-AGCM60 and CESM1-WACCM) for the RCP8.5 runs. Monthly mean temperature and precipitation data over these periods were interpolated onto a grid for each model. The grid cells with the temporal mean precipitation of <0.1 mm d−1 were defined as “too dry” grid cells and the precipitation values for these cells were not considered. This is because we expressed the precipitation change in a ratio and thus the ratio tends to be large at too dry cells even when the change is quantitatively extreme small. It is difficult to explain the meanings of such a large ratio physically. By applying the threshold, grid cells indicating an extremely large ratio, for instance, 100 %, were excluded. The total number of the excluded grid cells is approximately 5 % of all target cells as an average over the used members.
To validate the model representations, we compared the simulated estimates with the observed datasets. With respect to precipitation, Sun et al. (2018) highlighted differences among the observational datasets. Consequently, to avoid a misreading of the model performance due to such discrepancies, we used seven different precipitation products that covered the global land area over the period of interest. The observation products were the Climatic Research Unit Timeseries (CRU) v.4.01 (Harris et al., 2014) for temperature and precipitation, and the following for precipitation only: the global unified gauge-based analysis by NOAA Climate Prediction Center (CPC) v.1.0 (Xie et al., 2010), the Global Precipitation Climatology Centre (GPCC) full data reanalysis v.7.0 (Schneider et al., 2016), NOAA's Precipitation reconstruction over Land (PRECL) v.1.0 (Chen et al., 2002), the CPC Merged Analysis of Precipitation (CMAP; Xie and Arkin, 1997), the Global Precipitation Climatology Project (GPCP) v.2.2 (Huffman et al., 2015) and the Multi-Source Weighted-Ensemble Precipitation (MSWEP) v2.1 (Beck et al., 2019). The difference among the observations was calculated as the deviation from GPCC as the reference. To quantify the ability to reproduce spatial patterns of the observations, we used the skill score proposed by Taylor (2001; hereafter referred to as skill score) as follows:
where R is the spatial correlation coefficient between reference observation and simulation, σ is the standard deviation of simulation normalized by the reference spatial pattern and R0 is the maximum correlation attainable. The value of R0 was assumed to be 1 here. In addition to the skill score, we also evaluated the magnitude of the model bias. Using both metrics enables the assessment of both the spatial pattern and the bias magnitude.
2.2 Coverage of uncertainty and random selection
Coverage was estimated from a comparison between the full uncertainty range of the projections made by two model sets, which was defined by McSweeney et al. (2015) as a fractional range coverage, FRC. In this study, we computed the regionally averaged projections for each model, and then the FRCs were estimated using the regional averages. The FRC from the regional averages (FRA) was defined as the fraction of the maximum–minimum range of the uncertainty in the regional averaged projections from a subset of CMIPFull_Future (RSub) to the range from CMIPFull_Future (RFull), as follows:
The range of RSub was computed from the ISIMIP and CORDEX subsets and also from arbitrary subset samples we generated. From the comparison with the arbitrary samples, we can investigate how well the ISIMIP and CORDEX subsets captured the uncertainty range of projections. With reference to MJ2016, our arbitrary samples were generated by randomly selected n models without repetition from CMIPFull_Future 10 000 times, where n is the sample size of subsets in ISIMIP (n=4) or CORDEX (n depends on the regions; see Table 1). Then, the variance of the FRA was estimated from the 10 000 random subset samples of CMIPFull_Future and compared with the FRA from the ISIMIP and CORDEX subsets.
3.1 Performance in reproducing the historical climate
Using model biases and skill scores, we evaluated the historical climate reproduced by the GCM subsets used in ISIMIP and CORDEX. The GCM subsets used in ISIMIP and CORDEX are hereafter referred to as the ISIMIP subsets and CORDEX subsets respectively. For the evaluations, we also used two high-performance subsets: one is composed of models with lower bias than the 50th percentile (median) of the CMIPFull_Hist biases; the other is composed of models with a higher skill score than the median of the CMIPFull_Hist scores (referred to as CMIPlowB and CMIPhighS respectively). The models included in the high-performance subset are shown in Fig. S2. B(v(E)) and S(v(E)) indicate the regional mean biases and skill scores for variable v and ensemble subset E respectively.
Figure 1 shows the model bias associated with the annual mean precipitation in the 14 CORDEX regions over a 20-year period. Compared with the maximum values of B(P(CMIPFull_Hist)) for the precipitation (v=P), the maximum values of B(P(ISIMIP)) and B(P(CORDEX)) are clearly small, especially in the Mediterranean (MED), Southeast Asia (SEA), and the polar regions. The spreads of B(P(ISIMIP)) and B(P(CORDEX)) in MED are within the spread of the discrepancy among the observations, which suggests that the model selection works effectively to select models with high ability to reproduce the observed regional mean precipitation quantitatively. However, compared with the high-performance subsets, some models in the ISIMIP and CORDEX subsets have a bias exceeding the maximum values of B(P(CMIPlowB)), or B(P(CMIPhighS)) in some regions, despite the small number of models used in ISIMIP and CORDEX. Therefore, our results indicate that less-biased models could be selected than those currently being used. The difference in the spread between the ISIMIP and CORDEX subsets has different characteristics region to region, and this is partially related to the overlapping of model members used across ISIMIP and CORDEX. For example, in five regions of Central and South America, Europe, Africa and South Asia, the CORDEX subsets include more than three of four ISIMIP models and the ensemble is large (Table S1). As a result, the variance of biases estimated from the CORDEX subset covers that from the ISIMIP subset. Especially in Europe, the difference of the variance between the CORDEX and ISIMIP subsets is large, and it is found that the models used in the CORDEX subset but not included in the ISIMIP subset make the variance increase. Focusing on the regions where the CORDEX subsets include only two models in the ISIMIP subset, the variance from the CORDEX subset tends to be larger than that from the ISIMIP subset, especially in the regions with large ensemble of the CORDEX subsets, like North America, SEA and Australasia. By contrast, the variance from the CORDEX subsets is relatively small in the regions with a small ensemble of the CORDEX subsets, like MENA and Central Asia. In East Asia, the variance is small in CORDEX despite using seven models in contrast to four models in ISIMIP, indicating that the biases from the seven models are almost the same.
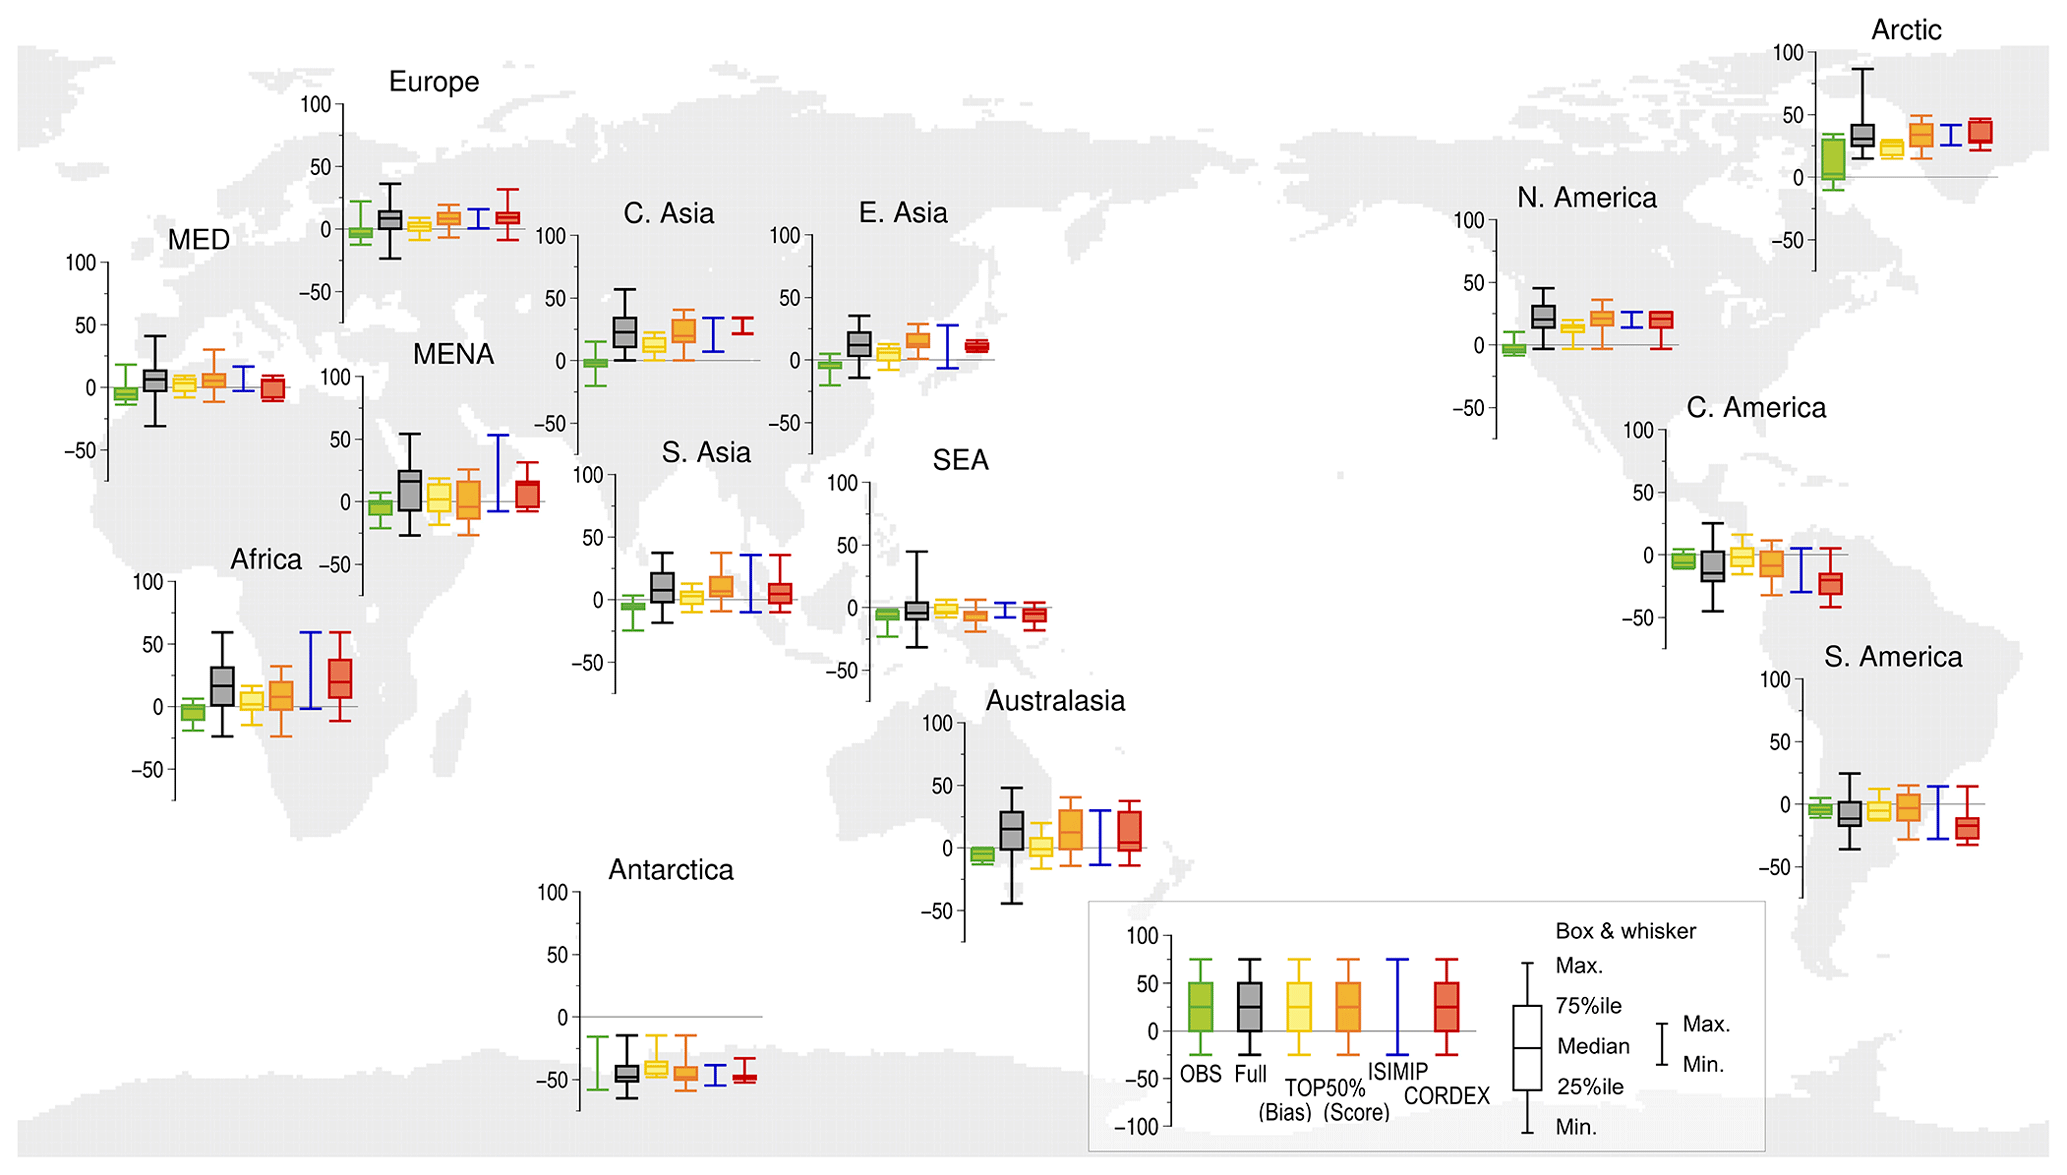
Figure 1Normalized annual mean model precipitation bias over land from the GPCC reference data (in percent). The bias was normalized by the regional average of GPCC data. The whiskers of the box plots show the range between the maximum and the minimum biases. The boxes and the lines within the boxes indicate the 25th to 75th percentile range and the median respectively. Green plots indicate the deviations of six observation data from the reference data: CRU, GPCC, PRECL, CMAP, GPCP and MSWEP. The other plots indicate the model bias in the full set of 50 CMIP5 model set (black), the model sets with a smaller bias than the median of biases of the full set (yellow), the model sets with higher Taylor's skill score than the median of the scores of the full set (orange) and the model sets selected for ISIMIP (blue) and CORDEX (red).
With respect to the spatial pattern of the annual mean precipitation, ISIMIP and CORDEX incorporate some models with a worse score than the minimum value of S(P(CMIPhighS)) (Fig. S3). That is to say, ISIMIP and CORDEX subsets include members showing a spatial pattern of low similarity to that of observations. S(P(ISIMIP)) and S(P(CORDEX)) fall within the observational spread only in the Arctic.
We also assessed model performance for the annual mean temperature (v=T). The maximum values of B(T(ISIMIP)) and B(T(CORDEX)) are smaller or equal to the maximum value of B(T(CMIPhighS)) (except for the CORDEX subsets in East Asia and North America), but are larger than the maximum value of B(T(CMIPlowB)) (Fig. S4). The spread of B(T(ISIMIP)) is covered by that of B(T(CORDEX)) in the same four regions as the bias in the precipitation except for Europe because of the overlapping of model members used. The spreads of B(T(ISIMIP)) and B(T(CORDEX)), however, resemble each other compared with the precipitation bias in most regions, indicating that CORDEX used models with a quantitatively similar performance to ISIMIP, despite using more models than ISIMIP except for Central Asia. Both subsets included models with a worse score than the minimum value of S(T(CMIPhighS)) in 85 % of the regions (Fig. S5). Therefore, relative to CMIPhighS, the subsets can quantitatively represent the observed temperature as a regional average well, but the spatial pattern represented by some members in the subsets does not resemble that of the observations.
Even though the model selections conducted in ISIMIP and CORDEX narrow the spreads of model bias and the score from CMIPFull_Hist, the largest bias and the worst score from the ISIMIP and CORDEX subsets are distributed beyond the biases and the scores from high-performance models in the full set.
3.2 Uncertainty range of the projected changes in annual mean temperature and precipitation
Future projections obtained from the ISIMIP and CORDEX subsets were compared with those from the full set, and also from high-performance models, as with the evaluations in Sect. 3.1. Because the small bias or high skill score models used in this section are composed of the models included in CMIPFull_Future, we refer to these as CMIP and CMIP instead of CMIPlowB and CMIPhighS. Projected changes in annual mean temperature and precipitation are designated by ΔT(E) and ΔP(E) respectively.
Figure 2 shows the uncertainty range of the projected temperature increments, calculated from the average over the 20-year period for each model. Although ISIMIP used fewer models than CORDEX, the uncertainty range of ΔT(ISIMIP) is greater than or equal to that of ΔT(CORDEX) except for Central and South America, South Asia and Australasia. The uncertainty ranges of ΔT(CMIP and ΔT(CMIP broadly cover the range of ΔT(CMIPFull_Future), suggesting that the bias and skill score are not good emergent constraints for reducing the uncertainty of ΔT in this study, though previous studies have showed the reduction of their projection uncertainties (e.g. Smith and Chandler, 2010; Bracegirdle and Stephenson, 2013; Bracegirdle et al., 2013; Simpson et al., 2016). This is because the spatial pattern for the temperature is quite similar among the models, and then the model selection using the score hardly has an impact on the reduction of uncertainty. On the other hand, the difference in the bias between the full set and the subset is large. The previous studies have suggested that the performance of the present climate simulations is not necessarily related to the uncertainties of future projections (e.g. Knutti, 2010; Shiogama et al., 2011). We expected such a relation between the quantitative performance and the future change in this study.
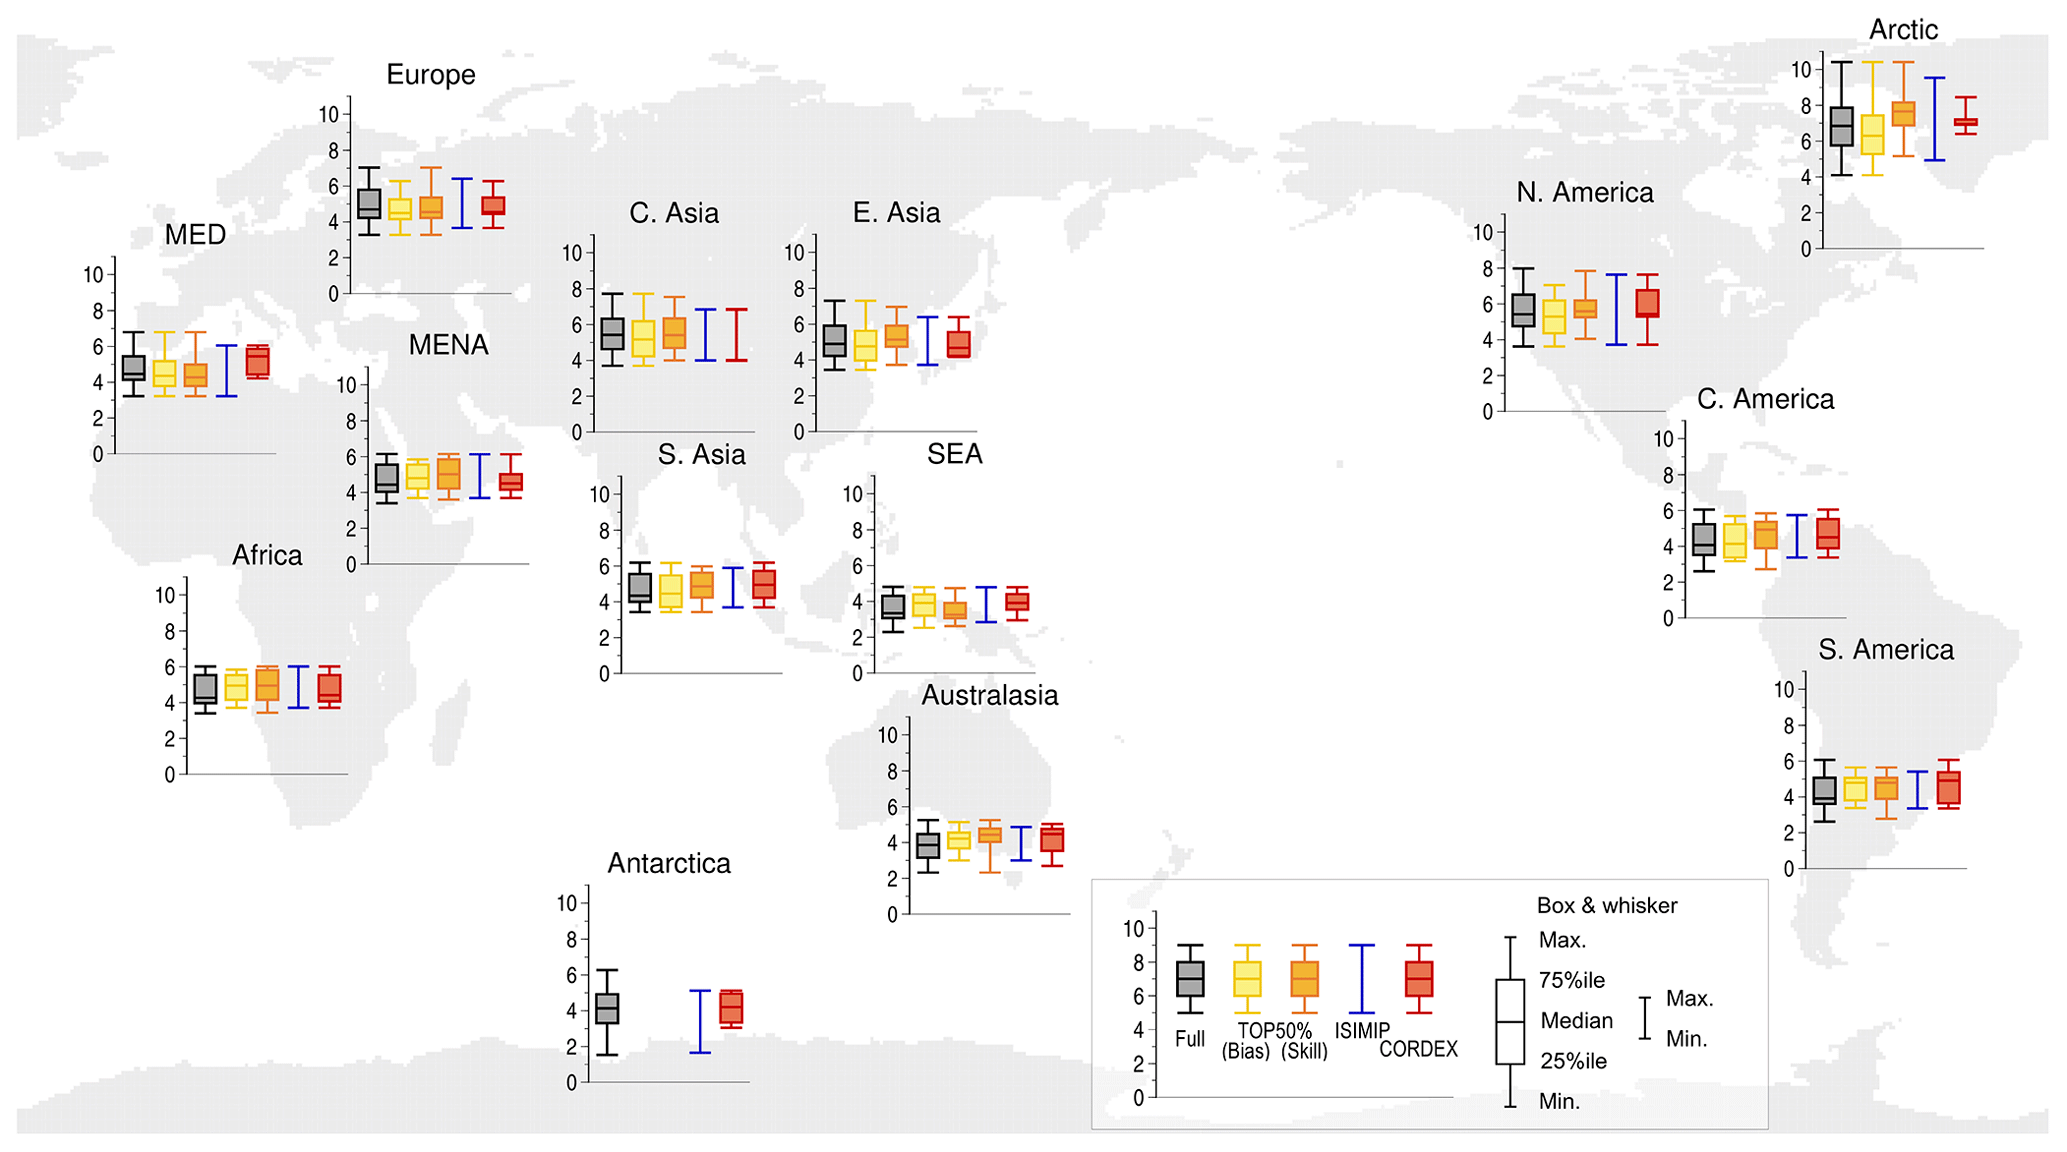
Figure 2Annual mean temperature increments in the future climate projection (K). The whiskers of the box plots show the range between the maximum and the minimum increments. The boxes and the lines within the boxes show the 25th to 75th percentile range and the median respectively. Box plots indicate the increment in the full set of 42 CMIP5 models (black), the model sets with the top 50 % of the CMIP5 models for the bias (yellow) or Taylor's skill score (orange) and the model sets selected for ISIMIP (blue) and CORDEX (red). The top 50 % of the CMIP5 models cannot be plotted over Antarctica because of the lack of CRU reference data.
The uncertainty range associated with the projected change in annual precipitation is shown in Fig. 3. Compared with ΔT in Fig. 2, model selection has a large impact on the reduction of the uncertainty in ΔP, as was also found by MJ2016 using five GCMs used in the fast track of ISIMIP. The subsets of ΔP(CMIP and ΔP(CMIP cover 70 % and 60 % of the full range of uncertainty from CMIPFull_Future as the average over 14 regions respectively, and cover the full range in Australasia (yellow and orange plots in Fig. 3). The largest difference between the coverages from ΔP(CMIP and ΔP(CMIP appears in East Asia. Therefore, we need to note that, when a model's performance is the condition used to select subsets, the uncertainty changes depending on which evaluation index is used, for example whether we use the bias or the skill score. The CORDEX subsets capture more than 50 % of the full range in eight regions (Europe, MED, Africa, SEA, Australasia, Central America, South America and Antarctica). On the other hand, the ISIMIP subsets capture less than 60 % of the full range in all regions. In 11 regions, the CORDEX subsets capture a wider range than the ISIMIP subsets, a result markedly different than for ΔT, where both CORDEX and ISIMIP have relatively large coverage as seen in Fig. 2. Therefore, the subset of four models used in ISIMIP2b has difficulty capturing the uncertainties in regional precipitation change. This result is the same as stated using the subset of five models used in the fast track of ISIMIP discussed by MJ2016, despite two of the five models being changed.
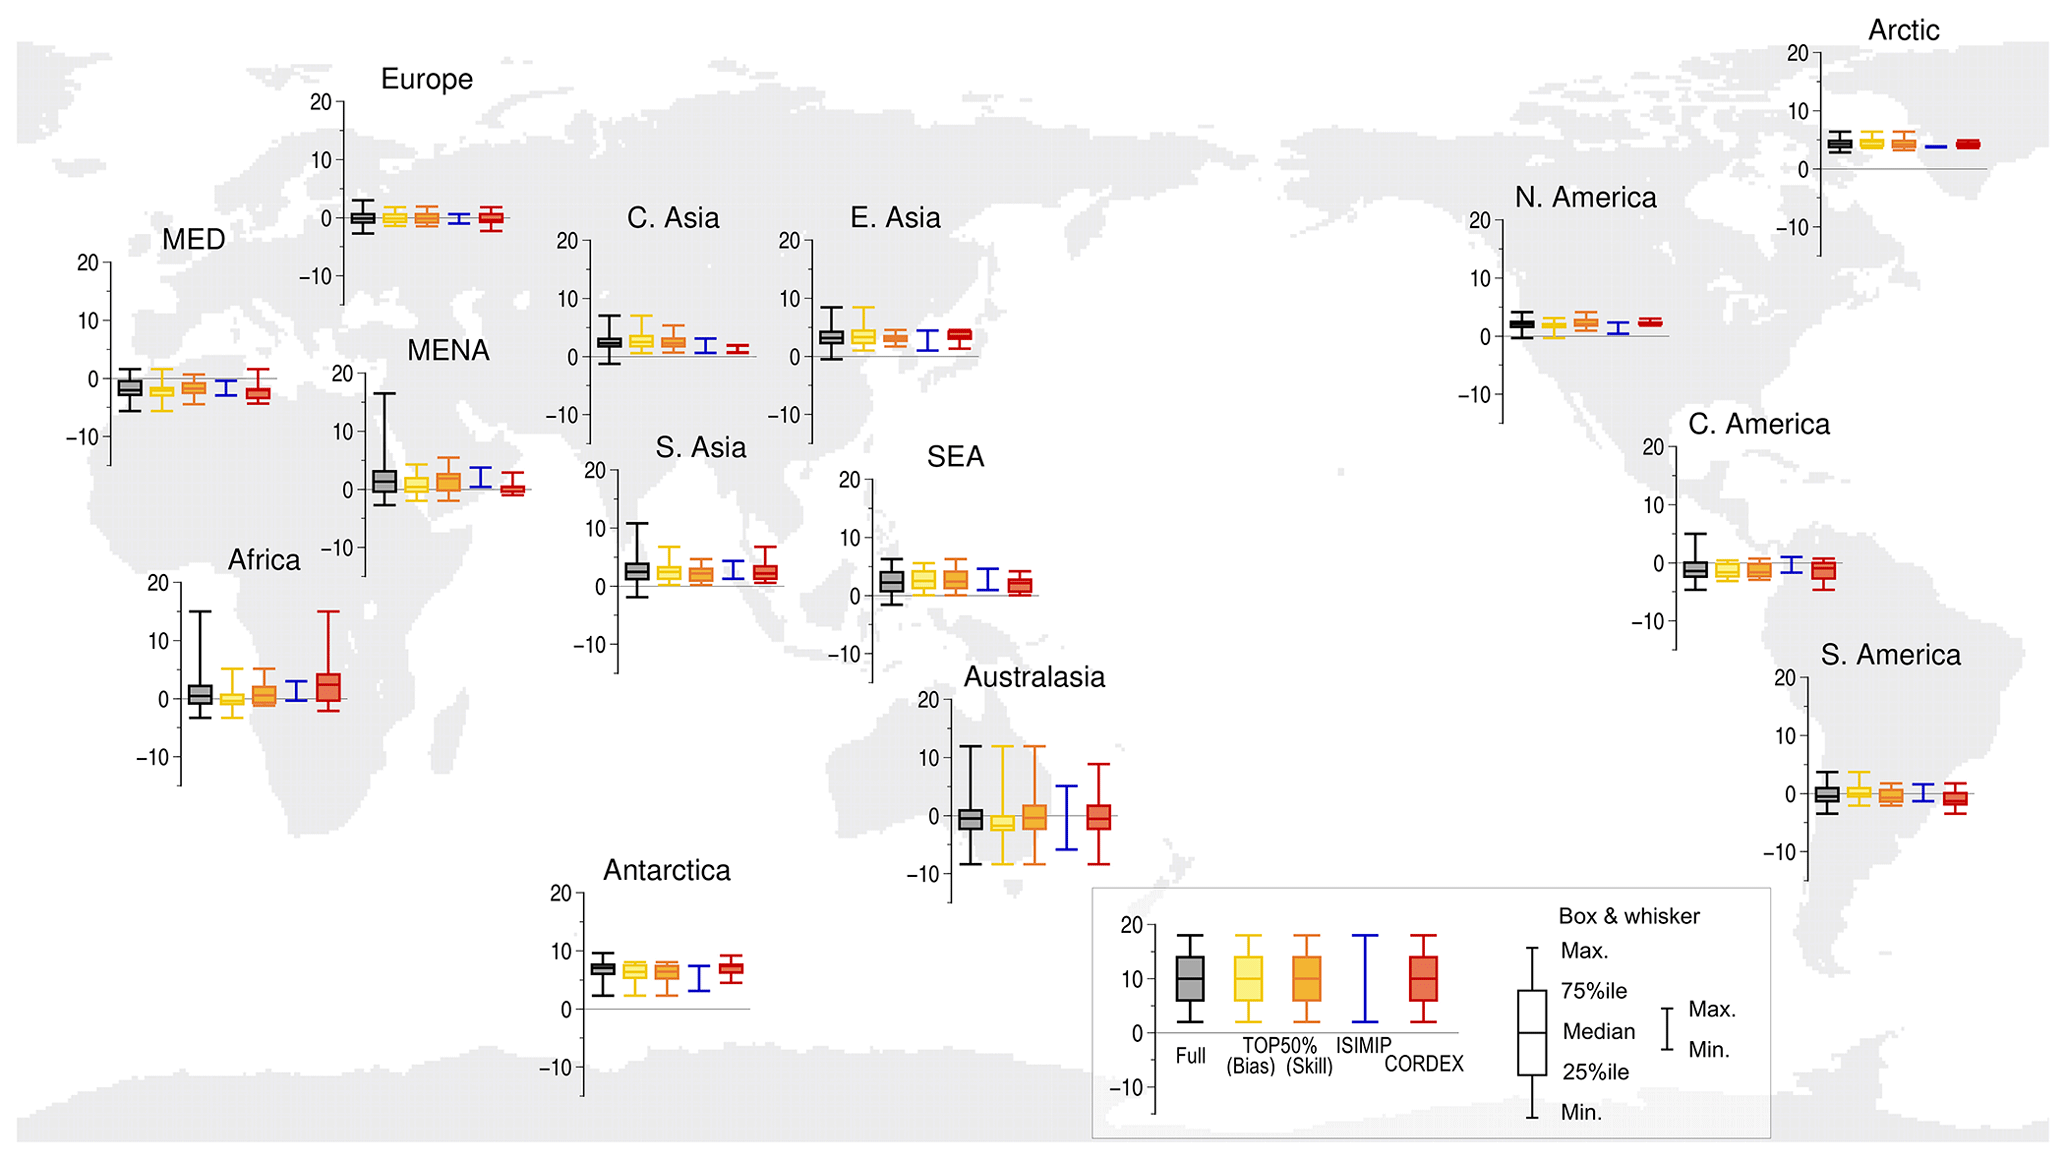
Figure 3As for Fig. 2, but for the projected change in annual mean precipitation scaled to the regional mean temperature increment over land (% K−1).
The uncertainty range (maximum–minimum) is narrowed by using the subsets, but the interquartile range of ΔP(CORDEX), IQR(ΔP(CORDEX)), shows a high coincidence with IQR(ΔP(CMIPFull_Future)), as well as with IQR(ΔP(CMIP and IQR(ΔP(CMIP. The maximum–minimum range of ΔP(ISIMIP) also captures IQR(ΔP(CMIPFull_Future)). Therefore, the CORDEX and ISIMIP subsets can capture the average tendency of the change projected by the 25th to 75th percentile of CMIPFull_Future. In addition, the median of the uncertainty range is similar between the CORDEX subset and CMIPFull_Future. In Central Asia, the full range of ΔP(CORDEX) remains below the 25th percentile of ΔP(CMIPFull_Future), while the maximum–minimum range of ΔP(ISIMIP) adequately covers the IQR(ΔP(CMIPFull_Future)). Thus the three models of the CORDEX subset in Central Asia underestimate the average tendency of the change projected by CMIPFull_Future, despite that, differing from ISIMIP, CORDEX can select suitable models for examination of climate change in Central Asia.
3.3 Comparison of uncertainty of the projected changes using randomly sampled models
We investigated whether the ISIMIP or CORDEX subsets were more suitable for capturing the uncertainty range obtained from CMIPFull_Future by comparing the fractional coverage of uncertainty, FRA, of each subset with those of 10 000 randomly sampled subsets of CMIPFull_Future. As a result, the ISIMIP subset (four models) shows high coverage for the temperature change in all regions compared with the random samples and low coverage for the precipitation change in more than 60 % of all regions. By contrast, the CORDEX subset yields relatively wide coverage for the temperature and precipitation changes, but this depends on the number of models used.
Figure 4 illustrates FRA of the ISIMIP and CORDEX subsets (referred to as FRAISIMIP and FRACORDEX respectively) in each region. Along the x axis, the name of regions is arranged in ascending order of the number of models used in CORDEX. The number of models used in CORDEX is indicated in each set of parentheses after the name, and by contrast, the number in ISIMIP is four in all regions. The y axis indicates FRA of the uncertainty from each subset relative to that from the full set. The bar represents the distribution of the FRA values obtained from the possible 10 000 random samples (FRARandom). The blue bar represents the distribution using the subsets with four models as large as the ISIMIP subset (FRARandom_I), and the red bar represents that with the same number of models used in CORDEX (FRARandom_C). The ends of the bar indicate the lowest and highest values of FRA, and the ends of the bar with a dark colour and horizontal line in the bar denote the 25th and 75th percentiles and the median respectively.
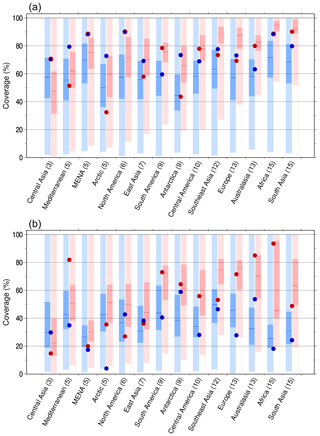
Figure 4Coverage performance of the ISIMIP and CORDEX subsets compared with the range of the full set of CMIP5 models for (a) annual mean temperature increment and (b) precipitation change scaled to the regional mean temperature increment. Blue and red dots indicate the coverage (FRA) in ISIMIP and CORDEX respectively for each region. Blue bars indicate the spread of FRA when four models, as in ISIMIP, are selected randomly in 10 000 times. Red bars indicate the spread when randomly selecting the same number of models as in CORDEX, e.g. 10 models in Central America. The full range of the coloured bars indicates the minimum-to-maximum coverage of the FRA spread. Dark blue and red bars indicate the 25th to 75th percentile range. Horizontal lines in the dark blue and red parts indicate the median. Numbers in parentheses are the number of models used in CORDEX.
For the temperature change, ΔT, FRAISIMIP and FRACORDEX (blue and red dots respectively) exceed 60 % in 13 and 10 regions respectively (Fig. 4a). However, FRACORDEX is located around the 25th percentile or less of FRARandom_C (the bottom of dark red bar) in MED, East Asia, SEA, Europe and the polar regions where FRACORDEX is lower than FRAISIMIP. In the region with larger model ensemble in CORDEX, FRACORDEX tends to be less than the median of FRARandom_C (horizontal red line). On the other hand, FRAISIMIP is typically around the 75th percentile (the top of dark blue bar) or higher than the median (horizontal blue line) of FRARandom_I for all regions.
A relatively high coverage, above ∼50 %, is shown on FRACORDEX for both changes of temperature and precipitation in eight regions when using nine models or more, except for temperature in Antarctica (Fig. 4a, b); that is to say, the CORDEX subset captures more than half of the range from CMIPFull_Future. The value of FRACORDEX for ΔP is lower than that for ΔT. A high coverage of more than 70 %, however, can be gained by the CORDEX subset for ΔP in MED, South America, Europe, Australasia and Africa, which also indicates a high coverage compared with the median of FRARandom_C (except for Europe; Fig. 4b). In half of the regions, FRACORDEX are in the range of the 25th percentile or less of FRARandom_C (the four regions of Asia, MENA, the Arctic and North America). In Central and East Asia and North America, FRACORDEX is smaller than FRAISIMIP, even though CORDEX has the advantage of selecting suitable models for the region and also more models can be used, especially in East Asia and North America. The ISIMIP subsets in Antarctica and Australasia show a larger coverage than the 75th percentile of FRARandom_I, but the FRAISIMIP of 60 % is less than that for ΔT. In more than 60 % of all regions, FRAISIMIP is less than the median of FRARandom_I; the averaged FRAISIMIP over all regions is 33 %.
From the FRA distributions estimated from the possible random samples regarding both changes, ΔT and ΔP, the IQR of FRARandom_C itself rises toward a FRA of 100 % as larger model ensembles are used. When random samples are composed of a subset with 15 models, as large as subsets in CORDEX-Africa and CORDEX-South Asia, the 75th percentile of FRARandom_C is more than 90 % in ΔT (Fig. 4a). In addition, the width of the IQR for ΔT is narrowed with increasing the number of models. The relationship between the number of models and FRA is clearly evident in ΔT because there is a small difference in RFull among regions for ΔT compared with ΔP (Fig. 2), and thus the larger model ensemble results in an increase in FRACORDEX and FRARandom_C. And also, we found that the probability of selecting model subsets with a low coverage was higher for precipitation than for temperature, even if the number of models selected increases.
From Fig. 4, the subsets with nine models or more can capture the uncertainty of projections in both temperature and precipitation widely, implying that there is a heterogeneity in the dataset in a different number of models (Gutowski et al., 2016). We explored whether a similar tendency can be obtained in the other regions when the number of models changed. The same approach was performed by MJ2016. They estimated the coverage of the uncertainty in each of the grid cells for each number of models to investigate the change of the widest coverage performance in the global or regional average depending on the number of models. On the other hand, in this study, to consider making better use of the current subsets, we investigated how the coverage changes with changing the number of models from the current model members.
Figure 5 shows the change of coverage performance with the number of models changing in each region. When the number of models is larger than the current number, we added models randomly selected to the current members. By contrast, when the number of models is less, we removed models randomly selected from the current members. Here we focused on the median of the FRA values obtained from the possible 10 000 random samples, meaning the FRA value obtained with a possibility of 50 % when selecting subsets randomly. For the temperature change, the median exceeds 60 % in all regions when changing the number of models from the current four ISIMIP members to seven members (Fig. 5a). The median above 60 % is also obtained in 13 regions (except for Antarctica) when changing the number from the current CORDEX members to nine members. For the precipitation change, the coverage in nine members is above 50 % in 10 regions and in 12 regions by changing the number of models from the current members in ISIMIP and CORDEX respectively (Fig. 5b). Even when using nine members, the median is less than 50 % in the four regions of MENA, Africa and South and East Asia for the change of number from the ISIMIP subset and in the two regions of MENA and North America for that from the CORDEX subset.
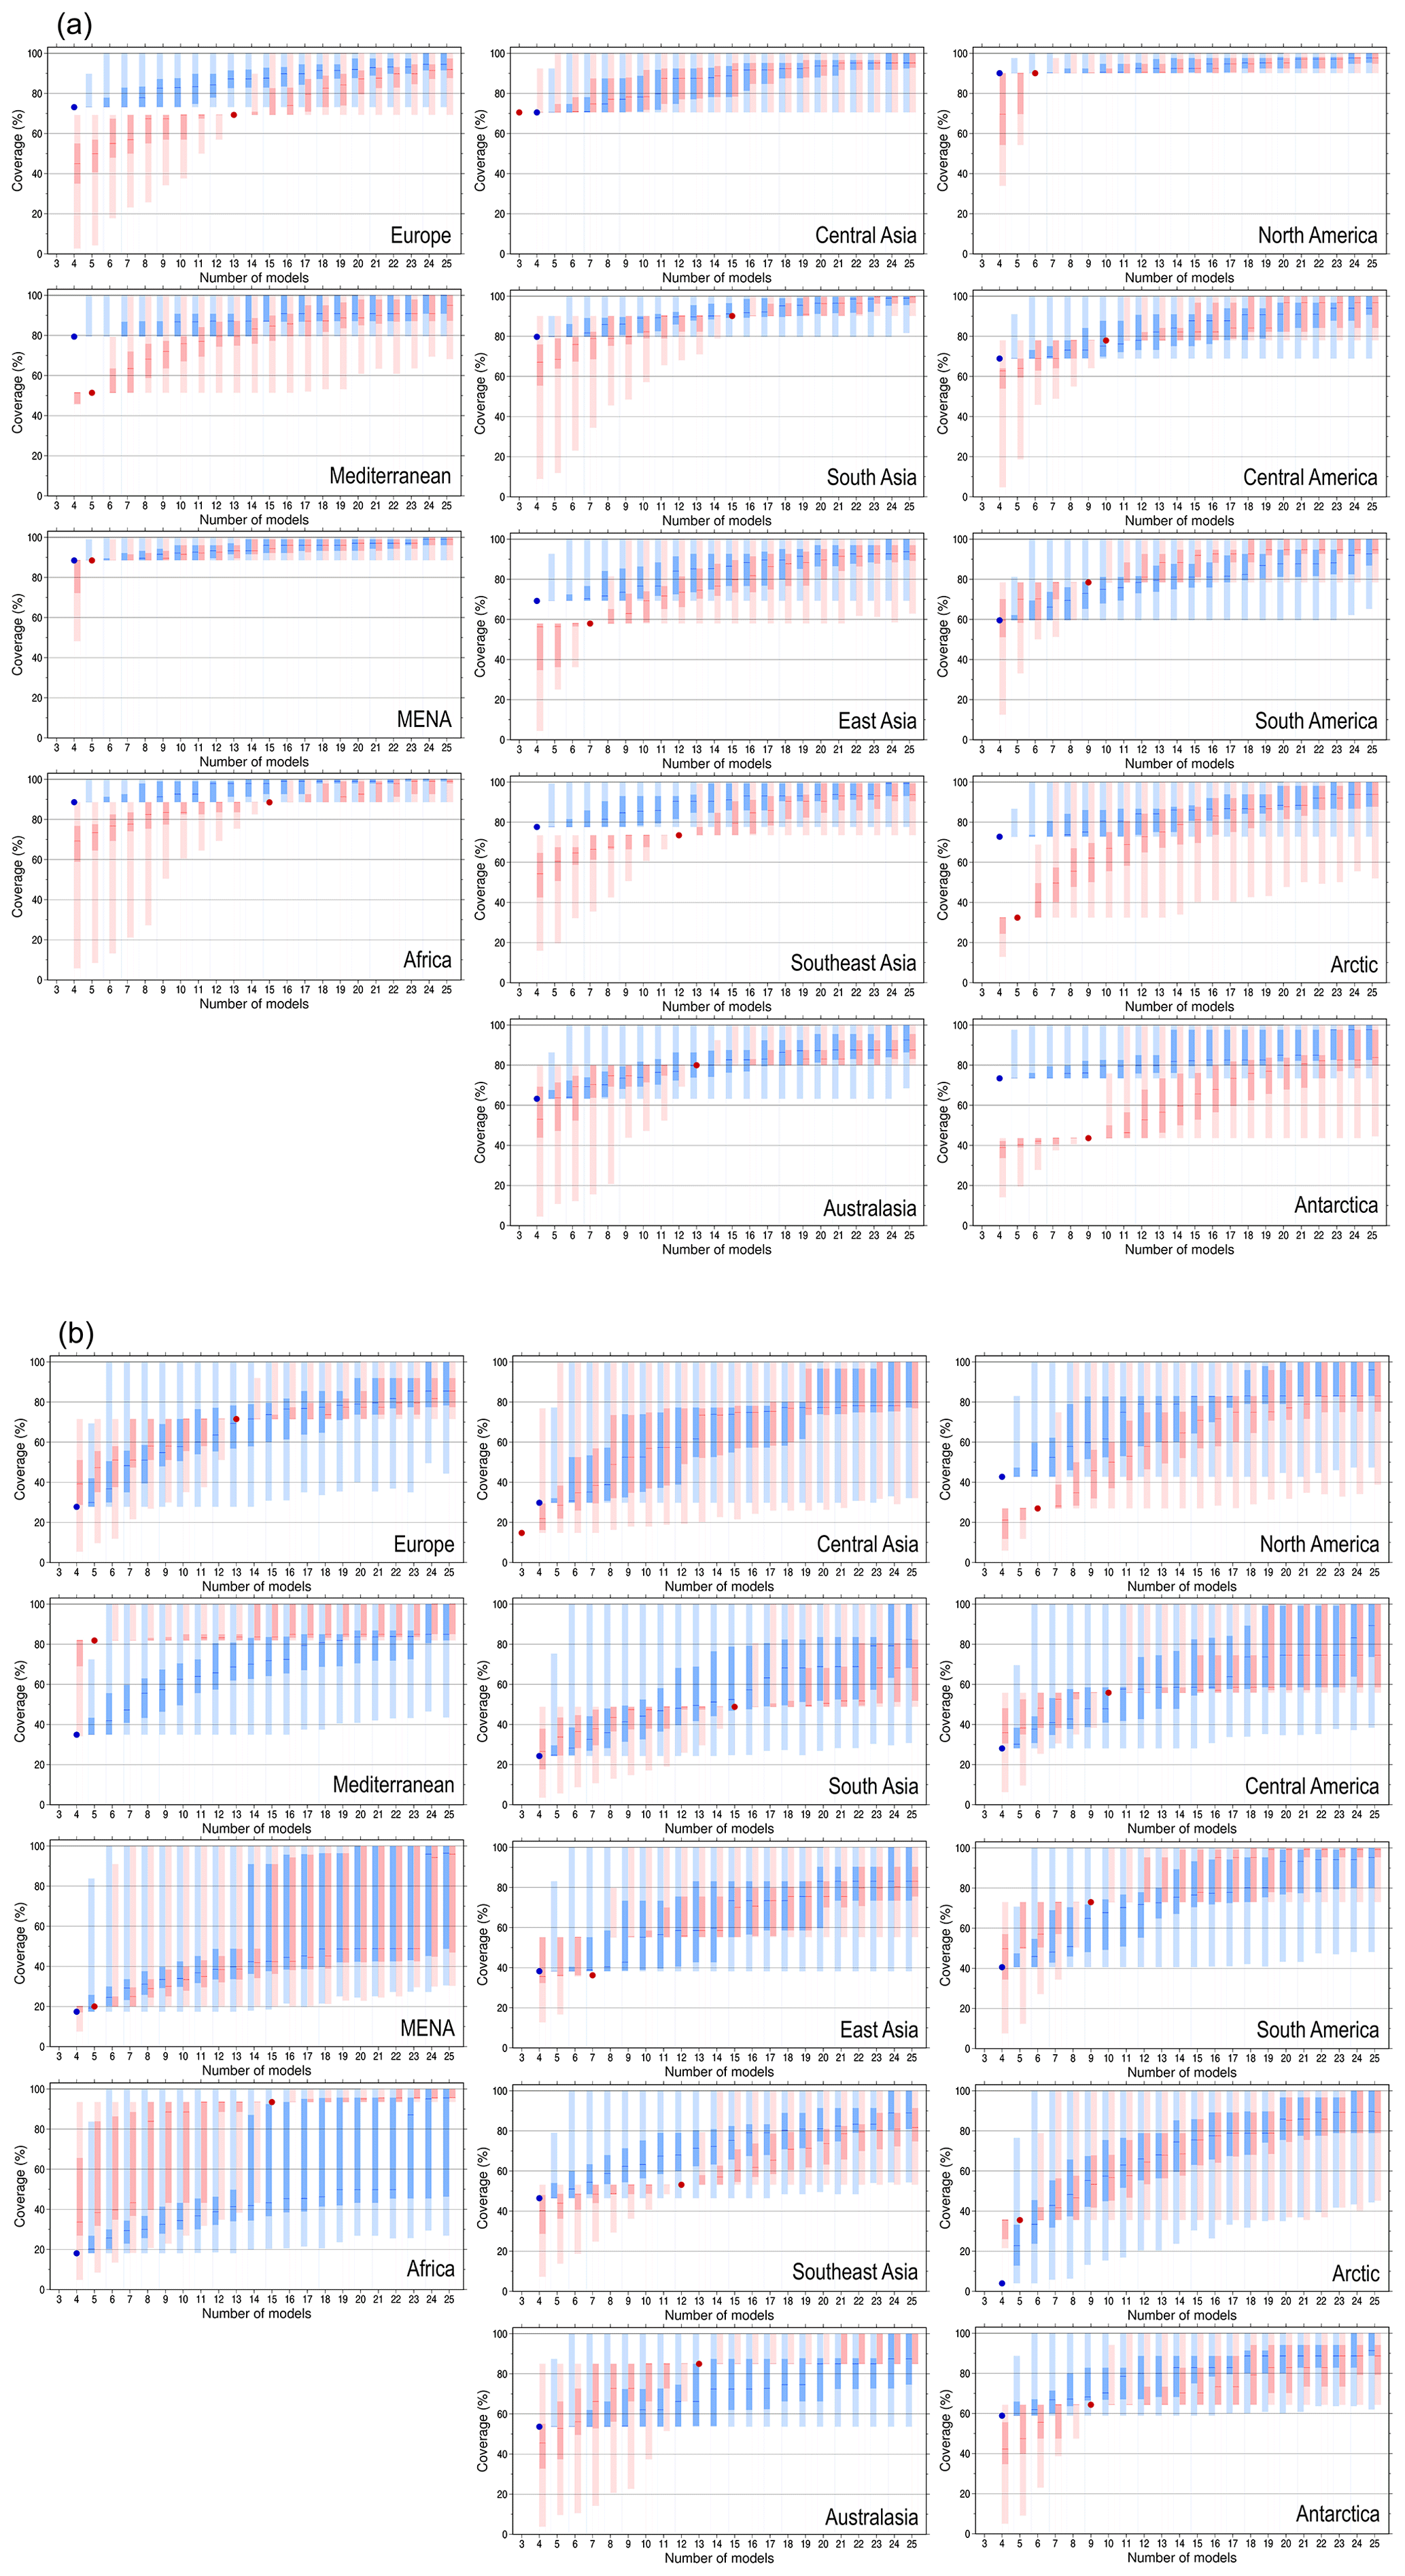
Figure 5Change of coverage performance of the ISIMIP and CORDEX subsets depending on the number of selected models in each region for (a) annual mean temperature increment and (b) precipitation change scaled to the regional mean temperature increment. As Fig. 4, but the x axis denotes the number of selected models.
The IQR for ΔT shifts to a high FRA smoothly with the number of models in all regions. By contrast, the IQR for ΔP sometimes gets large suddenly and/or shifts sharply, for instance, MENA and Africa. The discontinuous change is caused by a large variance of ΔP from each model member. That is to say, when there are model members indicating a large change ratio relative to the other members, the coverage largely differs depending on the inclusion of the member with the large ratio or not. The change amounts, ΔT, are similar among the model members and the variance is small. Thus, the FRA increases with the number of models and the IQR also increases smoothly. To prevent selecting the subset with a large change of coverage dependant on a model with an extremely large or small change amount, investigating the variance of the projections in each region is needed when the number of models is decided.
From the evaluation of the ability to reproduce the regional temperature and precipitation, it is found that the ISIMIP and CORDEX subsets include the models indicating a larger bias and a worse score than high-performance models in the full set. Therefore, a much better model subset, with regard to biases and skill scores, can be selected with making use of the advantage of the small number of models. However, note that such a selection can be conducted when there are no constraints of data availability, which was the main constraint to selecting the current subsets in ISIMIP and CORDEX and when we use one variable of either temperature or precipitation. Focusing on one variable of either temperature or precipitation, 13 high-performance models (out of 25) are included in both subsets of high-performance models for the bias and skill score (Fig. S2). In addition to the two indices of bias and skill score for one variable, the number of models indicating high performance for both the variables of temperature and precipitation is zero at the minimum in Southeast Asia and the Arctic and nine at the maximum in Africa. The averaged number over the regions is approximately four. Therefore, for one variable, there is a possibility of 50 % that a model with a small bias shows a high skill score, but it is difficult to select such models for the variables of temperature and precipitation.
In this study, we assessed the current ISIMIP and CORDEX subsets to investigate whether their model ensemble indicates small biases in the historical climatology and covers the uncertainty in the future projections widely using temperature and precipitation. Both variables are most frequently used in future projections and also weather forecasts. The evaluation for such a principal variable is important for the studies of ISIMIP and CORDEX. It should be noted, however, that ISIMIP needs a dataset with reasonable values for multiple variables used in their impact assessment and with enough coverage of projection uncertainties. CORDEX requires the dataset to have values based on a plausible mechanism of the climatology as the input data for RCMs. Thus, it is possible that a good subset which we presented based on model performance for temperature and precipitation will be an option of their future subsets.
Although ISIMIP and CORDEX have tight constraints for model selection at the present, both programs will select the subset showing a reasonable climate based on a plausible mechanism in the future. Two variables of temperature and precipitation are not possibly sufficient for the model selection. At least for the regional climatological studies and the assessment of its impact, it is important to reproduce large-scale atmospheric circulation patterns which characterize the regional climate. In particular, the spatial pattern of precipitation depends on the accuracy of the circulation. Indeed, model change in ISIMIP from the fast track to ISIMIP2b has already been performed with a consideration of the ability to reproduce El Niño–Southern Oscillation and monsoon (Frieler et al., 2017). The evaluation method used in this study can be applied to the other variables when one has access to reference data. For instance, Taylor's skill score, which we used to evaluate the pattern of temperature and precipitation, can also apply to the pattern of circulation, indicated by sea level pressure (SLP) and geopotential height.
It is also preferable to select subsets in the next generations based on a combined approach that can consider the ability to reproduce multiple variables, although, as described above, it is more difficult to obtain enough models as more variables and evaluation indices are employed. As the first step of the combined approach, it could be good that the evaluation of SLP indicates the large-scale circulation, which has an influence on the precipitation pattern, instead of precipitation itself. This combination might provide an adequate number of members, which is found to be difficult using the combination of temperature and precipitation here. Regarding combined approaches for future changes, Fig. 5 shows that the coverage of FRARandom_C is relatively high on both variables when the number of members is large. Thus, there is a possibility to cover the projection uncertainties for both variables widely by applying a region-specific ensemble and an adequate number of its ensemble members, while paying attention to the variance of the projections. The method above is one suggestion regarding the approaches, and the construction of such an approach is an important task for both programs in the future.
We explored the ability of the subsets of the CMIP5 multimodel ensemble used in ISIMIP2b and CORDEX to reproduce the observed temperature and precipitation, and how the subsets capture the uncertainty in projected change of temperature and precipitation obtained from the full set of the ensemble. In addition, we discussed whether each subset shows a high coverage of the uncertainty in projected climate change compared with the possible subsets generated using 10 000 random samples.
The spreads of the bias and Taylor's skill score from the subsets used in ISIMIP and CORDEX are smaller than those obtained from the full set of CMIP5 ensemble for the annual mean temperature and precipitation. However, despite the smaller model ensemble in ISIMIP and CORDEX, the largest bias and the worst skill score are distributed beyond the biases and the scores obtained from half of the member subsets with less bias or high score of the full set. Therefore, although the ISIMIP and CORDEX approaches were able to select models that acceptably represented the historical state, our results suggest that better subsets can be selected by focusing on smaller biases and/or higher scores for representing the historical climate. Note that such a selection can be performed when there are no constraints for the selection and when we use one variable of either temperature or precipitation as the evaluation index. A combined evaluation for both temperature and precipitation remains difficult for obtaining an adequate number of models.
For the projected change in annual mean temperature, the subsets capture more than 60 % of the uncertainty for the full set in the 13 terrestrial regions in ISIMIP and the 10 regions in CORDEX, from the total of 14 regions. The coverage of the uncertainty range by the ISIMIP subset is larger and equal to the coverage by the CORDEX subset in 10 regions by using only four models that are common to all regions. The FRA of the current CORDEX subset tends to be lower than the 50th percentile of the FRAs obtained from the possible 10 000 random samples in the regions where a large model ensemble is used. ISIMIP selected the subset of models with relatively high coverage of the uncertainty from the full set in all regions, compared with the 50th percentile from the random samples.
On the other hand, for the projected change in annual mean precipitation, the FRAs for the CORDEX subset are around the 25th percentile or less of the FRAs from the random samples with the same number of models in half of all regions. However, CORDEX broadly captures the uncertainty range more than ISIMIP, differing from the temperature change. Additionally, a relatively high coverage (>50 %) was obtained for the projections of both temperature and precipitation in eight regions when using nine models or more.
Compared with the random samples, the ISIMIP subset shows high coverage for the temperature change in all regions and, by contrast, low coverage for the precipitation change in more than 60 % of the regions. The CORDEX subset does not perform well compared to the randomly selected samples but is marginally better than ISIMIP at covering uncertainties in the projected change in precipitation when a large model ensemble is used. Therefore, the global common model set used in ISIMIP could have difficulty in capturing the uncertainty in regional precipitation change projections while capturing most of the uncertainty in the temperature change projections. The region-specific model subset, like CORDEX, captures coverage of both uncertainties compared to the global common (ISIMIP) subset, but performs better when a large number of models are used.
The current CORDEX subsets can capture both uncertainties for temperature and precipitation in the regions with a relatively large ensemble. However, it is found that changing the number of models from the current CORDEX members to nine members can capture more than half of the full uncertainty in both projections of temperature and precipitation in more than 85 % of all regions, with a possibility of 50 %. Furthermore, the same is also shown for the ISIMIP subset, but for 70 % of all regions. Focusing on the uncertainty in future projections, this result suggests that the current number of models needs to be increased to seven, or nine if possible, to obtain a similar uncertainty range among the regions.
In this study, we have assessed the subsets using the principal variables of temperature and precipitation. This is not sufficient for selecting subsets in the next generations. We suggest that it is preferable to have a combined approach that can consider the ability not only for temperature and precipitation but also for other variables important in characterizing the regional climate (e.g. the circulation patterns shown by sea level pressure and geopotential height). Construction of such an approach is urgently demanded for both programs.
CMIP5 multimodel dataset is publicly available via the website of Earth System Grid Federation (http://pcmdi9.llnl.gov/, last access: 1 April 2016). Observation products are publicly available online via each website: CRU (https://crudata.uea.ac.uk/cru/data/hrg/cru_ts_4.01/, last access: 27 June 2018), CPC (ftp://ftp.cpc.ncep.noaa.gov/precip/CPC_UNI_PRCP, last access: 26 October 2014), GPCC (https://www.dwd.de/EN/ourservices/gpcc/gpcc.html, last access: 28 December 2015), PRECL (ftp://ftp.cpc.ncep.noaa.gov/precip/50yr/gauge/, last access: 6 April 2017), CMAP (https://ftp-cpc.ncep.noaa.gov/precip/cmap, last access: 17 May 2017), GPCP (ftp://meso.gsfc.nasa.gov/pub/gpcp-v2.2/, last access: 30 May 2017) and MSWEP (http://www.gloh2o.org, last access: 25 May 2018). Code for analysis is available to the editor and reviewers for the purpose of the review. Public access to the code is limited due to the property rights of TOUGOU program, MEXT, Japan; however, the corresponding author can provide the code upon request under the condition of collaborative research.
The supplement related to this article is available online at: https://doi.org/10.5194/gmd-13-859-2020-supplement.
All authors conceptualized the study and participated in the discussion. RI analysed the data and prepared the manuscript and all authors revised the manuscript.
The authors declare that they have no conflict of interest.
The authors acknowledge Noriko N. Ishizaki for useful suggestions and Alice Barthel and one more anonymous referee for discussion and constructive comments. All figures were created by the Generic Mapping Tools (GMT; http://gmt. soest.hawaii.edu, last access: 23 November 2017) ver. 4.5.12.
This research has been supported by two grants: the TOUGOU Program of the MEXT, Japan (grant no. JPMXD0717935561), and the Environment Research and Technology Development Fund of the ERCA, Japan (grant no. ERTDF 2-1904).
This paper was edited by Heiko Goelzer and reviewed by Alice Barthel and one anonymous referee.
Bartók, B., Wild, M., Folini, D., Lüthi, D., Kotlarski, S., Schär, C., Vautard, R., Jerez, S., and Imecs, Z.: Projected changes in surface solar radiation in CMIP5 global climate models and in EURO-CORDEX regional climate models for Europe, Clim. Dynam., 49, 2665–2683, https://doi.org/10.1007/s00382-016-3471-2, 2017.
Beck, H. E., Wood, E. F. Pan, M., Fisher, C. K., Miralles, D. G., van Dijk, A. I., McVicar, T. R., and Adler, R. F.: MSWEP V2 global 3-hourly 0.1∘ precipitation: methodology and quantitative assessment, B. Am. Meteorol. Soc., 100, 473–500, https://doi.org/10.1175/BAMS-D-17-0138.1, 2019.
Bracegirdle, T. J. and Stephenson, D. B.: On the robustness of emergent constraints used in multimodel climate change projections of Arctic warming, J. Climate, 26, 669–678, https://doi.org/10.1175/JCLI-D-12-00537.1, 2013.
Bracegirdle, T. J., Shuckburgh, E., Sallee, J.-B., Wang, Z., Meijers, A. J. S., Bruneau, N, Phillips, T., and Wilcox, L. J.: Assessment of surface winds over the Atlantic, Indian, and Pacific Ocean sectors of the Southern Ocean in CMIP5 models: historical bias, forcing response, and state dependence, J. Geophys. Res.-Atmos., 118, 547–562, https://doi.org/10.1002/jgrd.50153, 2013.
Cannon, A. J.: Selecting GCM scenarios that span the range of changes in a multimodel ensemble: application to CMIP5 climate extremes indices, J. Climate, 28, 1260–1267, https://doi.org/10.1175/JCLI-D-14-00636.1, 2015.
Chen, M., Xie, P., Janowiak, J. E., and Arkin, P. A.: Global land precipitation: a 50-yr monthly analysis based on gauge observations, J. Hydrometeor., 3, 249–266, https://doi.org/10.1175/1525-7541(2002)003<0249:GLPAYM>2.0.CO;2, 2002.
Frieler, K., Lange, S., Piontek, F., Reyer, C. P. O., Schewe, J., Warszawski, L., Zhao, F., Chini, L., Denvil, S., Emanuel, K., Geiger, T., Halladay, K., Hurtt, G., Mengel, M., Murakami, D., Ostberg, S., Popp, A., Riva, R., Stevanovic, M., Suzuki, T., Volkholz, J., Burke, E., Ciais, P., Ebi, K., Eddy, T. D., Elliott, J., Galbraith, E., Gosling, S. N., Hattermann, F., Hickler, T., Hinkel, J., Hof, C., Huber, V., Jägermeyr, J., Krysanova, V., Marcé, R., Müller Schmied, H., Mouratiadou, I., Pierson, D., Tittensor, D. P., Vautard, R., van Vliet, M., Biber, M. F., Betts, R. A., Bodirsky, B. L., Deryng, D., Frolking, S., Jones, C. D., Lotze, H. K., Lotze-Campen, H., Sahajpal, R., Thonicke, K., Tian, H., and Yamagata, Y.: Assessing the impacts of 1.5 ∘C global warming – simulation protocol of the Inter-Sectoral Impact Model Intercomparison Project (ISIMIP2b), Geosci. Model Dev., 10, 4321–4345, https://doi.org/10.5194/gmd-10-4321-2017, 2017.
Giorgi, F. and Gutowski, W. J.: Regional dynamical downscaling and the CORDEX initiative, Annu. Rev. Environ. Resour., 40, 467–490, https://doi.org/10.1146/annurev-environ-102014-021217, 2015.
Giorgi, F., Jones, C., and Asrar, G. R.: Addressing climate information needs at the regional level: the CORDEX framework, WMO Bull., 58, 175–183, 2009.
Gutowski Jr., W. J., Giorgi, F., Timbal, B., Frigon, A., Jacob, D., Kang, H.-S., Raghavan, K., Lee, B., Lennard, C., Nikulin, G., O'Rourke, E., Rixen, M., Solman, S., Stephenson, T., and Tangang, F.: WCRP COordinated Regional Downscaling EXperiment (CORDEX): a diagnostic MIP for CMIP6, Geosci. Model Dev., 9, 4087–4095, https://doi.org/10.5194/gmd-9-4087-2016, 2016.
Haensler, A., Saeed, F., and Jacob, D.: Assessing the robustness of projected precipitation changes over central Africa on the basis of a multitude of global and regional climate projections, Clim. Change, 121, 349–363, https://doi.org/10.1007/s10584-013-0863-8, 2013.
Harris, I., Jones, P. D., Osborn, T. J., and Lister, D. H.: Updated high-resolution grids of monthly climatic observations – the CRU TS3.10 dataset, Int. J. Climatol., 34, 623–642, https://doi.org/10.1002/joc.3711, 2014.
Huffman, G. J., Bolvin, D. T., Nelkin, E. J., and Adler, R. F.: GPCP version 2.2 combined precipitation data set, Research Data Archive at the National Center for Atmospheric Research, Computational and Information Systems Laboratory, Boulder, CO, https://doi.org/10.5065/D6R78C9S, 2015.
Karmalkar, A. V.: Interpreting results from the NARCCAP and NA-CORDEX ensembles in the context of uncertainty in regional climate change projections, B. Am. Meteorol. Soc., 99, 2093–2106, https://doi.org/10.1175/BAMS-D-17-0127.1, 2018.
Knutti, R.: The end of model democracy?, Clim. Change, 102, 395–404, https://doi.org/10.1007/s10584-010-9800-2, 2010.
McSweeney, C. F. and Jones, R. G.: How representative is the spread of climate projections from the 5 CMIP5 GCMs used in ISI-MIP?, Clim. Serv., 1, 24–29, https://doi.org/10.1016/J.CLISER.2016.02.001, 2016.
McSweeney, C. F., Jones, R. G., Lee, R. W., and Rowell, D. P.: Selecting CMIP5 GCMs for downscaling over multiple regions, Clim. Dynam., 44, 3237–3260, https://doi.org/10.1007/s00382-014-2418-8, 2015.
Mendlik, T. and Gobiet, A.: Selecting climate simulations for impact studies based on multivariate patterns of climate change, Clim. Change, 135, 381–393, https://doi.org/10.1007/s10584-015-1582-0, 2016.
Reichler, T. and Kim, J.: How well do coupled models simulate Today's climate?, B. Am. Meteorol. Soc., 89, 303–312, https://doi.org/10.1175/BAMS-89-3-303, 2008.
Schellnhuber, H. J., Frieler, K., and Kabat, P.: The elephant, the blind, and the intersectoral intercomparison of climate impacts, P. Natl. Acad. Sci. USA, 111, 3225–3227, https://doi.org/10.1073/PNAS.1321791111, 2014.
Schneider, U., Becker, A., Finger, P., Meyer-Christoffer, A., Rudolf, B., and Ziese, M.: GPCC full data reanalysis version 7.0: monthly land-surface precipitation from rain gauges built on GTS based and historic data, Research Data Archive at the National Center for Atmospheric Research, Computational and Information Systems Laboratory, Boulder, CO, https://doi.org/10.5065/D6000072, 2016.
Shiogama, H., Emori, S., Hanasaki, N., Abe, M., Masutomi, Y., Takahashi, K., and Nozawa, T.: Observational constraints indicate risk of drying in the Amazon basin, Nat. Commun., 2, 253, https://doi.org/10.1038/ncomms1252, 2011.
Simpson, I. R., Seager, R., Ting, M., and Shaw, T. A.: Causes of change in Northern Hemisphere winter meridional winds and regional hydroclimate, Nat. Clim. Change, 6, 65–70, https://doi.org/10.1038/nclimate2783, 2016.
Smith, I. and Chandler, E.: Refining rainfall projections for the Murray Darling Basin of south-east Australia – the effect of sampling model results based on performance, Clim. Change, 102, 377–393, https://doi.org/10.1007/s10584-009-9757-1, 2010.
Sun, Q., Miao, C., Duan, Q., Ashouri, H., Sorooshian, S., and Hsu, K.-L.: A review of global precipitation data sets: data sources, estimation, and intercomparisons, Rev. Geophys., 56, 79–107, https://doi.org/10.1002/2017RG000574, 2018.
Taylor, K. E.: Summarizing multiple aspects of model performance in a single diagram, J. Geophys. Res.-Atmos., 106, 7183–7192, https://doi.org/10.1029/2000JD900719, 2001.
Taylor, K. E., Stouffer, R. J., and Meehl, G. A.: An overview of CMIP5 and the experiment design, B. Am. Meteorol. Soc., 93, 485–498, https://doi.org/10.1175/BAMS-D-11-00094.1, 2012.
The intersectoral impact model intercomparison project: ISIMP project design and simulation protocol, available at: https://www.isimip.org/protocol/#isimip-fast-track (last access: 23 January 2019), 2018.
Warszawski, L., Frieler, K., Huber, V., Piontek, F., Serdeczny, O., and Schewe, J.: The inter-sectoral impact model intercomparison project (ISI–MIP): project framework, P. Natl. Acad. Sci. USA, 111, 3228–3232, https://doi.org/10.1073/pnas.1312330110, 2014.
Xie, P. and Arkin, P. A.: Global precipitation: a 17-Year monthly analysis based on gauge observations, satellite estimates, and numerical model outputs, B. Am. Meteorol. Soc., 78, 2539–2558, https://doi.org/10.1175/1520-0477(1997)078<2539:GPAYMA>2.0.CO;2, 1997.
Xie, P., Chen, M., and Shi, W.: CPC unified gauge-based analysis of global daily precipitation, in: Proceedings of 24th Conf. on Hydrology, Amer. Meteor. Soc., Atlanta, GA, 18 January 2010, 2.3A, 2010.